
Antarctica doesn’t change all at once. It shifts in pieces. For decades, most of the continent’s icy edge has barely budged. But in a handful of vulnerable regions, the ice is quietly pulling back – losing ground in ways that add up to the size of a major metro area every few years.
A new long-term map led by glaciologists at the University of California, Irvine shows both stories at once: striking stability across much of Antarctica and deep “wounds” where the ice is retreating inland.
Mapping Antarctica’s ice anchors

By stitching together three decades of satellite observations, the team produced the first continent-wide record of grounding line movement since the mid-1990s.
Their results show that 77 percent of Antarctica’s coastline has remained stable since 1996. Elsewhere, concentrated retreat has removed about 4,950 square miles of grounded ice over 30 years.
“The grounding line is where continental ice meets the ocean, and measuring the movement of grounding lines with satellite-based synthetic aperture radar has been our gold standard for documenting stability,” said lead author Eric Rignot, a professor of Earth system science at UC Irvine.
“We’ve known it’s critically important for 30 years, but this is the first time we’ve mapped it comprehensively across all of Antarctica over such a long time span.”
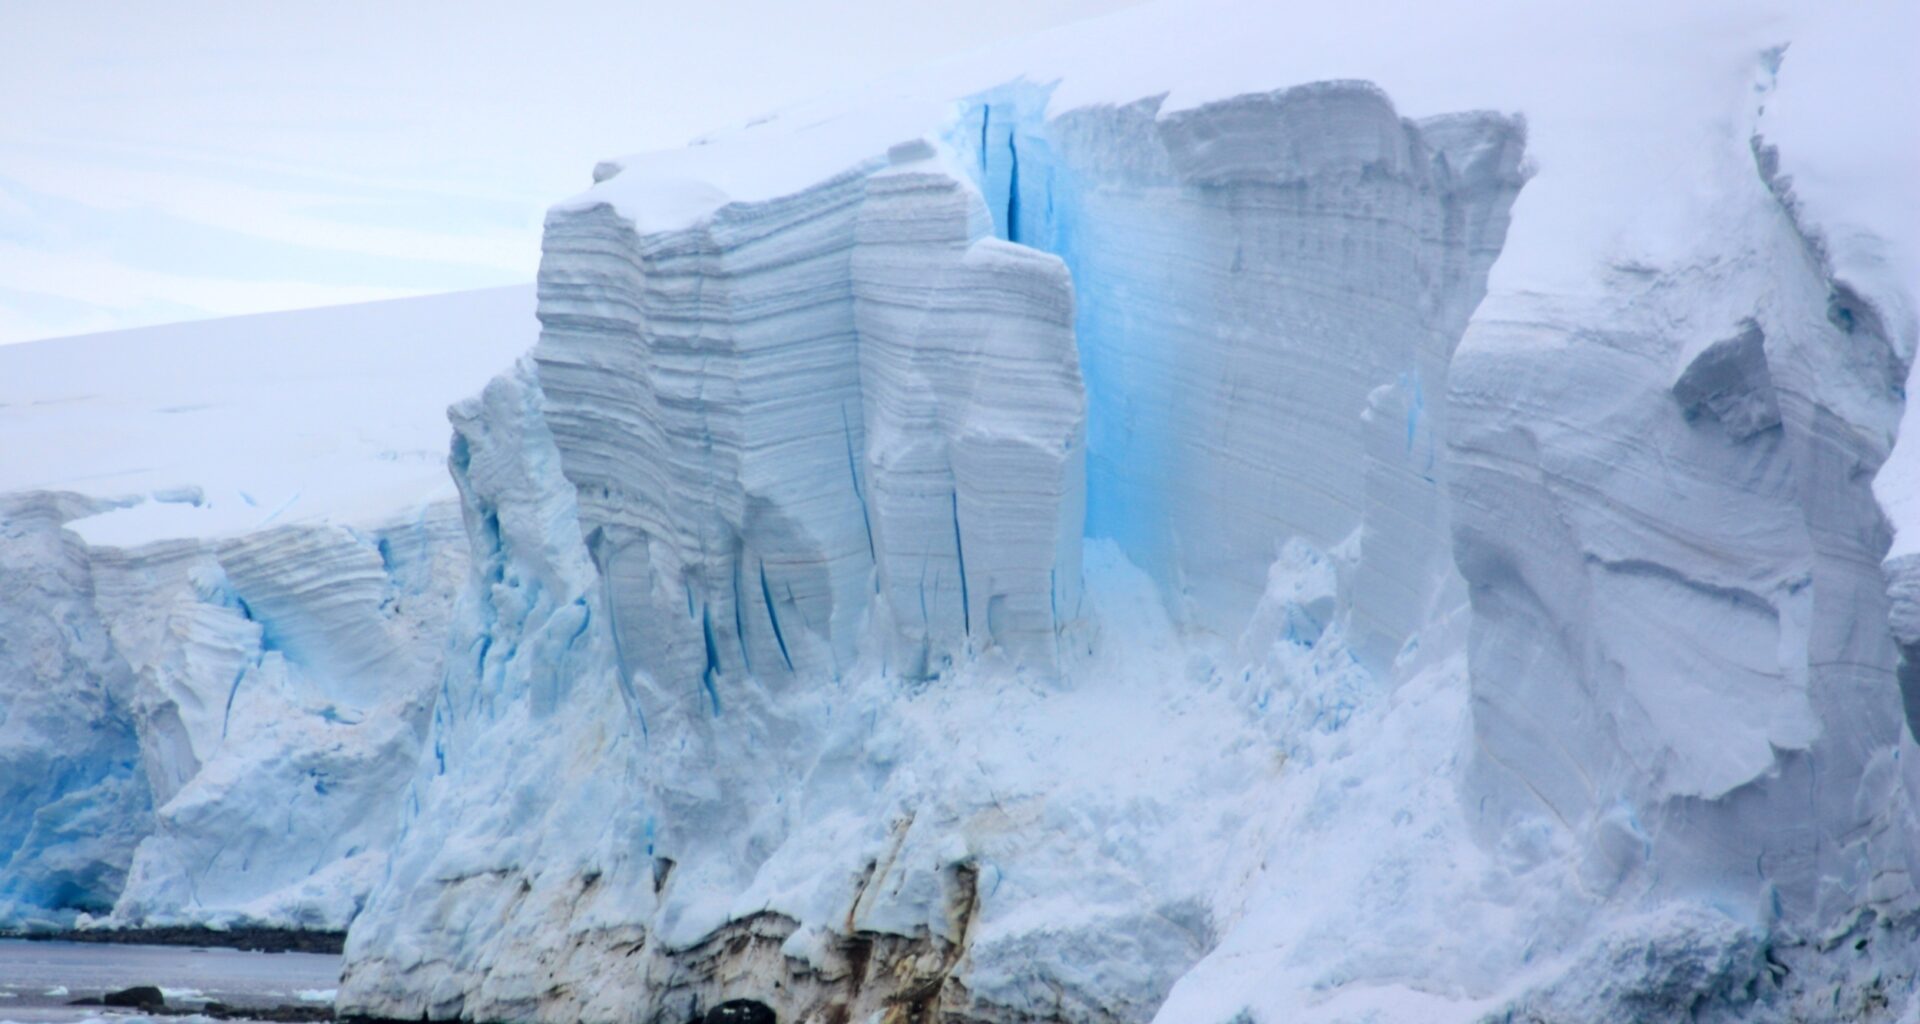
Where ice meets ocean
The grounding line is a kind of hinge point. Upstream, ice is grounded on bedrock. Downstream, it becomes afloat as an ice shelf.
When the grounding line retreats inland, it can signal that the ice sheet is losing its grip on Antarctica, making further loss easier in some settings.
The new map turns that concept into a measured history. Across the full ice sheet, the team calculated an average retreat rate equivalent to 171 square miles per year at the grounding line.
That headline number hides the real story. Most places barely moved. A smaller set of regions moved significantly.
The biggest retreats were concentrated in West Antarctica, the Antarctic Peninsula, and sections of East Antarctica.
In those hotspots, the grounding line shifted inland on Antarctica enough to represent sustained withdrawal of grounded ice. Over the full study period, the cumulative loss of grounded area reached nearly 5,000 square miles.
Where the largest “wounds” are
The most dramatic changes took place in West Antarctica’s Amundsen Sea and Getz sectors, where glaciers retreated by about 6 to 25 miles (10 to 40 kilometers).
Several well-known glaciers stood out. Pine Island Glacier retreated by roughly 21 miles, Thwaites Glacier retreated by 16 miles, and Smith Glacier receded by about 26 miles.
Rignot links those patterns to the ocean’s role in undercutting ice from below. In many places, the decisive factor is whether relatively warm ocean water can reach the base of floating ice and the grounding zone, thinning the ice and encouraging retreat.
“Where warm ocean water is pushed by winds to reach glaciers, that’s where we see the big wounds in Antarctica,” Rignot explained.
“It’s like the balloon that’s not punctured everywhere, but where it is punctured, it’s punctured deep.”
That metaphor captures what the map shows. Antarctica isn’t responding as one uniform system. It’s responding unevenly, with intense change in certain corridors and remarkable stability elsewhere.
Mapping Antarctica from space
The team combined satellite records from multiple countries and space agencies, relying heavily on synthetic aperture radar (SAR).
Unlike optical satellites, SAR can see through clouds and operate during the long polar night, critical advantages in places like Antarctica.
The dataset combined radar observations from major international missions, including ESA’s ERS-1/2 and Sentinel-1; Canada’s RADARSAT series; Japan’s ALOS/PALSAR-2; Italy’s COSMO-SkyMed; Germany’s TerraSAR-X; and Argentina’s SAOCOM.
Commercial satellites join the effort
The project did not rely only on government satellites. The researchers also incorporated commercial radar data, marking an important step for NASA’s Commercial Satellite Data Acquisition program.
Private providers such as Airbus U.S. and ICEYE US expanded coverage in key regions. Additional observations came through collaboration with ICEYE Ltd. in Finland, which has supported other studies of rapidly changing Antarctic glaciers.
Study co-author Bernd Scheuchl from UC Irvine’s Earth system science program pointed out that combining commercial SAR data with long-running agency missions effectively creates a “virtual” radar constellation.
This dramatically increases how often scientists can observe critical polar areas.
“This work shows how commercial SAR data can be used to augment the program of record from agency-run missions,” said Scheuchl.
With access to near-daily observations layered onto decades of international space agency data, researchers can now track polar change with unprecedented consistency.
The result is not just a snapshot. It is a long-term record detailed enough to test why certain regions are especially fragile and to check whether climate models align with what is actually happening on the ice.
Retreat without warm water
Most of the observed retreat patterns line up with the warm-water explanation. But the study highlights one area that doesn’t fit neatly: significant grounding line migration along the northeast Antarctic Peninsula.
“A lot of these places have warm ocean water in proximity, but on the east coast of the peninsula, there’s substantial retreat, and we don’t have evidence for warm water,” Rignot said. “Something else is acting – it’s still a question mark.”
In that region of Antarctica, several ice shelves had already collapsed before the study period began, and a number of glaciers have since retreated.
Edgeworth Glacier lost 10 miles. Boydell, Sjogren, Bombardier, and Dinsmoor also retreated substantially.
The Hektoria, Green, and Evans glaciers calved 13 miles, 10 miles, and 6 miles past their 1996 grounding line positions.
That cluster of changes suggests an ongoing instability, but one whose exact driver is not yet pinned down by the evidence the team has.
What this means for sea level
Beyond documenting change, the grounding line record is meant to be used. Ice sheet models estimate future sea level rise, but they need real-world benchmarks.
“Models have to demonstrate they can match this 30-year record to claim credibility for their projections,” Rignot said.
“That’s the real value of this observational record. If a model can’t reproduce it, the team will need to go back to the drawing board and figure out what boundary condition or physics are missing.”
The dataset also helps explain why different measurement methods sometimes disagree, particularly in East Antarctica. Confirming that 77 percent of the continent has remained highly stable provides an anchor point for interpreting conflicting signals.
At the same time, the record highlights where losses are actively occurring and where risks are concentrated.
“The flip side is that we should perhaps feel fortunate that all of Antarctica isn’t reacting right now, because we would be in far more trouble,” Rignot said. “But that could be the next step.”
The study is published in the Proceedings of the National Academy of Sciences.
—–
Like what you read? Subscribe to our newsletter for engaging articles, exclusive content, and the latest updates.
Check us out on EarthSnap, a free app brought to you by Eric Ralls and Earth.com.
—–