
Fire data
Our analysis focuses on Mediterranean Europe (34–48° N, 10° W–30° E), a region characterized by complex topography, dense and highly flammable vegetation, and dry and hot summers, which together create an exceptionally fire-prone environment. Input data came from the European Forest Fire Information System (EFFIS), developed by the Joint Research Centre (Copernicus Emergency Management Service39). The EFFIS burned-area product provides spatially explicit wildfire perimeters derived from satellite imagery, based on MODIS data (250 m) in earlier years and enhanced since 2008 with higher-resolution Landsat (30 m) and, since 2018, Sentinel-2 (20 m) observations. Each record includes the date of detection (start date) and the burned area (in hectares).
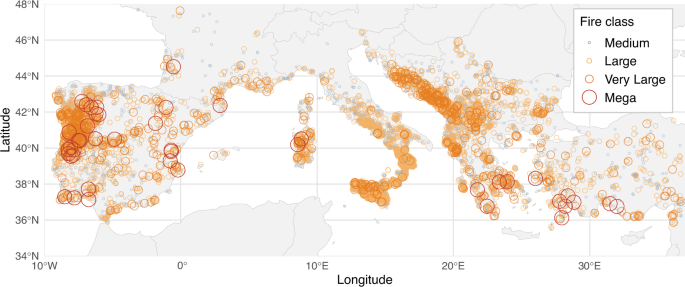
We extracted all wildfires that (i) occurred within the Euro-Mediterranean domain (34–48° N, 10° W–30° E), (ii) burned ≥30 ha, and (iii) ignited during June–September (JJAS), the core fire season1,13,18. The ≥30 ha threshold was adopted because smaller fires are known to be under-detected or inconsistently mapped in EFFIS (https://forest-fire.emergency.copernicus.eu/applications/data-and-services). After removing records from countries lacking continuous EFFIS coverage from 2008 onward and discarding fires with incomplete environmental data, the final dataset retained wildfires from Portugal, Spain, France, Italy, Croatia, Bosnia and Herzegovina, Montenegro, Albania, Kosovo, Serbia, North Macedonia, Bulgaria, Greece, and western Türkiye (country attribution taken from the EFFIS perimeter “country” field), and comprised 11,403 individual wildfire events over 2008–2022. To aid interpretation and comparability, we classified fires into logarithmically spaced size classes. The term megafire has been formalized using a purely spatial “mega–giga–tera” hierarchy based on orders-of-magnitude size thresholds, which provides a familiar language for increasingly large, size-based fire categories2. The lower bound of 30 ha corresponds to the minimum fire size that is consistently and reliably mapped in the EFFIS perimeter database over our study period, ensuring both conceptual consistency with the mega–giga–tera hierarchy and robustness given our data constraints. Following this logic, we fixed our upper class at >10,000 ha, consistent with their definition of megafires, and then defined progressively smaller, order-of-magnitude bins tailored to Mediterranean Europe. Thus, each fire was assigned to one of four size classes: Medium (30–100 ha), Large (100–1000 ha), Very Large (1000–10,000 ha), and Megafire (≥10,000 ha). These categories enabled a formal investigation of how environmental conditions evolve as fires transition from ordinary events to rare, landscape-scale megafires.
Weather and environmental data
To characterize the meteorological and environmental conditions associated with each fire, we used the MESOGEOS environmental datacube28, covering the Mediterranean basin from 2006 to 2022. From this datacube, we extracted a subset of variables representing fast-reacting fire-weather conditions: daily maximum 2-m air temperature, daily minimum relative humidity, daily rainfall, max wind speed, and daytime and nighttime land-surface temperature. We also extracted slow-reacting fuel and vegetation variables: soil moisture index, Normalized Difference Vegetation Index (NDVI), and Leaf Area Index (LAI). MESOGEOS datacube integrates reanalysis-based meteorological variables from ERA5-Land, satellite-derived land-surface temperature and vegetation indices (NDVI and LAI) from MODIS, and soil moisture indices from the European Drought Observatory, harmonized 1 km × 1 km × daily grid. To facilitate comparison across variables and regions, all these were transformed into standardized values (z-scores). Specifically, for each variable, we: (i) computed the mean and standard deviation over all JJAS days in 2008–2022 within the Euro-Mediterranean domain, and (ii) subtracted this JJAS mean from the daily value at the fire location and divided by the JJAS standard deviation. Thus, each standardized variable is a dimensionless value (mean 0, unit variance over JJAS 2008–2022), allowing effect sizes to be interpreted on a common scale and reducing the influence of differing climatic and vegetation regimes across the basin.
Drought indices
We characterized drought conditions using the standardized precipitation–evapotranspiration index (SPEI) at 1-, 3-, and 6-month accumulation periods, derived from the global high-resolution (≈5 km) SPEI dataset29, which spans 1981–2022 and provides multi-scale indices from 1 to 48 months. We focused on 1-, 3-, and 6-month accumulation periods (SPEI-1, SPEI-3, SPEI-6) to test whether short-lived meteorological dryness, seasonal-scale fuel desiccation, or longer-term eco-hydrological stress are more strongly associated with fire-size escalation. Because SPEI is provided at monthly resolution, we assigned each fire a daily value by linearly interpolating between the index values of the previous and current month, so that early-month fires are weighted more towards the previous month and late-month fires towards the current one.
Extraction of predictor variables at fire locations
Pre-processing steps including temporal alignment, spatial intersection, aggregation across intersecting pixels, and treatment of missing coastal values were implemented to align the fire data (target variable) with the weather and drought-related predictors introduced above. Our objective was to produce a harmonized fire-level dataset in which each event is associated with consistent, temporally matched, and spatially explicit environmental conditions around the ignition date. To achieve this, we extracted and aggregated gridded predictor fields at each fire perimeter using a standardized spatial–temporal procedure: all environmental variables were spatially intersected with each fire perimeter to extract gridded values at the fire location. For each fire and each predictor, we proceeded in two steps. First, daily extraction around the reported start date: for each grid cell intersecting a given perimeter, we extracted predictor values on one day before the reported start date (d–1), the reported start date (d), and one day after (d + 1). This ±1-day window accounts for uncertainty in EFFIS start dates, which may not exactly match ignition; the EFFIS burnt area product explicitly notes that reported start dates may not correspond to actual ignition times (EFFIS, 2018). Similar timing uncertainties are documented in other global fire datasets40. Secondly, for each fire, variable and day, we averaged the values across all grid cells intersecting the fire perimeter and we computed a 3-day mean over d–1, d, and d + 1 for each predictor, yielding a single value per fire and variable. Mostly for coastal and island fires, some grid cells were missing due to land–sea discontinuities. To mitigate this, we adopted a stepwise buffering strategy around the fires perimeters16. we first attempted to extract values using the original perimeter, and, only if no valid pixel was found, we progressively expanded the perimeter to 5 km, 10 km and 20 km buffers, stopping as soon as at least one full pixel was captured; if no pixel was available even within the 20 km buffer, the corresponding fire–variable pair was assigned a missing value (NA) and excluded from further analysis. This procedure yielded near-complete coverage for most variables: out of 11,403 fires, the proportion of missing values was 0.48% for LAI, 0.03% for daytime LST, 0.14% for nighttime LST, 0% for NDVI, 1.19% for relative humidity, 1.19% for 2 m temperature, 1.19% for wind speed and 1.19% for rainfall. For the drought-related variables, the fraction of missing values was 3.08% for SPEI-1 and SPEI-3, 2.76% for SPEI-6, and 10.03% for the soil moisture index. This procedure ensures that most coastal wildfires, quite common and often large in the Mediterranean landscapes, are represented with a complete set of environmental predictors.
Fire-size transitions
Here, the term fire-size transition is used in an event-based sense and refers to transitions between successive fire-size classes (e.g., from medium to large fires, and from large fires to megafires) defined by final burned area across different fire events, rather than to the temporal growth of individual fires. For each transition type, we constructed a binary dataset by pooling fires in the lower and upper classes and assigning 0 to events in the lower size class and 1 to events in the upper size class. As an initial, non-parametric assessment, we compared the distributions of each standardized predictor between the lower and upper classes using pairwise two-sided Wilcoxon rank–sum tests. This provides a first indication of whether, for example, anomalously high temperature, low humidity, strong winds, or severe drought disproportionately occur in larger fires.
Random Forest modelling
To identify which predictor variables are most strongly associated with transitions between two fire-size classes, we implemented a Random Forest classification framework41. The candidate predictors comprised all standardized variables from MESOGEOS, including fast-reacting fire-weather variables (temperature, humidity, wind, rainfall, daytime and nighttime land surface temperature) and slow-reacting indicators of fuel and vegetation status (soil moisture, NDVI, LAI) together with the interpolated multi-scale SPEI.
For each transition, we carried out 250 repeated stratified random train–test splits, using an 80%/20% split, combined with down-sampling of the majority class experiments. By “down-sampling experiments” we refer to a set of repeated Random Forest training experiments designed to address class imbalance in the binary classification. Specifically, the majority class was randomly reduced to match (or closely approach) the sample size of the minority class, and the model was repeatedly trained and evaluated on these balanced subsets. In each experiment, we drew a random split of the data, using 80% of the fires for training and 20% for testing while preserving the proportion of lower- and upper-class events (i.e., 0/1). Within each split we removed non-finite or zero-variance predictors, assigned class weights inversely proportional to the class frequencies in the training set to alleviate imbalance (particularly for rare megafires). We then fitted a probabilistic Random Forest classifier using the ranger package by Wright and Ziegler42, implemented in R free software43. Random Forests are ensembles of decision trees fitted on bootstrap resamples and random subsets of predictors. We used 500 trees in each forest (ntree = 500) and set the number of predictors considered at each split to one (mtry = 3). This configuration provides stable predictions at modest computational cost while limiting higher-order interactions and emphasising the marginal effects of individual variables on fire-size transitions, in line with recent applications to weather/climate and fire activity21,44. Results obtained using an alternative Random Forest configuration are reported in Fig. S1. The model outputs the predicted probability that a given fire belongs to the upper size class, from which we computed the Area Under the ROC curve (AUC) on the test set as a measure of predictive skill. To quantify variable importance, we adopted a permutation-based approach. For each fitted RF and its corresponding test set, we first computed a baseline AUC; we then permuted each predictor in turn, recomputed the AUC, and recorded the drop relative to the baseline. This permutation-based importance directly measures the contribution of each variable to correctly predict the observed output (i.e., the upper-class “1”) by assessing the loss in out-of-sample performance when its information is disrupted, and differs from impurity-based measures (i.e. GINI importance). The GINI index quantifies variable importance based on reductions in node impurity during tree construction; it is known to be biased in the presence of correlated predictors or class imbalance (Strobl et al., 2008). Correlations among all candidate predictors were examined and are reported in Fig. S3: as expected, variables describing similar processes (e.g. different SPEI accumulation periods and temperature metrics) are correlated. While Random Forests are robust to multicollinearity in terms of predictive performance, both Gini-based and permutation-based importance metrics can be affected by correlated predictors: in this case Gini-based variable importance should not be interpreted as a strict ranking of individual drivers, but rather as an indication of the relative contribution of groups of variables representing shared underlying processes.
The AUC value, averaged over all repeated random train–test splits, provides a robust, model-agnostic measure of how much each variable contributes to correctly distinguishing larger from smaller fires. For every fire-size transition and each predictor, the distribution of AUC drops is characterized by its mean and the 95% empirical interval. Model performance and variable importance were evaluated on independent test data to avoid optimistic bias associated with class imbalance. We further grouped variables into “fast” (fire-weather) and “slow” (fuel and drought) processes to assess whether rapid atmospheric anomalies or slower fuel-related conditions dominate in explaining escalation towards larger fires and megafires following Luo et al.21.
Logistic regression modelling
To complement the Random Forest analysis, which provides a robust ranking of predictors but not their direction of effect, we constructed out-of-sample logistic regression models to quantify how fast- and slow-reacting variables control transitions between fire-size classes (Fig. 4). Guided by the Random Forest permutation-importance results, which consistently highlighted nighttime land-surface temperature (LSTn), wind speed, SPEI-3, and NDVI as key predictors across most of the transitions, we restricted attention to standardized anomalies of these four variables as candidate best predictors in the logistic models.
All predictors enter the models as standardized values (z-scores), and the response variable is again binary, with 0 for fires in the lower size class and 1 for fires in the upper class, so that positive coefficients indicate conditions that increase the probability of a fire reaching the larger class.
For each transition, we fitted all 15 non-empty combinations of the four predictors (from single-variable models to the full four-predictor model) and evaluated them with a repeated cross-validation scheme. We generated 5-fold stratified partitions of the data, repeated 50 times, resulting in 250 resamples per model and transition. In each resample, four folds were used for training and one-fold for testing. Within the training folds, we balanced the classes by down-sampling the majority class, fitted a logistic regression model with the chosen predictor set, and then predicted the probability of belonging to the upper size class for the held-out fold. Down-sampling was implemented by randomly reducing the majority class within each training fold to match the number of observations in the minority class, while leaving the test fold unchanged. This approach was adopted to stabilise coefficient estimation and uncertainty quantification under strong class imbalance. From these predictions, we computed the AUC, the recall (true positive rate for the upper size class at a threshold of 0.5), and the corresponding false positive rate. We then summarized, for each transition and model, the distribution of these metrics across the 250 resamples using the median and 95% empirical intervals.
For every resample, we stored the estimated regression coefficients (excluding the intercept), and for each transition–model–predictor combination, we derived the median coefficient and a 95% empirical interval from the 2.5th and 97.5th percentiles of this resampled distribution. To guard against multicollinearity, we also performed a pre-screening based on the full (non-downsampled) dataset: for each candidate model with more than one predictor, we fitted a logistic regression once, computed the variance inflation factor (VIF) for each term, and discarded models with a maximum VIF exceeding 2.
Model selection proceeded in two steps. First, we restricted attention to models in which all predictors had 95% coefficient intervals that did not cross zero, ensuring a stable sign of association across resamples while satisfying the VIF criterion. Among these, we then selected, for each transition, the model with the highest median AUC; in the case of identical median AUC values, we favoured higher median recall and, if necessary, the more parsimonious model with fewer predictors. This logistic regression framework therefore provides interpretable effect estimates and uncertainty ranges that complement the Random Forest variable ranking, clarifying whether fast fire-weather anomalies or slower drought and vegetation conditions exert stronger control on the probability of fires transitioning into larger size classes, particularly megafires following Luo et al.21. As a robustness check, we implemented a leave-one-megafire-out jackknife by iteratively excluding each megafire event and refitting the logistic regression models, in order to assess the sensitivity of model performance and coefficient estimates.