
Study population
The six ageing cohorts included in this study were the HRS, ELSA, SHARE, CHARLS, the MHAS and ELSI. The HRS is a population-based longitudinal survey of adults aged ≥51 years in the USA, initiated in 1992 and followed up every two years59. ELSA is a nationally representative cohort study of the English population aged 50 or older, with biennial surveys starting in 2002–200360. SHARE is a multinational panel study of individuals aged ≥50 years in 28 European countries and Israel, with surveys in 2004–2005, 2006–2007, 2010–2011, 2013, 2015, 2017 and 2019–202061. CHARLS is a longitudinal study of Chinese adults aged ≥45 years, comprising four waves conducted in 2011, 2013, 2015 and 201862. The MHAS is nationally representative panel study of Mexican residents aged 50 or older and currently includes five waves interviewed in 2001, 2003, 2012, 2015 and 201863. ELSI is a national cohort study of the population aged ≥50 years in Brazil, which started baseline survey in 2015–2016 and conducted follow-up in 2019–202164. The data collection dates for each cohort are reported by year, and additional details are available in published cohort profiles59,60,61,62,63,64.
We selected these cohorts from the list provided by the Gateway to Global Aging Data platform (https://g2aging.org/survey/overview) on the basis of two criteria: (1) availability of Internet use information and (2) having at least two waves of follow-up. These cohorts follow a similar longitudinal design involving nationally representative samples of middle-aged and older adults. Measures of health and social environment have been harmonized to allow cross-country comparisons through the Gateway to Global Aging Data platform65. All cohorts received ethical approval from relevant local research ethics committees, and participants were recruited after providing written informed consent. The data from all cohorts are publicly available and were obtained according to the established procedures for each cohort. The study was approved by the Human Subjects Ethics Sub-committee of City University of Hong Kong (reference number 2-9-201808_01).
Given the availability of Internet use measurements and comparability of time ranges across the six cohorts, this study used data from waves 9–14 for the HRS (2008–2019), waves 6–9 for ELSA (2012–2019), waves 5–8 for SHARE (2013–2019), waves 1–4 for CHARLS (2011–2018), waves 3–5 for the MHAS (2012–2019) and waves 1–2 for ELSI (2015–2021) (Extended Data Fig. 1). We restricted our samples to adults aged ≥50 years at baseline to ensure that the samples were of consistent ages across countries. Participants who had missing information on Internet use and the three outcomes at baseline, lacked reassessment of the three outcomes at any follow-up survey, had been diagnosed with memory-related diseases or psychological disorders at baseline, or had missing values on baseline covariates were excluded. Finally, three analytic samples were generated for three objectives: to investigate the relationships of (1) Internet use, (2) frequency of Internet use and (3) cumulative Internet use with mental health. We further excluded participants without available polygenic scores in the HRS and ELSA to examine the interaction between Internet use and genetic risk.
MeasuresMental health
An overview of all variables in our analyses is shown in Supplementary Table 10. Two mental health indicators, depressive symptoms (a mental illness indicator) and life satisfaction (a positive mental well-being indicator), were analysed as primary outcome variables in the present study, on the basis of the staging model for mental health2,3. We also included self-reported health, highly correlated with mental health, as the secondary outcome66. Since the measurement of the three health indicators differed across the six cohorts, we standardized the outcome variables to ensure the results were comparable.
Internet use
Data on Internet use were collected through questionnaires. Participants in three of the cohorts were asked to report whether they had used the Internet over different periods: in the past seven days for SHARE, in the past month for CHARLS and in the past 12 months for ELSI. In the HRS, Internet use was assessed by asking, “Do you regularly use the World Wide Web, or the Internet, for sending and receiving e-mail or for any other purpose, such as making purchases, searching for information, or making travel reservations?” The participants from ELSA were asked how often they used the Internet, with seven response options ranging from “Every day, or almost every day” to “Never”. In the MHAS, Internet use was evaluated at the household level on the basis of the question, “Do you have Internet access at home?”, since the individual-level data were not available. Having used the Internet during a specific period (SHARE, CHARLS and ELSI), using the Internet regularly (HRS) or at least “Less than every 3 months” (ELSA), or having access to the Internet at home (MHAS) was defined as Internet use.
On the basis of the binary Internet use variable, we defined cumulative Internet use as the number of waves where participants used the Internet during the first two biennial waves, ranging between 0 and 2. The cumulative Internet use variable was available only for 18 countries with at least three-wave surveys. Additionally, we assessed the frequency of Internet use in the HRS, ELSA and CHARLS. In the HRS, a random half subsample of participants was asked to indicate how often they used the Internet on the basis of a seven-point Likert scale from “Daily” to “Never/Not relevant”. For CHARLS, if participants had used the Internet over the past month, they were further asked to report the frequency of their use with three responses including “Almost daily”, “Almost every week” and “Not regularly”. The frequency of Internet use was categorized as (1) daily, (2) weekly, (3) less than weekly and (4) never.
Covariates
Fourteen covariates were identified at baseline as potential confounders. These included demographic characteristics (age, gender, marital status, household size and contact with others), socio-economic status (education, household wealth and labour force status), health behaviours (current smoking, alcohol consumption and physical activity) and physical health (number of chronic conditions, ADL disability and number of limitations on IADL).
Polygenic scores
The HRS and ELSA used the same procedures to create polygenic scores67,68. Polygenic scores for depressive symptoms and subjective well-being were created using results from a 2016 genome-wide association study (GWAS)69. Polygenic scores for depressive symptoms included all available single-nucleotide polymorphisms (SNPs) that overlapped between the GWAS meta-analysis and the HRS genetic data (1,130,606 SNPs for European ancestry and 1,127,901 SNPs for African ancestry) and the ELSA genetic data (1,187,563 SNPs). Polygenic scores for subjective well-being contained 710,288 overlapped SNPs for European ancestry and 707,989 SNPs for African ancestry in the HRS, as well as 748,500 SNPs in ELSA. The polygenic score was then calculated as the sum of the number of risk alleles at each overlapping SNP weighted by the GWAS meta-analysis effect size. Higher polygenic scores represent more depressive symptoms or better subjective well-being. Following the approach in the previous studies70,71, the polygenic scores were categorized into low (quintile 1 for depressive symptoms and quintile 5 for subjective well-being), intermediate (quintiles 2–4) and high (quintile 5 for depressive symptoms and quintile 1 for subjective well-being) genetic risk.
Statistical analyses
Baseline characteristics by country were summarized using mean (s.d.) or median (interquartile range) for continuous variables or numbers (percentages) for categorical variables. All statistical analyses were conducted using R version 4.3.372. A two-sided P < 0.05 was considered statistically significant. The main analyses were based on the data imputed using multiple imputation by chained equations (mice package) that incorporated all variables in this study. Final estimates were generated by pooling the results of ten imputed datasets using Rubin’s rules73. Following Rubin’s rules, the pooled point estimate can be calculated using equation (1):
$$\overline{Q}=\frac{1}{m}\mathop{\sum }\limits_{i=1}^{m}{\widehat{Q}}_{i}$$
(1)
where \({\widehat{Q}}_{i}\) refers to the point estimate from the imputed dataset i, i = 1,…, m. In our study, m = 10. Total variance can be obtained using the between-imputation variance \(B=\frac{1}{m-1}\mathop{\sum }\nolimits_{i=1}^{m}{\left({\widehat{Q}}_{i}-\overline{Q}\right)}^{2}\) and the average within-imputation variance \(\overline{U}=\frac{1}{m}\mathop{\sum }\nolimits_{i=1}^{m}{\widehat{\rm{Var}}}({\widehat{Q}}_{i})\) with equation (2):
$$T=\overline{U}+\left(1+\frac{1}{m}\right)B$$
(2)
Finally, we calculated the CI for pool estimates using equation (3):
$$\overline{Q}\pm {t}_{v}\left(\frac{\alpha }{2}\right)\sqrt{T}$$
(3)
where tv is the α/2 quantile of the t distribution with v degrees of freedom.
We used a two-stage IPD meta-analysis to pool effects across countries36. In the first stage, we used linear mixed models (lme4 package) with years since baseline as the timescale and person-specific random intercepts to estimate the association between Internet use and subsequent mental health within each country. The linear mixed model is a longitudinal data approach, which can not only account for the correlation between repeated measures on the same individual but also handle missing data and unbalanced designs over the follow-up74. The basic model included Internet use, years since baseline and their interaction. All models were then adjusted for age, gender, marital status, household size, contact with others, education, household wealth, labour force status, current smoking, alcohol consumption, physical activity, chronic conditions, ADL and IADL. The linear mixed model can be expressed as equation (4):
$$\begin{array}{l}{y}_{{ij}}={\beta }_{0}+{\beta }_{1}{{\mathrm{Internet}}}_{i}+{\beta }_{2}{{\mathrm{Time}}}_{{ij}}+{\beta }_{3}{{\mathrm{Internet}}}_{i} \times {{\mathrm{Time}}}_{{ij}}\\\qquad\;+\,{X}_{i}{{\mathbf{\upbeta}} }^{{\prime} }+{b}_{0i}+{\epsilon }_{{ij}}, i=1,\ldots ,N{;}\;j=1,\ldots ,{n}_{i}\end{array}$$
(4)
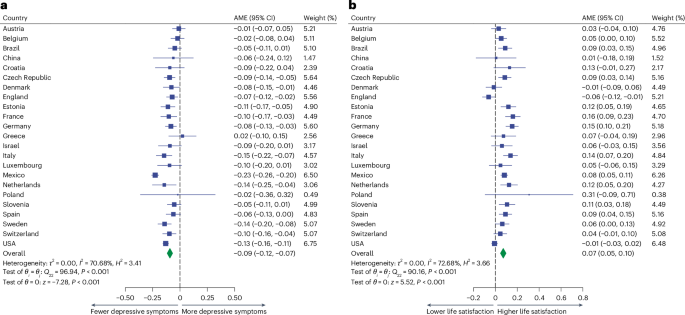
where yij is the mental health outcome for the ith individual measured at the jth follow-up, Interneti denotes the Internet use information at baseline, Timeij is the year since baseline, Xi is the N × p design matrix for baseline covariates, β′ is a p × 1 vector of coefficients, \({b}_{0i} \sim {{N}}(0,{\sigma }_{b}^{2})\) is the random effect for the ith individual and εij ~ N(0, σ2) is the random error. We calculated the AME using equation (5) to illustrate the mean change in the estimated values of each standardized outcome from not using the Internet to using the Internet (marginaleffects package)75.
$${\mathbb{E}}\left({y}_{{ij}}|{{\mathrm{Internet}}}_{i}=1\right){\mathbb{-}}{\mathbb{E}}\left({y}_{{ij}}|{{\mathrm{Internet}}}_{i}=0\right)$$
(5)
The AME is an informative way to evaluate the treatment effect especially in nonlinear regression models76. We examined the association of baseline Internet use and its frequency, as well as cumulative Internet use, with each outcome separately, because of differences in the availability of Internet use data across countries.
In the second stage, we conducted a meta-analysis (metafor package) to calculate the pooled effect using random-effect models. We assessed the between-study heterogeneity (τ2) using the restricted maximum-likelihood method, which can provide relatively unbiased and efficient estimates of between-study variance77. We also assessed heterogeneity using the I2 and H2 statistics and tested it using Cochran’s Q-test. We report the AME with 95% CIs in the meta-analysis results and forest plots. We further conducted meta-regressions to explore the heterogeneity variance in the meta-analysis with seven country-level factors, including gross domestic product per capita, Gini index, world happiness index, Hofstede’s index, Internet use rate, digital skills among the active population and healthy life expectancy at birth, as the independent variable separately (Supplementary Methods). We also performed subgroup meta-analyses to assess whether the type of Internet use measures (including binary, frequency-based and household-level measures) contributed to differences in AMEs.
Because the association of Internet use with later-life health has been suggested to vary between populations (for example, females or males) within each country, we performed an IPD meta-analysis separately in subpopulations stratified by age, gender, marital status, contact with others, education, household wealth, labour force status, current smoking, alcohol consumption, physical activity, chronic conditions and ADL26,27,28. The categories of all modifiers except for age and chronic conditions were predefined (see ‘Covariates’). Age was categorized into 55–64 years and ≥65 years according to the definition of older people by the United Nations78. Chronic conditions were classified as either no conditions or ≥1 condition, on the basis of the mean number of chronic conditions in our study (~1; Supplementary Table 1) and in line with previous literature4. We conducted subgroup meta-analyses to test subpopulation differences in the association between Internet use and mental health by pooling estimates of each subpopulation from all countries. Additionally, we used linear mixed models to assess the association between Internet use and mental health in three genetic risk categories (low, intermediate and high) measured by polygenic scores for depressive symptoms and subjective well-being. Since genetic data were available only in the USA and England, we examined whether the interaction term between Internet use and genetic risk group improved model fit using the multivariate Wald test79,80 in each of the two countries.
To further consider the influence of time-varying confounders, we used the parametric g-formula to examine the effect of sustained Internet use on mental health outcomes at the end of the follow-up period (gfoRmula package). The parametric g-formula is a statistical method to estimate the causal effect of sustained treatment strategies and appropriately adjust for measured time-varying confounders81. Detailed algorithms are provided in Supplementary Methods.
To test the robustness of our findings, we conducted five sensitivity analyses. First, we repeated the main analyses using complete cases. Second, since the subgroup meta-analyses showed significant differences in AMEs between studies with different measures of Internet use (P < 0.001 for depressive symptoms and P = 0.029 for life satisfaction; Supplementary Table 9), we repeated the analyses after excluding participants from England (with the frequency-based measure) and Mexico (with the household-level measure). Third, to account for selection bias due to attrition, we created the inverse probability weights of attrition and fitted linear mixed models with these weights. Additionally, we compared the baseline characteristics between the analytic samples for this study and the entire populations from the original dataset in the six cohorts. Fourth, to mitigate the impact of pre-existing depressive symptoms, we reran the analyses including only participants without depression at baseline. We also performed Cox proportional hazards models to examine the association between Internet use and the risk of incident depression. Finally, we fitted generalized estimating equation models with each of the three health indicators as the independent variable and Internet use as the dependent variable to test the potential bidirectional association. Details of the sensitivity analyses are described in Supplementary Methods.
Ethics and inclusion statement
This study analysed six ageing cohorts across the USA, England, Europe, China, Mexico and Brazil. This study demonstrates its local relevance to all countries included in the analyses by showing country-specific findings and aggregating them to provide more conclusive evidence on the protective association between Internet use and mental health among older adults. The results of this study can inform local policymakers with data that support the recommendations of Internet use for later-life mental health promotion. We prevent any stigmatization, incrimination, discrimination or otherwise personal risk to participants by removing all identifying information on the participants. This study did not pose any health, safety, security or other risk to researchers. No biological materials, cultural artefacts or associated traditional knowledge were transferred out of any country. The authors have considered local and regional research relevant to this study.
Reporting summary
Further information on research design is available in the Nature Portfolio Reporting Summary linked to this article.