
Ethics statement
The use of human sera for this study was approved by the Scientific and Ethics Review Unit of the Kenya Medical Research Institute (protocol SSC 3426). Before the blood draw, donors gave individual consent for the use of their samples for research.
Construction of gene libraries
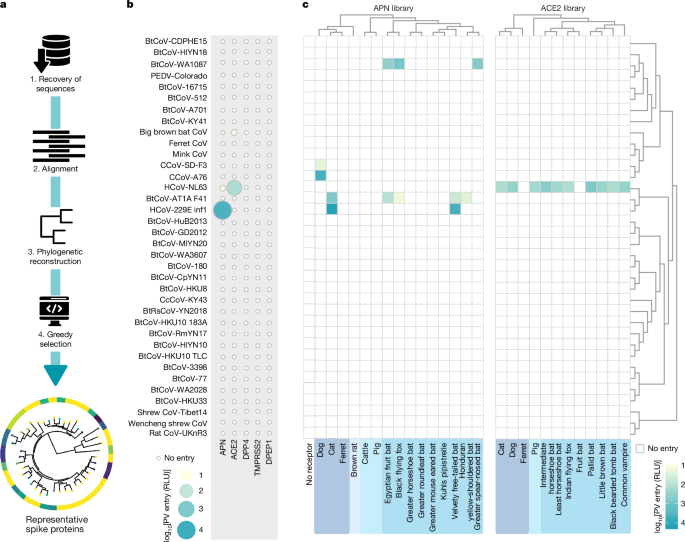
A schematic of the downstream analysis pipeline used for retrieving alphacoronavirus data and for generating the final spike protein library used in this study (n = 40) is provided in Fig. 1a. All publicly available alphacoronavirus genome sequences were retrieved from the Virus Pathogen Database and Analysis Resource platform hosted by the Bioinformatics Resource Center at the National Institute of Allergy and Infectious Diseases15. As of May 2021, the full database consists of 19,082 alphacoronavirus genomes, from which we extracted sequences of the whole spike protein-coding region to obtain a final database of 2,714 sequences. We constructed the spike protein-coding DNA sequence alignment using MAFFT (v.7.526)49,50 by integrating structural alignments of homologous spike protein structures queried from the UniProt Reference Clusters51. Maximum-likelihood phylogenetic reconstruction was performed using IQTREE (v.2.3.4)52 with 1,000 ultrafast bootstrap replicates (UFBoot) and 1,000 SH-like approximate likelihood ratio tests53 (Supplementary Fig. 20). We performed codon model reconstruction by determining the best-fit model using the model selection procedure implemented in IQTREE. Patristic distances (the sum of branch lengths along the shortest path) were then computed between all pairs of tips in R (v.4.4.1) using the ape package54, which informed the unbiased selection of the n = 40 spike protein-coding sequences by applying a greedy algorithm. In brief, let δ(i,j) denote the patristic distance between tips i and j on the reconstructed maximum-likelihood tree, with the branch length estimated in substitutions or sites, and let k be a previous number of tips to be selected. The greedy algorithm identifies the farthest pair arg maxi,j δ(i,j) and initializes the final selection set S with these two tips. Next, for each subsequent selection step, it adds the tip x∉S that maximize its nearest-neighbour distance to the current set x = arg maxx∉S miny∈S δ(i,j) and repeats the process until |S| = k. Although heuristic, this approach ensures that an optimal subset of tips (evolutionary units) is returned under the assumption of maximizing both minimum phylogenetic distance and phylogenetic diversity, as previously theoretically proposed and discussed14. We report Faith’s phylogenetic diversity55 of the induced minimal subtree and benchmarked against a 10,000 random panels of matching size. For the most divergent alphacoronaviruses, a RBD could not be readily identified for two unclassified viruses and viruses classified in the Soracivirus and Luchacovirus subgenera.
Plasmids used for pseudotyping
Selected alphacoronavirus spike protein-coding sequences were ordered from Biobasic as codon-optimized synthetic genes and subcloned in pcDNA3.1 with a HA tag in the C-terminal cytoplasmic tail. For the APN library, genes were ordered from GenScript and subcloned with a N-terminal V5 tag in the vector pCAGGS. For the ACE2 library and human DPP4 (GenBank: NP_001926), the ectodomains of the ORFs were subcloned with a N-terminal HA tag in pDisplay. CEACAM libraries were obtained from GenScript and subcloned in pcDNA3.1(+) with a C-terminal 8×His tag. Flag-tagged human TMPRSS2 (GenBank: NP_001128571.1) and human DPEP1 (GenBank: NP_001121613.1) were cloned into pcDNA3.1. GenBank accession numbers of the sequences used for the study are provided in Supplementary Table 1 for the alphacoronavirus spike protein library, Supplementary Table 2 for APN, Supplementary Table 3 for ACE2, Supplementary Table 7 for human CEACAM receptors, Supplementary Table 9 for the CcCoV local phylogeny spike protein library and Supplementary Table 10 for CEACAM6-like proteins of different mammalian species.
Cells
Mycoplasma-free HEK293T (human kidney), Calu3 (human lung), Caco2 (human colorectal adenocarcinoma) and HuH7 (human hepatoma) were cultured in Dulbecco’s modified Eagle medium (DMEM) supplemented with 10% FBS, 100 U ml–1 penicillin plus 100 µg ml–1 streptomycin (PenStrep) and 1 mM sodium pyruvate. Mycoplasma-free THP1 (human monocytes) and LCL (human B lymphocytes) cell lines were maintained in suspension in RPMI1640 medium supplemented with 10% FBS and PenStrep. All reagents for cell culture were purchased from Gibco. All cells were cultured in a humidified atmosphere at 37 °C, 5% CO2.
Pseudotype virus production
To pseudotype alphacoronavirus spike proteins, plasmids encoding their ORF were transfected in confluent HEK293T cells seeded in a 6-well plate using polyethylenimine (PEI, 5 µg ml–1). HIV-1-based lentiviral vectors coding for viral structural proteins (p8.91), particle packaging signals and a luciferase reporter gene (pCSFLW) were also included in the transfection mix56. The following day, the medium was replaced and pseudoviruses in the supernatant were collected 48 and 72 h after transfection and pooled together. Following the final collection, the supernatant was centrifuged for 10 min at 4,000 rpm to remove cellular debris. Finally, pseudoviruses were aliquoted and stored at −80 °C until further use. To verify spike protein incorporation, pseudoparticles were purified by ultracentrifugation at 23,000 rpm, 4 °C for 2 h using a 20% sucrose gradient. Supernatants were discarded and pellets were resuspended in PBS. Concentrated pseudoparticles were lysed by boiling with Laemmli (Bio-Rad) and spike protein expression was analysed by SDS–PAGE. Separated proteins were transferred onto a 0.45 µm nitrocellulose membrane (Cytiva), blocked in PBS supplemented with 0.05% Tween-20 and 5% (w/v) unskimmed milk powder and incubated with mouse monoclonal anti-HA (clone 6E2, Cell Signaling Technology, 1:5,000) and anti-p24 (clone 5, Abcam, 1:2,000) overnight at 4 °C. The following day, goat anti-mouse DyLight 680 (Invitrogen, 1:10,000) was used to probe primary antibodies, and signals were detected with an Odyssey DLx imaging system (Li-Cor Biosciences). Of note, for those spike proteins for which we saw entry (Fig. 1; HCoV-NL63, CcCoV-SD F3, CcCoV-A76, HCoV-229E, BtCoV-AT1A F41 and BtCoV-WA1087), protein expression in the purified pseudoparticle immunoblots (Extended Data Fig. 1) did not quantitatively correlate with entry signals, which indicated that it is difficult to establish a minimum threshold of spike protein incorporation needed for membrane fusion. For the six spike proteins that did not pseudotype (Supplementary Fig. 1), we attempted to substitute them for spike proteins that have been reported to pseudotype and that share at least 95% amino acid similarity (Supplementary Fig. 21). However, the only match was for PEDV-KDJ, which was replaced by PEDV-Colorado57. The selected HCoV-229E spike protein sequence pseudotyped to low levels and was not functional in our downstream applications (Supplementary Fig. 3a); therefore, we replaced it with a different strain of the same species. Original uncropped immunoblots are provided in the Zenodo repository (https://doi.org/10.5281/zenodo.17951484)58.
Pseudovirus entry assay
For receptor usage screening, HEK293T cells were transfected with plasmids coding for the receptors of interest. The following day, the medium was removed and replaced with fresh DMEM supplemented with 10% FBS to a final concentration of 2 × 10⁴ cells per ml. Next, 100 µl of cell preparation was aliquoted in each well of a 96-well plate and treated with 100 µl pseudovirus preparation, diluted 1:1 with fresh medium. Two days later, the supernatant was removed and cells were treated with Bright-Glo (Promega), diluted 1:1 with PBS. Luciferase signals were acquired using a Glomax Discover luminometer (Promega). To assess cell line permissivity to pseudovirus infection, confluent human cell lines were transduced with undiluted pseudoparticle supernatant in a 96-well plate. Two days later, plates were spun down, the medium replaced with 50 µl Bright-Glo and luciferase signals were acquired on a luminometer. To inhibit human CEACAM6-dependent entry, pseudotyped CcCoV-KY43 spike protein was incubated with commercial monoclonal antibodies against human CEACAM6, clone B6.2 (ThermoFisher) and clone 439424 (ThermoFisher), or recombinant C-terminally Fc-tagged human CEACAM6, for 1 h at room temperature in a 96-well plate. HEK293T cells transiently transfected with pcDNA-human CEACAM6 was then added to the plate at a concentration of 2 × 10⁴ cells per well. Two days later, luciferase signals were measured as described above.
Flow cytometry for expression of the receptor libraries
Plasmids were transfected in HEK293T cells using Trans-IT X2 (Mirus Bio). The following day, cells were resuspended in PBS, fixed using 2% paraformaldehyde for 20 min at 4 °C and permeabilized using PBS supplemented with 0.5% Triton X-100 for 5 min at 4 °C. After washing, cells were incubated for 1 h with anti-tag antibodies conjugated with PE for APN (V5 tag, Invitrogen, clone TCM5, 1:500) and APC for ACE2 (Flag-tag, Miltenyi Biotec, clone REA216, 1:500) and CEACAM (His-tag, Miltenyi Biotec, clone GG11-8F3.5.1, 1:500) libraries. Samples were run on a MACSQuant Analyzer 10 cytometer (Miltenyi Biotec), and data analysis was performed using FlowJo (BD Biosciences). To assess the specificity of anti-human CEACAM6 monoclonal antibodies, HEK293T cells were transfected with a library of different human CEACAM proteins. The following day, cells were washed in PBS and fixed using 2% paraformaldehyde for 20 min at 4 °C. After washing, cells were incubated with clone B6.2 (1:500) or clone 439424 (1:500) for 1 h on ice. Cells were washed three times before incubation with the secondary antibody conjugated with FITC and recognizing mouse IgG(H+L) (Invitrogen, 1:5,000). Samples were run on a MACSQuant Analyzer 10 cytometer and data were analysed using FlowJo.
Human virus receptor discovery
Human receptor ectodomains were expressed as enzymatically monobiotinylated soluble proteins as previously described20 by co-transfecting HEK293 cells with a secreted BirA protein biotin59, as previously described60. Protein-containing supernatants were collected after 5 days of expression at 37 °C with 5% CO2 and 70% humidity. Cells were removed by centrifugation 2,000g for 20 mins, before filtering away particulates (Acrodisc PF PES 0.8/0.2 micron filters, 4658). The imidazole concentration was adjusted to 20 mM and applied to a 96-well HisTrapHP plate as previously described61. Non-captured proteins were removed using 3 washes with buffer (20 mM sodium phosphate buffer, 400 mM NaCl and 40 mM imidazole, pH 7.4). Captured proteins were eluted after 15 min of incubation with elution buffer (20 mM sodium phosphate, 400 mM NaCl and 400 mM imidazole, pH adjusted to 7.4). Protein concentrations were determined using a Pierce Bradford protein assay kit, comparing the absorbance values for the purified proteins against values obtained for a dilution series of bovine serum albumin (BSA). Protein purity was assessed by separating protein preparations under reducing conditions (NuPAGE sample reducing agent and LDS sample loading buffer) by SDS–PAGE in MOPS–SDS buffer (NuPAGE) and visualized using Coomassie dye (InstantBlue). Human receptor screening assays were carried out as previously described20. In brief, horseradish-peroxidase-labelled preys were produced by complexing monobiotinylated proteins (1.785 ml at 17.5 nM) with streptavidin HRP (714 µl of a 1 in 1,000 dilution, Pierce: 21130) for 1 h at 23 °C, diluted in HEPES buffered saline (HBS) containing 2% (w/v) BSA. Preys were further diluted 20-fold in the same buffer and applied to 2 × 384-well plates containing 759 immobilized human receptor ectodomains and incubated for 1 h at 23 °C. Plates were washed twice with HBS containing Tween-20 (0.1% w/v), followed by a final wash in HBS. Protein interactions were visualized using TMB/E solution (Merck ES001), stopping the reaction by the addition of NaF to a final concentration 0.15% (w/v). Absorbance readings at 652 nm were processed using a median polished Z score with the significance threshold set to Z > 2.
Site-directed mutagenesis
Substitutions in human CEACAM5 and CEACAM6 were introduced using a Quikchange Lightning Site-Directed Mutagenesis kit (Agilent) following the manufacturer’s instructions. Primers were designed using the Agilent online tool (https://www.agilent.com/store/primerDesignProgram.jsp).
Cell–cell fusion assay
HEK293T cells were transfected with either the human CEACAM receptor constructs and rLuc-GFP 1-7 plasmid62 or with plasmids encoding CcCoV-KY43 spike protein and rLuc-GFP 8-11 using Transit-X2 transfection reagent (Mirus) according to the manufacturer’s instructions. The following day, cells were resuspended in fresh medium and co-cultured at a ratio of 1:1 to a final density of 4 × 10⁴ cells per well in a 96-well plate. Two days later, medium was removed and cells were lysed in Passive Lysis buffer (Promega). Renilla luciferase substrate coelenterazine-H (Promega) was added and signals were read using a Glomax Discover Reader (Promega).
Knockdown of CEACAM6 in human cells
siRNA targeting human CEACAM6 (Dharmacon) was introduced in Calu3 and Caco2 cells by electroporation (Neon NxT, ThermoFisher). In brief, cells were washed, resuspended in electroporation buffer at a final concentration of 1 × 10⁸ cells per ml and mixed with siRNA at 100 mM. Electroporation was carried out for 2 pulses of 20 ms at 1,400 V. Afterwards, cells were grown for 24 h in DMEM supplemented with 20% FBS before transduction with pseudotyped CcCoV-KY43 spike protein. Entry signals using firefly luciferase were detected as described above. To evaluate reduction in protein expression, cellular lysates were obtained at the same time. Western blot membranes were incubated with mouse anti-human CEACAM6 (Fisher Scientific, clone B6.2, 1:1,000) and rabbit anti-human GAPDH (Proteintech, 1:10,000) as a loading control. The following day, goat anti-mouse DyLight 680 (Invitrogen, 1:10,000) was used to probe primary antibodies, and signals were detected using an Odyssey DLx imaging system (Li-Cor Biosciences). In parallel, stable Caco2 and Calu3 cell lines for which expression of human CEACAM6 was knocked down using shRNA were obtained. Hairpin sequences of 21-mers targeting the gene were obtained from the web portal of the Genetic Perturbation Consortium (Broad Institute, https://portals.broadinstitute.org/gpp/public/seq/search). The sequences TRCN0000424513 and TRCN000062298 were purchased as oligomers from IDT and cloned into the pKLO.1C vector (Addgene, 139470; PMID 16564017). The final constructs were transfected into HEK293T cells, along with the lentiviral packaging vector p8.91 and a plasmid encoding for VSV glycoprotein G. Pseudoviruses were collected as described above. Caco2 and Calu3 cells were plated in a 6-well plate and transduced when 80% confluency was reached. Pseudoviruses were added for 3 days, then removed and replaced with DMEM 20% FBS containing 8 µg ml–1 puromycin. Functional entry assays were performed as described above, and reduced expression of CEACAM6 was again confirmed by immunoblotting. Original uncropped immunoblots are provided in the Zenodo repository (https://doi.org/10.5281/zenodo.17951484)58.
Transcriptomic analysis of available datasets
Publicly available single-cell RNA-sequencing data from the Human Protein Atlas were downloaded (https://www.proteinatlas.org/humanproteome/single+cell/single+cell+type/data#datasets). The dataset included gene read counts per cell for 31 human organs. Count matrices per organ were imported into R (v.4.3.3) and processed using Seurat (v.5.3.0) in RStudio (v.2025.05.1). To further zoom in on lung-specific single-cell transcriptomic data, we downloaded the Human Lung Cell Atlas (HLCA v.1.0) dataset for normal human lungs samples (https://data.humancellatlas.org/hca-bio-networks/lung/atlases/lung-v1-0). Processed cell-type annotations and expression matrices were loaded into Seurat (v.4.3.3.) for downstream analyses.
Recombinant protein production
Receptors (human CEACAM6, residues 1–326; human CEACAM5, residues 1–684; human CEACAM3, residues 1–215; human CEACAM1, residues 1–428; human CEACAM8, residues 1–327; and Egyptian fruit bat CEACAM6, residues 1–388) were cloned into pOPINTT vectors, upstream of the human rhinovirus 3C protease site and human IgG-Fc tag. Full-length spike proteins (SARS-CoV-2, HCoV-NL63 and HCoV-229E) were cloned into pCDNA3.1 vectors. RBDs (CcCoV-KY43, residues 500–630; CcCoV-2B, residues 496–625; BtCoV-HlYN18, residues 490–627; BtCoV-A701, residues 488–622; BtMfCoV-HuB2013, residues 497–641; BtCoV-WA3607, residues 497–652; BtCoV-CpYN11, residues 491–641; BtCoV-180, residues 477–633; BtCoV-HKU8, residues 497–644; BtCoV-RmYN17, residues 506–632; BtCoV-77, residues 495–634, BtCoV-WA2028, residues 497–648; BtCoV-977, residues 508-638; mink coronavirus, residues 518–660; and CCoV-SD-F3, residues 525–679) were cloned into pOPINTT vectors, which encode a 6×His tag at the C terminus of the protein. Mycoplasma-free Expi293 cells were cultured in Expi293 Expression medium (Gibco) at 37 °C, 8% CO2. Expression plasmids were transfected using Polyethylenimine Max (PEI 40K, Polyscience) at a mass ratio of 1:1.5 according to the manufacturer’s instructions. After 18 h, valproic acid (Merck), sodium propionate (Merck) and glucose (Merck) were added to the cellular suspension at a final concentration of 5 mM, 6.7 mM and 46 mM, respectively. After 3 days, supernatant was collected by centrifugation (3,800g for 10 min) and sterile filtered before storage at 4 °C. Fc-tagged proteins were purified using HiTrap protein G HP (Cytiva) prepacked affinity columns, washing with 10 mM sodium phosphate pH 7 buffer, eluting with 0.1 M glycine pH 2.7 that was immediately neutralized with 1 M Tris pH 8.0. His-tagged proteins were purified using HisTrap FF (Cytiva) prepacked affinity columns, washing with 10 mM sodium phosphate pH 7.5, 150 mM NaCl, 20 mM imidazole and eluting with 10 mM sodium phosphate pH 7.5, 150 mM NaCl and 1 M imidazole. For all samples, eluted fractions were analysed by SDS–PAGE, and fractions containing the relevant protein were pooled. Pooled protein was exchanged into 10 mM Tris pH 7.5, 150 mM NaCl via repeated concentration and dilution using Amicon Ultra Centrifugal filters (Merck). For crystallization, the CEACAM6 Fc tag was removed by overnight incubation at 4 °C with human rhinovirus 3C protease, and both the Fc tag plus uncleaved CEACAM6-Fc were depleted using a HiTrap protein G HP affinity column. For crystallography and biophysics (ITC and biolayer interferometry assays), proteins were further purified by size-exclusion chromatography using a Superdex 200 10/300 GL column (Cytiva) equilibrated in 10 mM Tris pH 7.5, 150 mM NaCl. Proteins were stored at 4 °C (<2 weeks) or snap-frozen and stored at –80 °C (long term).
Protein binding determined by ELISA
Recombinant RBDs were coated onto Maxisorp NUNC-immuno flat-bottomed 96-well plates (Thermo Scientific) at 1 μg ml–1 overnight at 4 °C in carbonate–bicarbonate solution (0.6 M, pH 9.6). Plates were blocked for 1 h at room temperature with PBS Tween-20 containing 2% BSA (Merck), after which a dilution series of CEACAM proteins in PBS BSA 2% was added for 1 h at room temperature. Plates were washed 3 times with PBS Tween-20 0.1% (Sigma), followed by the addition of anti-human-Fc HRP conjugate diluted 1:10,000 for 1 h at room temperature. 1-step Ultra TMB (Merck) was added to each well, incubated for 5–10 min at room temperature and the reactions stopped with an equivalent volume of 2 M sulfuric acid solution. The OD at 450 nm was measured using a Glomax Discover luminometer (Promega).
The binding IgG ELISAs with human sera were performed according to previously published protocols63. In brief, Maxisorp NUNC-immuno flat-bottomed 96-well plates were coated with 2 µg ml–1 coronavirus spike antigens and CcCoV-KY43, BtCoV-HlYN18 and BtCoV-A701 RBDs at 37 °C for 1 h, then washed 3 times in 0.1% Tween-20 and blocked with blocker casein (Thermo Fisher) for 1 h. As full-length spike protein ectodomains could not be produced in sufficient quantities for CcCoV-KY43, ELISAs used stabilized full-length spike proteins for HCoV-229E, HCoV-NL63 and SARS-CoV-2 and RBDs for CcCoV-KY43, BtCoV-HlYN18 and BtCoV-A701; this modification represents a limitation of the study and precludes direct quantitative comparison of ELISA signal magnitudes across antigens. Samples were diluted 1:800 in blocker casein and added to both receptor binding domain and spike protein-coated plates, and incubated for 2 h at room temperature. After washing with 0.1% Tween-20, a 1:10,000 dilution of horseradish peroxidase-conjugated goat antihuman IgA antibody (Sigma) in wash buffer was added to plates, incubated for 1 h at room temperature, washed and O-phenylenediamine dihydrochloride substrate (Sigma) was added for colour development for 10 min. Absorbance was measured at 492 nm. Spearman’s rank correlations were applied to assess associations across the full dataset, whereas Pearson’s correlations were applied to the top 10% of CcCoV-KY43 ELISA signals to explore co-variation among high responders. As true negative control sera are unavailable in this emergent-virus setting, OD thresholds were used solely as descriptive markers of high reactivity (in each antigen-specific ELISA) and not to infer seropositivity or to compare absolute signal magnitudes across assays.
Flow cytometry for receptor–viral protein binding
HEK293T cells were transiently transfected with plasmids encoding APN and ACE2 from different species, as well as human TMPRSS2, human DPP4 and human DPEP1. The following day, cells were washed in PBS and fixed using 2% formaldehyde in PBS for 20 min on ice. After incubation, cells were permeabilized with Triton 1% in PBS, for 5 min on ice. Cells were washed twice in PBS and incubated with 10 mg ml–1 viral-predicted RBD diluted in PBS BSA 1%, for 1 h on ice. After washing, the secondary antibodies were incubated with the cells for 1 h on ice. To label the receptors, PE-conjugated anti-V5 (Invitrogen, clone TCM5, 1:500) was used for the APN library, PE-conjugated anti-HA (Miltenyi Biotec, clone GG8-1F3.3.1, 1:500) was used for the ACE2 library and human DPP4 and PE conjugated anti-Flag (BioLegend, clone L5, 1:500) was used for human TMPRSS2 and human DPEP1. To recognize the His-tagged viral predicted RBDs, APC-conjugated anti-6×His was used (Miltenyi Biotec, 1:500). Cells were run on a MACSQuant flow cytometer (Miltenyi Biotec), and at least 25,000 events were acquired per sample. Data were analysed using FlowJo (BD Biosciences). The gating strategy is shown in Supplementary Fig. 22.
Crystallization
Complexes of CEACAM6 with RBDs from CcCoV-KY43 and CcCoV-2B were formed by mixing the proteins at a 1:1.2 molar ratio and incubating for 60 min at 22 °C. Proteins were crystallized in 96-well nanolitre-scale sitting drops (200 nl protein plus 200 nl of reservoir) equilibrated at 293 K against 80 μl reservoir solution as follows: 2 mg ml−1 CcCoV-KY43 complex, 0.1 M sodium acetate pH 4.3, 21.5% PEG5K MME and 5% glycerol; 2.7 mg ml−1 CcCoV-2B complex, 0.1 M sodium acetate, 20% PEG 6K and 0.2 M NaCl. Crystals were cryo-preserved by brief immersion in reservoir supplemented with 20–25% glycerol before collecting in SPINE standard nylon loops and flash-cryocooling in liquid nitrogen.
X-ray data collection and structure determination
Diffraction data were recorded from single crystals on the Diamond beamline I24 at 20 keV using an Eiger2 9M detector (CcCoV-KY43 complex) or on the beamline I04 at 13 keV using an Eiger2 X 16M detector (CcCoV-2B complex). Both crystals produced severely anisotropic diffraction; therefore, data were integrated using DIALS64 before anisotropic scaling and merging using the STARANISO ‘aniso merge’ data processing pipeline65. The structure of human CEACAM6 in complex with CcCoV-KY43 was solved by molecular replacement using PHASER66 with AlphaFold 3 (ref. 67) models of the ectodomain (residues 35–326) of CEACAM6 and the RBD (residues 500–630) of CcCoV-KY43, for which the atomic pLDDT values had been converted into pseudo-atomic displacement factors68. The model was manually improved using ISOLDE69 with adaptive restraints based on the AlphaFold quality metrics68 before refinement using phenix.refine70, with the coordinates from ISOLDE used as a reference model to prevent deterioration of model geometry. Subsequent rounds of iterative model building were performed using COOT71 and ISOLDE in consultation with the validation statistics provided by MolProbity72, in each case using the coordinates from ISOLDE as a reference model in phenix.refine. The final model had one molecule of CEACAM6 and CcCoV-KY43 RBD per asymmetric unit, with 95.6% of residues in the favoured area of the Ramachandran plot and no outliers, and it included 10 N-acetylglucosamine residues (9 attached to CEACAM6 and 1 to CcCoV-KY43 RBD). The structure of human CEACAM6 in complex with CcCoV-2B was solved by molecular replacement using PHASER66 with models of the CEACAM6 ectodomain and CcCoV-2B RBD (residues 496–625) that were generated with ColabFold73 using the crystal structure of CEACAM6 in complex with the CcCoV-KY43 RBD as a template. The structure was refined as described above. The final model had one molecule of CEACAM6 and CcCoV-2B RBD per asymmetric unit, with 96.2% of residues in the favoured area of the Ramachandran plot and no outliers, and it included 12 N-acetylglucosamine residues (9 attached to CEACAM6 and 3 to CcCoV-2B RBD).
Biolayer interferometry
To compare affinities of human CEACAM proteins for CcCoV-KY43 and CcCoV-2B, the recombinant viral RBDs were immobilized at 20 μg ml–1 to Ni-NTA biosensors (Sartorius) pre-hydrated in 10 mM HEPES pH 7.5, 150 mM NaCl and 0.02% Tween-20. Biosensors were incubated with a a 2-fold serial dilution of CEACAM proteins from 600 nM to 37.5 nM (association) then buffer alone (dissociation). Between incubations, biosensors were regenerated by thrice incubating for 5 s with 10 mM glycine pH 1.7 then 5 s in buffer to neutralize, and biosensors were recharged using 10 mM NiCl2 before fresh immobilization of the RBD. Two independent experiments were performed at 30 °C using a Octect Red (ForteBio). Results were analysed using data analysis software of the instrument (Sartorius).
ITC
ITC experiments were performed using a MicroCal PEAQ-ITC automated calorimeter (Malvern Panalytical) at 25 °C. CcCoV RBDs were titrated into human CEACAM proteins using 13 × 3 µl or 19 × 2 µl injections. Results were analysed using the analysis software of the instrument and fitted using a one-site binding model. The experiments were performed twice (CEACAM5) or thrice (CEACAM6) independently, and data from each experiment are shown in Supplementary Table 4.
C. cor and human population distribution data in Kenya
GPS points from all the study areas in Kenya where bats were surveyed were uploaded onto QGIS (2025, https://www.qgis.org). The points were later grouped based on bats species as either ‘other species of bats’ or ‘heart-nosed bat’. A shape file of the known extent of C. cor was added to ascertain the accuracy of the sampling. Sampling points containing C. cor were later classified based on the cave type as either natural cave, tree cave or mine cave. In two instances, bats were found in human habitations.
Phylogenetic reconstruction
Alphacoronavirus spike gene sequences of the 40 selected strains, in addition to those representing the local phylogeny of CcCoV-KY43, were aligned using MAFFT (v.7.526)49 and molecular clock calibration was performed in BEAST (v.1.10.5)74. Bayesian analysis was parameterized using the SRD06 codon position model (which implements a HKY112 partition)75,76, a relaxed clock defined by an underlying log-normal distribution to model variability in rates across branches77, and a nonparametric skygrid prior with 50 grid points distributed over 65 years78. An uninformative continuous-time Markov chain rate was set as reference prior on the clock rate, whereas other priors were left at their default values. Moreover, to investigate the potential acquisition (or loss) of CEACAM6 usage along the full evolutionary history of alphacoronavirus, discrete CEACAM6 usage was modelled as a binary trait under an asymmetric continuous-time Markov chain process with Markov jump counting in BEAST79. CEACAM6 trait evolution was jointly inferred in BEAST (v.1.10.5) with time-calibrated phylogenies estimated under a SRD06 codon-partitioned substitution model, an uncorrelated log-normal relaxed molecular clock and a skygrid coalescent prior. Markov jumps were used to obtain posterior distributions for the number and direction of CEACAM6 transitions (gains and losses) and to reconstruct the most probable trait state at internal nodes. All Markov chain Monte Carlo analyses were run for 200 million iterations, with samples collected every 20,000 steps. Convergence and mixing of the chain were evaluated by ensuring that all posterior parameters returned effective sample size values greater than 200. Highest independent posterior subtree reconstructed80 trees were constructed in TreeAnnotator by discarding the initial 10% of the chain.
Additional computational analysis
Molecular graphics were generated using PyMOL (Schrödinger) and ChimeraX81. Structure interfaces were analysed using PDBePISA82. For analysis of relative changes in pseudotype entry, significance was quantified using the Python3 module statsmodels (https://www.statsmodels.org/) with technical replicates averaged and treatment effects quantified as log10-transformed fold changes relative to the control (untreated) sample. Significance was determined using a one-sample t-test against a theoretical mean of 0, with standard errors calculated using a pooled variance estimate across all groups to ensure robust variance estimation given the small sample sizes. P values were adjusted for multiple comparisons using the Holm–Bonferroni correction. GraphPad Prism 9 was used to generate all the other figures and to perform all other statistical analyses. Non-significant difference is shown when P > 0.032.
Biosecurity statement
Following the identification of CEACAM6 as a receptor in early 2024, we recognized the potential health implications of our findings and the need to notify and improve preparedness and biosecurity in Kenya. Contacting B. A. at the National Museum of Kenya, who first identified CcCoV-KY43 and is a co-author on this study, we let his team know of the potential risk, especially concerning sampling of this bat species. In consultation with biosecurity colleagues in the United Kingdom, we also made the decision to not attempt rescuing or propagating the virus in our laboratories. As such, all work detailed in this paper has been done without live virus work in UK laboratories.
Reporting summary
Further information on research design is available in the Nature Portfolio Reporting Summary linked to this article.