
A solar storm powerful enough to cause a nine-hour blackout across Quebec – exactly what happened in 1989 – could do far more damage if it struck the eastern United States today.
Scientists have spent the past 18 years mapping the hidden electrical structure beneath North America, and their findings are changing how researchers think about the threat solar storms pose to modern power grids.

The study was led by Anna Kelbert, an Earth Science Project Scientist at the Center for Astrophysics at Harvard & Smithsonian (CfA).
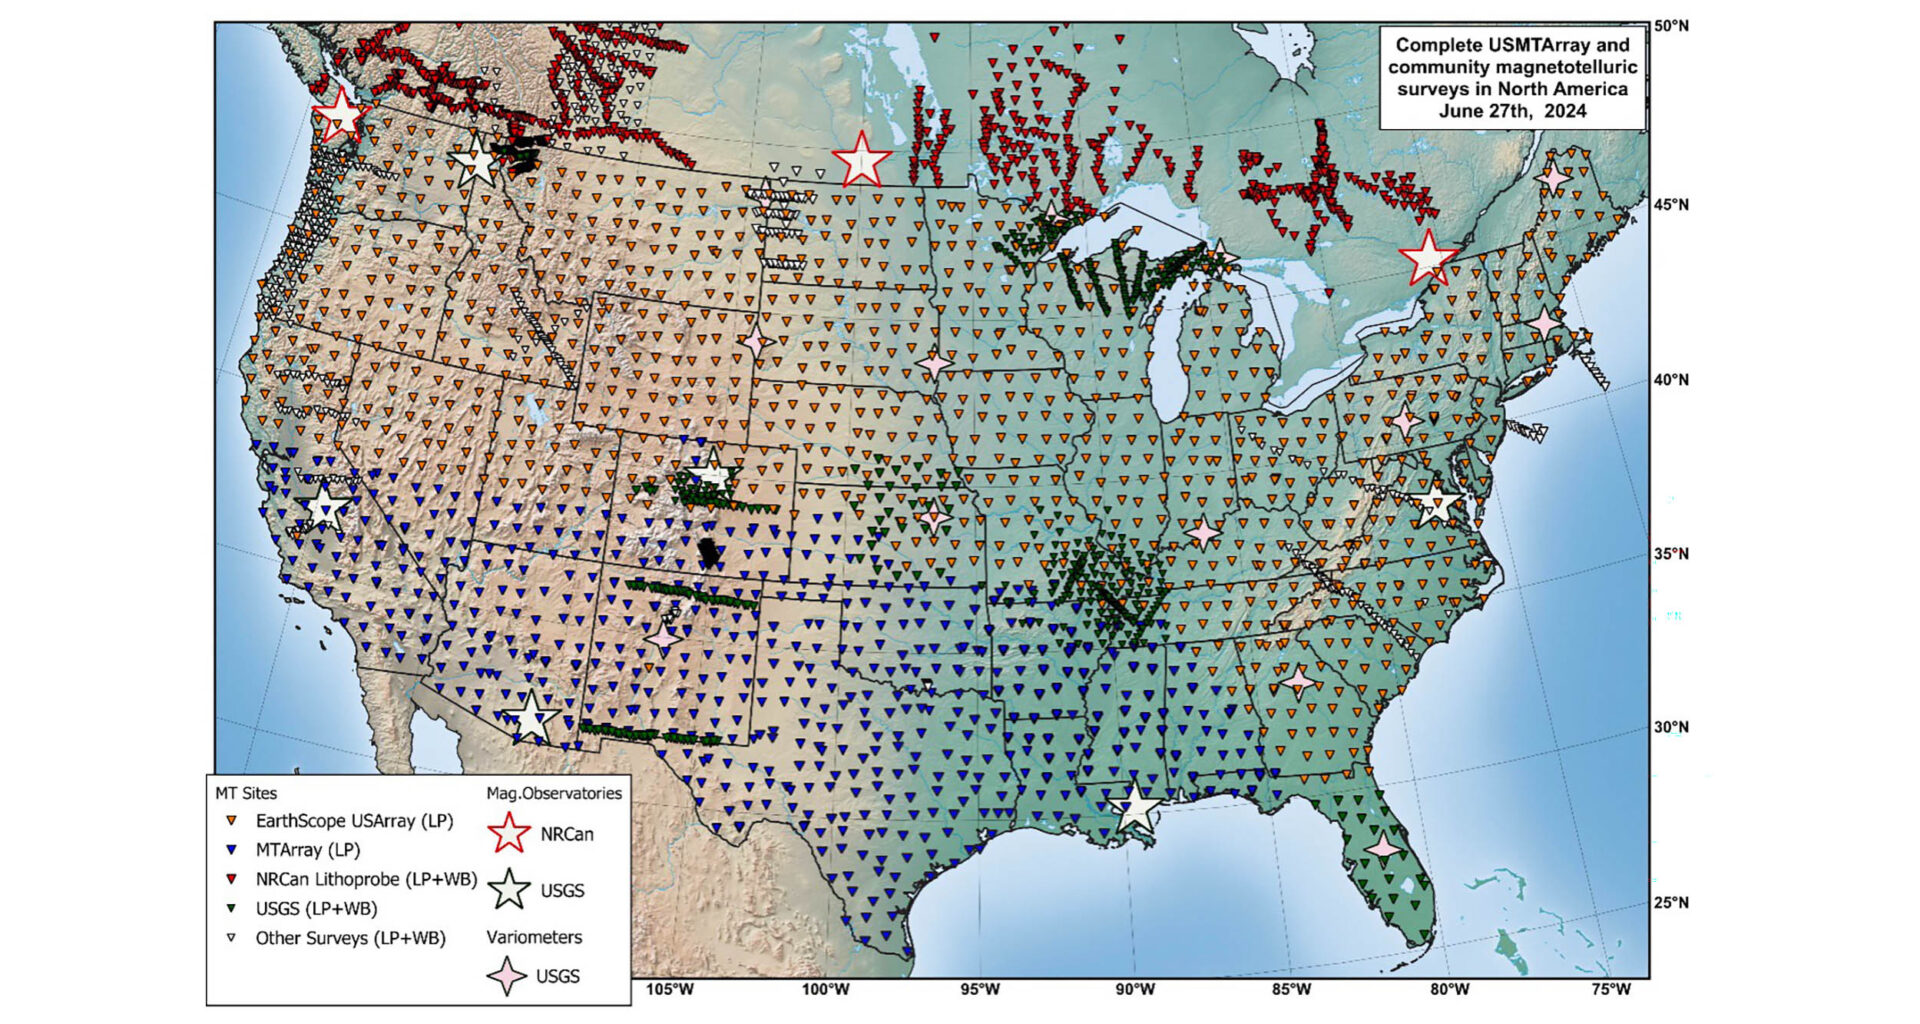
It draws on data from the United States Magnetotelluric Array (USMTArray), an 18-year effort that collected measurements at more than 1,800 locations across the country.
Researchers used those observations to create the first comprehensive map of the electrical properties beneath the continental United States.
Mapping the USMTArray
Most people think of the ground as inert – something solid and static that simply holds everything up. The reality is far more complex.
Underground rocks, fluids, and ancient geological formations all conduct electricity to different degrees.
The way electrical currents move through them depends on mineral composition, temperature, and water content.
The USMTArray captured natural variations in Earth’s electric and magnetic fields at more than 1,800 measurement sites across the country.
Researchers then used those readings to build a three-dimensional picture of electrical resistivity stretching from shallow sediment layers down to the deep ancient roots that have anchored North America for more than a billion years.
Hidden pathways and structures
Magnetotelluric data responds especially strongly to fluids and molten material beneath the surface, giving scientists a very different way to study Earth compared to seismic imaging, Kelbert explained.
The result is a map revealing hidden pathways and structures shaping the continent from below. These include ancient subduction zones marked by conductive graphite and sulfide minerals.
The map also reveals stable continental cores that have persisted for billions of years, along with geological features never before mapped at this level of detail.
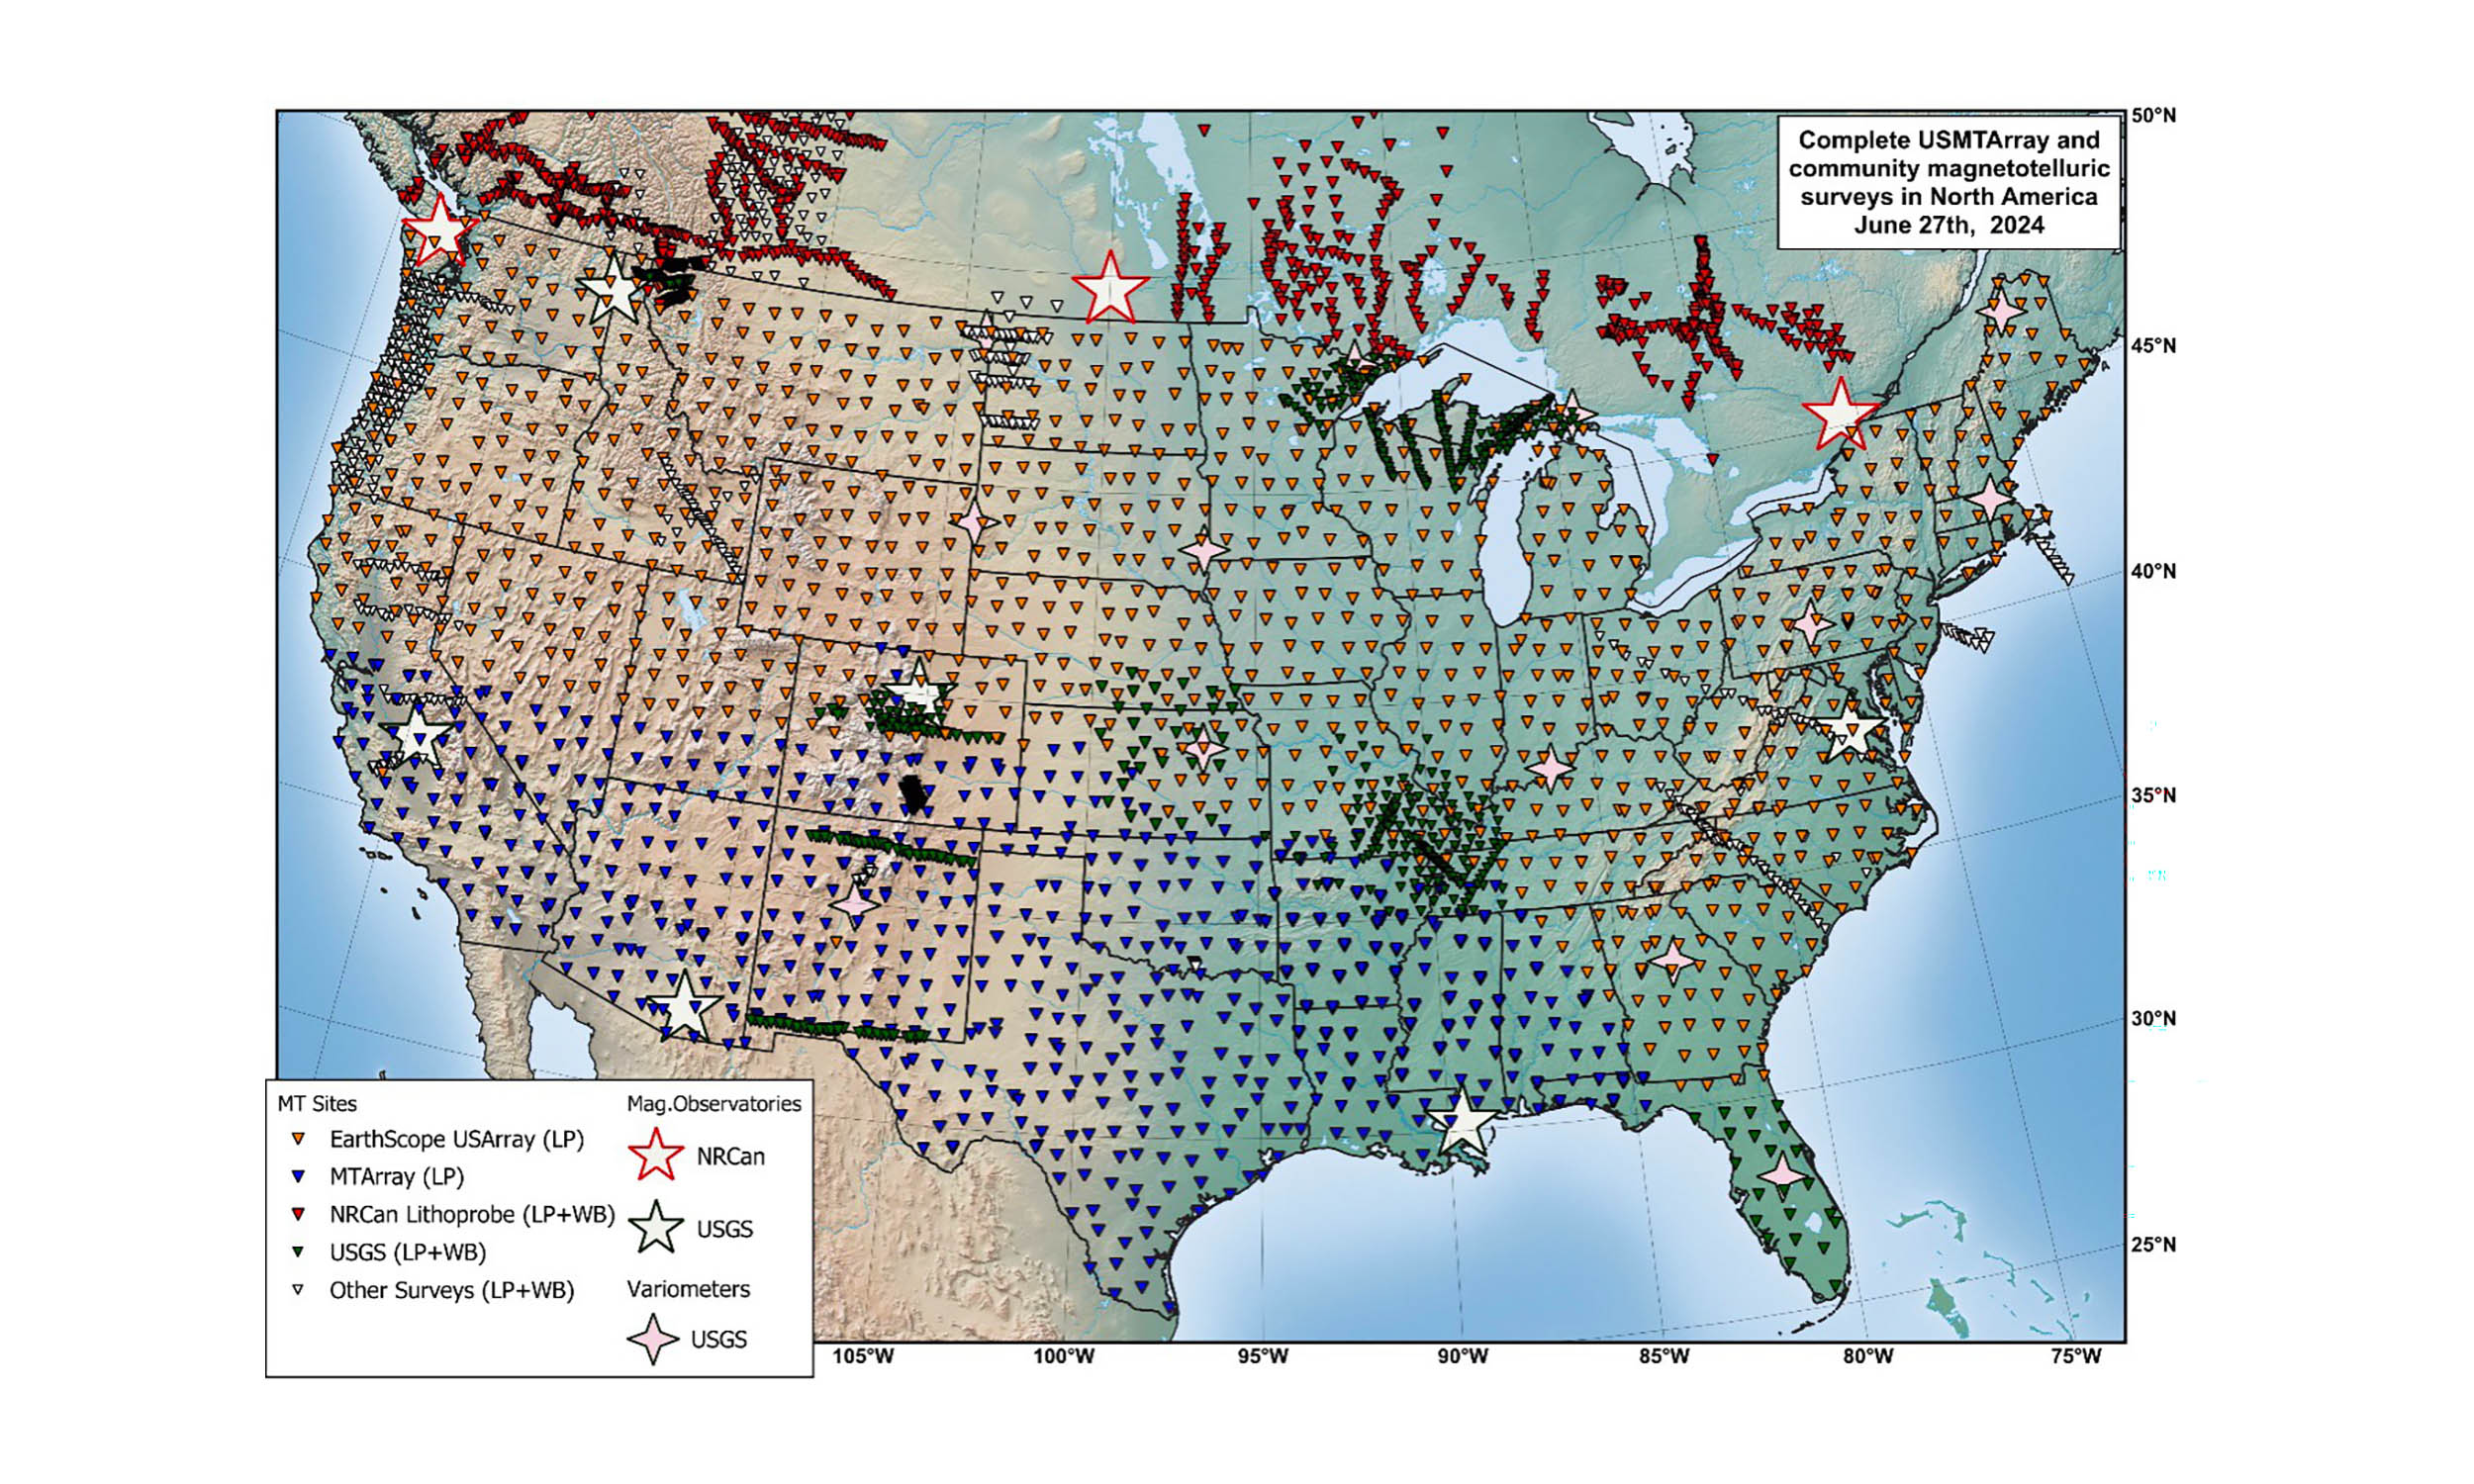 Over the course of nearly 20 years, scientists installed and collected data at more than 1,800 magnetotelluric data stations around the country in the USMTArray. Credit: Adam Schultz, Oregon State University. Click image to enlarge.Solar storms and power grids
When a geomagnetic storm hits, it does not just affect satellites and radio signals in the atmosphere.
Energy from the sun also drives electrical currents through the ground, and those currents can flow directly into power lines.
The 1989 Quebec blackout remains the clearest modern example of what that looks like in practice.
Storm-driven geoelectric fields overwhelmed the Hydro-Québec power grid and left millions of people without electricity for nine hours.
What fewer people realize is that during the same storm, geoelectric field amplitudes at a site in Maine reached 36.7 volts per mile (22.79 volts per kilometer) – a level far beyond what power systems are designed to handle.
Electric grid was not built for this
According to Kelbert, anything above about 1.6 volts per mile (one volt per kilometer) is considered a threat by the power grid industry.
“For anything like 20 V/km, if the geoelectric field of that amplitude was oriented along a typical 200-km (124-mile) power line in Maine, we’d be looking at voltages of 4,000 V,” she said.
Engineers built power grids to handle alternating current, not a sustained surge of direct current at that scale.
When that happens, expensive transformers – which can take months or even years to replace – can overheat and fail.
A blackout on the scale of the Quebec solar storm event, but spread across a larger and more interconnected grid, could leave major parts of the country without power for an extended period.
 Coronal mass ejections (CMEs) move from the surface of the Sun towards Earth through space. Top: CME is generated as an outflow of plasma and magnetic fields from the Sun, moving through space to Earth and into the USMTArray over a matter of hours. Bottom: The magnetic fields of the CME and outflowing solar wind interact with Earth’s magnetic field, which shields it from greater effect. This interaction causes the auroras at the poles. Credit: Hayley Bricker/EarthScope. Click image to enlarge.USMTArray boosts threat level
Before this project, scientists studying grid vulnerability had to rely on simplified, one-dimensional models of how electricity moves through the ground.
Those models treated the geology beneath the United States as if it were mostly uniform, even though underground conditions vary enormously from place to place.
The new data reveal something those simpler models missed entirely. Geoelectric hazards can change dramatically between locations just a few miles apart.
Two nearby towns can face very different levels of risk depending on the geology beneath them.
A rocky ancient formation conducts electricity very differently from a basin of sedimentary rock saturated with groundwater.
That variation matters enormously when scientists try to predict where storm-related damage could be most severe.
A clearer picture of grid danger
Today, data from the USMTArray feeds into a real-time risk map managed by NOAA and the US Geological Survey, which monitors electric fields across the country as storms develop.
For the first time, scientists and grid operators can pinpoint where the danger is concentrated with detailed, location-specific data.
That is a major improvement over relying on national averages that often hide local conditions and risks.
USMTArray map implications
The practical applications extend beyond solar storm preparedness.
Because the map tracks underground fluids and electrically conductive minerals, it could help scientists identify mineral deposits and geothermal energy sources.
Those underground heat resources are becoming increasingly valuable as the global energy transition accelerates.
But the map also tells a deep geological story. The three-dimensional model traces the paths of ancient landmasses that once collided and maps the stable cores of the continent that have barely changed in billions of years.
It also captures geological features that seismic methods alone cannot detect.
The work isn’t finished, though. Mapping the hazard in real time is one thing. Acting on it fast enough to protect the grid is another.
“There is still a gap between knowing the geoelectric fields in real-time and using this information to make timely operational decisions. Prediction, not just detection, is the next frontier,” Kelbert said.
The full study is published in the journal Reviews of Geophysics.
—–
Like what you read? Subscribe to our newsletter for engaging articles, exclusive content, and the latest updates.
Check us out on EarthSnap, a free app brought to you by Eric Ralls and Earth.com.
—–