
Molecular evolutionary analysis of the current MV Hondius Andes virus outbreak and its closest rodent-associated relatives
Charu Sharma*1,2, Sanni Översti*2, Katrina Lythgoe1,2, Aris Katzourakis2, Spyros Lytras3, Mahan Ghafari†1,2
1Pandemic Sciences Institute, University of Oxford, Oxford, UK
2Department of Biology, University of Oxford, Oxford, UK
3Antigen Evolution & Design Lab, Department of Structural Biology and Chemistry, Institut Pasteur, Paris, France
*Equal contribution
†Contact: mahan.ghafari@ndm.ox.ac.uk
We analysed S, M and L segment sequences from the current MV Hondius Andes virus outbreak together with closely related human and rodent-derived Andes virus sequences from the European Nucleotide Archive (ENA), Pathoplexus and GenBank.
Our main findings are:
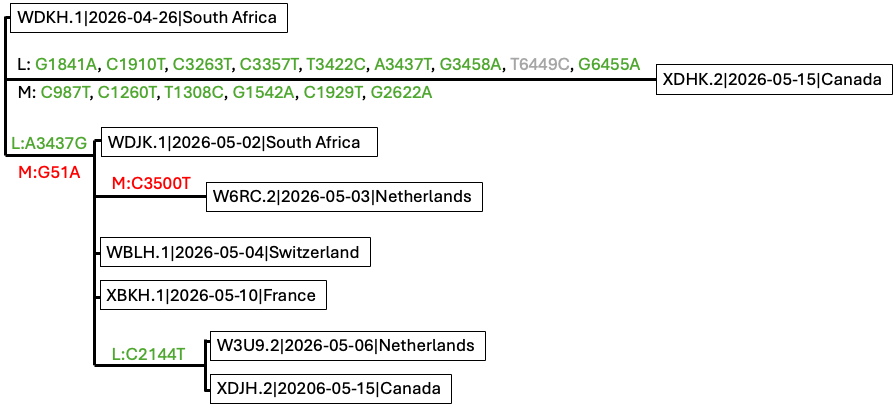
1. The sampled outbreak diversity is compatible with WDKH.1|2026-04-26 as the root of the current outbreak. Based on consensus sequence comparisons of the eight currently available outbreak sequences, as of 17 May 2026, we identified several candidate differences across the S, M and L segments (Figure 1). All coding-region differences were synonymous, including L:A3437G, L:2144T, and the additional M- and L-segment changes observed in XDHK.2; one site, L:T6449C could not be resolved at the amino acid level.The remaining non-coding or terminal differences, including S:G28/29A, M:G51A, and M:3500T, occur near poorly resolved alignment regions and may represent sequencing or consensus-calling artefacts pending raw-read validation. Overall, all sequences, with the exception of XDHK.2, remain nearly identical and support dating the sampled outbreak root to the earliest available sequence, collected on 26 April 2026. However, an ambiguous indel-associated signal near M:3500 in W6RC.2 raises the possibility of an alternative near-root placement, which would require raw-read validation before revising the rooting.
2. Phylogenetic evidence supports a rodent-reservoir origin of the outbreak from Andes virus diversity associated with Oligoryzomys longicaudatus (long-tailed rice rat) in Chile. Across the available closely related sequences, the S, M and L segment phylogenies showed congruent topologies despite uneven contextual sampling across segments. The M segment had the richest set of nearby comparator sequences, whereas the L segment had the sparsest contextual sampling. This pattern suggests no evidence for reassortment among the sampled lineages.
3. Molecular clock analyses estimate the timing of the closest common ancestors to the current outbreak lineage. Because Andes virus is maintained in rodent reservoirs, we consider the rodent-inclusive analyses most relevant for deeper time scales. In the M segment, which includes the genetically closest contextual sequence to the outbreak, KC567278.1-KC567261.1, the closest common ancestor was dated to May 1999 (95% highest posterior density: Feb 1985 – Jul 2007). The rodent-inclusive S-segment analysis gave an older and more uncertain estimate of Jul 1964 (95% HPD: Dec 1879 – Feb 1995). No equivalent rodent-inclusive estimate was possible for the L segment. These dates estimate the closest sampled common ancestors to the outbreak lineage, not the exact timing of any possible spillover event.
4. We find no evidence for an elevated molecular clock rate on the branch leading to the current outbreak. Mutation reconstruction showed that most coding-region stem mutations leading to the current outbreak were nonsynonymous: 11/13 in S (85%), 16/18 in M (89%), and 45/49 in L (91%), compared with neutral reference expectations of 79%, 78%, and 78%, respectively. A one-sided binomial test supported enrichment of nonsynonymous mutations in the L segment (p = 0.0096; Bonferroni-corrected p = 0.0288 across the three segments). This result should be interpreted cautiously given ancestral-state uncertainty and mutation-rate heterogeneity, but it is consistent with a modest excess of amino acid changing mutations on the L-segment stem branch. Our reconstructed stem-branch mutations may warrant further functional investigation.
We downloaded Andes virus sequences for the S, M and L genome segments from ENA, Pathoplexus and GenBank, including seven sequences associated with the current outbreak as of 17 May 2026: WDKH.1, WDJK.1, W6RC.2, WBLH.1, W3U9.2, XBKH.1, XDHK.2, and XDJH.2. All sequences used in the analysis and associated metadata are provided in Table S1 – WANE.2 is excluded since it has recently been revoked from Pathoplexus. For downstream molecular dating analysis, only the earliest five samples were retained.
Sequences were aligned to the reference genomes NC_003466.1, NC_003467.2 and NC_003468.2 [ref] using MAFFT v7.5 with the –keeplength option [ref]. We then manually inspected the consensus alignments, focusing especially on the current outbreak sequences, as only a small number of mutations separate them.
Several positions were masked before downstream analysis:
In the S segment, positions 22, 28, 1823-1824, and the terminal region from 1850 onwards were masked. These positions showed patterns consistent with local alignment artefacts, ambiguous bases or poor end-of-sequence resolution.
In the M segment, position 10 in WDJK.1 and positions 3651-3652 were masked because the relevant calls appeared unreliable.
In the L segment, the G at position 10 in WDKH.1 was treated as a one-base alignment shift and readjusted accordingly.
We removed OQ092243.1 because of poor overall alignment quality.
From the Bellomo et al. dataset [ref], we included only the naturally infected Oligoryzomys longicaudatus sequences: S segment OP555728 and M segment OP555724 and excluded sequences derived from cell-culture passage or experimentally infected golden hamsters.
For sequences without exact collection dates, we consulted the original studies and assigned bounded sampling-date priors based on the reported sampling intervals. These are listed in Table S2.
Outbreak mutation reconstruction
The phylogeny of the eight current outbreak sequences is compatible with taking WDKH.1|2026-04-26, the earliest sequence, as the root of the sampled outbreak diversity (Figure 1).
Figure 1. Manually reconstructed mutation tree of the eight available outbreak-associated Andes virus sequences as of 17 May 2026. The topology was constructed from the observed genetic similarity among samples after masking likely alignment or sequencing artefacts, rather than inferred using a phylogenetic dating program. Mutations are annotated with respect to reference genomes NC_003466.1 (S segment), NC_003467.2 (M segment) and NC_003468.2 (L segment). Green mutations are synonymous coding changes. L:T6449C could not be resolved at the amino acid level because the corresponding codon in WDKH.1 contains an ambiguous base. Red mutations are all non-coding and may represent sequencing or consensus calling artefacts pending raw-read validation.
After masking likely artefacts, as outlined above, we identified four mutations across the outbreak sequences, excluding the XDHK.2 sequence:
M segment: G51A, C3500T
L segment: A3437G, C2144T
Some of these mutations fall within the coding regions ANDVsMgp1 and ANDVsLgp1 (see Figure 1). However, we note that a previous Virological post, based on raw sequencing reads, reported that the S and M segment outbreak sequences were identical and retained only two SNPs in the L segment as true differences among outbreak sequences. Our analysis was based on consensus sequences only, and did not include raw-read level validation.
Ambiguous sites affecting outbreak rooting
Several ambiguous sites could affect the rooting of the outbreak sequences and should be interpreted cautiously in the absence of raw-read validation.
First, the earliest collected sample, WDKH.1, contains a G at M segment reference position 51, corresponding to the candidate mutation M:G51A in other outbreak sequences (Figure 1). However, this site is immediately followed by a missing base in the WDKH.1 consensus sequence and lies adjacent to the beginning of the M segment coding region. If interpreted literally, the G state would alter the expected ATG start codon of the M-encoded open reading frame to GTG. We therefore consider this site likely to reflect a sequencing, consensus-calling, or local assembly artefact rather than a reliable biological difference.
Second, W6RC.2 has a T at M segment position 3500 (M:C3500T), located in the 3′ non-coding region of the M segment. This T state is also present in the closest non-outbreak comparator sequences and in the reference sequence NC_003467.2 (Figure 2A). Two nucleotides upstream of position 3500, W6RC.2 also contains a partially resolved 8-nucleotide insertion that is absent from the reference genome but present in the closest available non-outbreak sequences. The outbreak sequence XBKH.1 contains a shorter 4-nucleotide insertion at the same coordinates. Taken at face value, the combination of M:3500T and the upstream insertion in W6RC.2 could suggest an alternative rooting in which W6RC.2 is placed closer to the non-outbreak comparator sequences, discordant with its sampling date. However, because this signal involves an indel in a poorly resolved terminal region, raw-read analysis is required to determine whether the insertion is genuine rather than a sequencing or assembly artefact.
Third, XDHK.2 is unusually divergent, particularly in the L segment, despite presumably deriving from the same Canadian patient as XDJH.2. Most of the additional differences in XDHK.2 are unique to that sequence. However, two L-segment sites overlap with states observed in the closest non-outbreak comparator sequences: L:3263T and L:3437T (Figure 2B). Position 3263 lies immediately upstream of a long stretch of ambiguous bases and is unresolved in XDJH.2. Position 3437 is variable across the alignment, with T in XDHK.2 and the comparator sequences, A in WDKH.1, and G in the remaining outbreak sequences. Although these patterns raise the possibility that XDHK.2 retains outgroup-like states at some sites, the combination of unique mutations, nearby ambiguity, and missing data means that we cannot confidently interpret XDHK.2 as an outgroup to the remaining outbreak sequences.
(A)
(B)
Figure 2. Ambiguous alignment features affecting possible rooting of the outbreak sequences. Nucleotide alignments of selected M (A) and L segment (B) regions showing sites that may influence the inferred rooting of the outbreak cluster. In the M segment, W6RC.2 carries M:C3500T in the 3′ non-coding region, matching the closest non-outbreak comparator sequences and the reference sequence NC_003467.2, and also shows a partially resolved upstream insertion. XBKH.1 carries a shorter insertion at the same region. In the L segment, XDHK.2 carries states matching comparator sequences at positions 3263 and 3437, but position 3263 is adjacent to a stretch of ambiguous bases and position 3437 is variable across the outbreak alignment. These sites may indicate alternative rooting signals, but they occur in regions affected by ambiguity or indel variation and require raw-read level validation before being interpreted as genuine phylogenetic signal.
Molecular clock analysis of closely related sequences
We next performed molecular clock analyses using the broader dataset of closely related human and rodent derived Andes virus sequences.
More distantly related sequences, including sequences clustering with Epuyén-like diversity, were excluded because they weakened temporal signal and were too divergent for robust outbreak-scale dating. After subsetting to sequences closely related to the current Hondius outbreak, TempEst analysis [ref] indicates presence of clock signal across all three segments (Figure S3).
For each segment, we ran eight model combinations using BEAST2:
strict clock + coalescent constant population size
strict clock + coalescent exponential population growth
relaxed clock (uncorrelated lognormal) + coalescent constant population size
relaxed clock (uncorrelated lognormal) + coalescent exponential population growth
When possible, analyses were conducted using three datasets defined by the completeness of collection date information:
Dataset 1: Human-host derived samples with complete collection dates (YYYY-MM-DD) (All segments)
Dataset 2: Dataset 1 plus human-host derived samples with partial collection dates (M segment)
Dataset 3: Dataset 2 plus rodent-derived samples (S and M segments)
Strict clock analyses (both under coalescent constant and exponential) converged well, with effective sample size (ESS) values above 200 for all parameters included in the model. Relaxed clock analyses using the full closely related datasets also converged well and showed no strong evidence for rate variation across branches, including on the stem branch leading to the current outbreak. Relaxed clock analyses across all segments which included only human-host derived samples were less stable, but this likely reflects limited evolutionary signal in the smaller datasets rather than evidence for strong rate heterogeneity.
Because relaxed clock analyses did not identify strong branch-specific rate variation, we report the main molecular dating estimates from the strict clock analyses.
Timescale of the closest common ancestor to the outbreak lineage
Across segments, the most consistently available close relatives of the current outbreak lineage were human-derived Andes virus sequences collected in Argentina in 2018 [ref], with GenBank accession IDs prefixed with MN; marked with orange in Figure 4. These MN sequences were available for the S, M, and L segments. Additional closely related sequences were available only for some segments. In the S and M segments, rodent-derived sequences were also available and clustered close to the outbreak-associated lineage, supporting its association with rodent-reservoir diversity. In the M segment, the human-derived sequence KC567278.1-KC567261.1 was the nearest available relative to the outbreak lineage (see Figure 4).
We observed evidence of timescale-dependent rate variation (Figure 3, Table S3). Analyses using only recent samples ranging from 2016-2026 inferred higher substitution rates and more recent common ancestor dates. Including older human and rodent samples from 1999 and the early 2000s reduced the inferred rate by nearly an order of magnitude and pushed the inferred common ancestor further back in time.
Figure 3. Posterior distributions of the inferred substitution rate for the S, M, and L segments under different dataset definitions. Dataset definitions are as described in the text. Broader datasets spanning longer timescales infer lower substitution rates. Dataset 3 was available for S and M only; no rodent-inclusive L segment dataset was available. Dataset 2 was available only for M.
Using the rate estimates based on calibration from recent samples (human-host derived samples with complete collection dates, i.e. dataset 1), the closest common ancestor of the current outbreak lineage was dated to (median estimates with 95% highest posterior density intervals; see Table S4):
S segment: 2014-08-17, 95% HPD: 2007-01-23 – 2017-10-13
M segment: 2009-06-28, 95% HPD: 1969-09-04 – 2017-03-22
L segment: 2006-08-12, 95% HPD: 1955-08-20 – 2015-11-20
Using the full dataset, including human samples with incomplete collection dates and rodent samples, the closest common ancestor was dated to (Figure 4, Table S4):
S segment: 1964-07-10, 95% HPD: 1879-12-06 – 1995-02-28
M segment: 1999-05-07, 95% HPD: 1985-02-06 – 2007-07-09
No equivalent rodent-inclusive estimate could be inferred for the L segment because no closely related rodent-derived L-segment sequences were available. Among the available segment datasets, we consider the M-segment dataset 3 estimate to be the most informative for dating the closest common ancestor of the outbreak lineage, because it includes the nearest available contextual sequence to the outbreak, KC567278.1-KC567261.1.
Figure 4. Time-scaled phylogenies and estimated closest common ancestor of the current outbreak lineage across the S, M and L segments using strict clock and coalescent constant population size models. Current outbreak sequences are highlighted in turquoise. Closest dated human comparator sequences are shown in orange, rodent-associated sequences in grey, and M-segment human sequences with bounded collection dates in purple. Red arrows indicate the closest common ancestor to the outbreak lineage; green boxes show median and 95% HPD estimates. S and M use dataset 3; L uses dataset 1 because no closely related rodent-derived L sequences were available. The L estimate is more recent, but lacks the closer KC/EU contextual sequences available for S and M and has a higher inferred clock rate.
Mutations leading to the outbreak lineage
We reconstructed mutations leading from the closest inferred common ancestor to the current outbreak lineage across the S, M and L segments (Figure 5). All of the mutations were in the coding regions and majority were nonsynonymous: 11/13 mutations in the S segment (85%), 16/18 in the M segment (89%), and 45/49 in the L segment (91%). These proportions are slightly higher than the neutral expectation obtained by enumerating all possible single-nucleotide mutations in the Andes virus reference coding regions, where approximately 79%, 78%, and 78% of possible mutations are nonsynonymous for the S, M and L segments, respectively.
Figure 5. Mutations from the closest common ancestor of S, M, and L segments (blue branch) leading up to the current outbreak lineage. Orange and green vertical lines represent nonsynonymous and synonymous mutations, respectively. Positions are mapped against reference genomes NC_003466.1, NC_003467.2 and NC_003468.2, respectively. Numbers on internal nodes of the trees show posterior support from maximum clade credibility trees.
Interpretation
Given the near identity of the outbreak sequences, with the exception of the XDHK.2 sequence from Canda, the sampled outbreak root is compatible with the earliest available sequence, WDKH.1, collected on 26 April 2026. We consider this the most parsimonious rooting under the consensus alignment after masking likely artefacts. However, ambiguous indel-associated signal around M segment position 3500 raises the possibility that W6RC.2 could represent an alternative root or near-root sequence, because it shares the T state at M:3500 and a nearby insertion pattern with the closest non-outbreak comparator sequences. Since this signal occurs in a poorly resolved terminal non-coding region, raw-read level validation is required before revising the outbreak rooting.
The broader phylogenetic context is consistent with the current outbreak emerging from Andes virus diversity associated with the Oligoryzomys longicaudatus reservoir in Chile. Molecular clock analyses of closely related human and rodent-associated sequences place an upper bound on the ancestry of the current outbreak lineage, but do not directly date on any possible spillover event.
The deeper timing remains sensitive to the timescale and host composition of the sequences included. The recent-only dataset, which includes only human samples, produces higher clock rate estimates and younger common ancestors. By contrast, inclusion of older human and rodent-associated samples lowers the inferred rate and pushes the common ancestor further back. Given that rodents are the natural reservoir of Andes virus, and that many of the deeper branches in the phylogeny are likely to reflect rodent-associated evolution, we consider the rate and timescale inferred from the dataset including all closely related rodent-associated sequences to be more relevant for dating the deeper ancestry of the current outbreak lineage. This pattern is also consistent with known timescale-dependent rate effects in viral molecular-clock analyses [ref, ref].
For the L segment, no closely related rodent-derived sequences were available. However, the inferred phylogenies were congruent across the S, M and L segments, and matching internal nodes gave broadly consistent dates across segments and datasets. This congruence provides no evidence for reassortment among the sampled sequences and supports the interpretation that the three segments share the same recent evolutionary history leading to the current outbreak.
Our mutation reconstruction on the stem branch leading to the current outbreak identified a high proportion of nonsynonymous changes across all three segments: 11/13 mutations in the S segment (85%), 16/18 in the M segment (89%), and 45/49 in the L segment (91%). These values are higher than the neutral baseline obtained by enumerating all possible single-nucleotide mutations in the reference coding regions. A one-sided binomial test did not support significant nonsynonymous enrichment in the S or M segments, but did suggest enrichment in the L segment (p = 0.0096; Bonferroni-corrected p = 0.0288 across the three segments). This result should be interpreted cautiously given ancestral-state uncertainty, mutation rate heterogeneity and the simplicity of the neutral baseline, but it is consistent with a modest excess of amino acid changing mutations on the L-segment stem branch. Also, our relaxed clock analyses did not show evidence for an elevated substitution rate on the stem branch leading to the current outbreak (Figure S1). We therefore do not find evidence for episodic increases in the molecular evolutionary rates leading up to the outbreak, although the mutation spectrum may warrant further investigation for possible functional or selective signals which is something we are currently working on (Figure 5).
As a robustness check, we repeated both the molecular dating and mutation-reconstruction analyses using Delphy [ref] and obtained very similar results (not shown here).
Overall, our results support a recent sampled outbreak origin, a rodent-reservoir source within Andes virus diversity, and no evidence for elevated molecular clock rate leading to the current outbreak. Using the slower clock rates inferred from datasets including older human and rodent-associated samples, we estimate an upper bound of approximately the mid-1960s to late-1990s for the timing of the closest common ancestor of the current outbreak lineage across the three segments. However, further work is needed to determine which rate timescale is most appropriate and to refine estimates of the deeper ancestry of the outbreak lineage.
Molecular dating analysis
We used BEAST 2 v2.6.3 [ref] for all time-scaled phylogenetic analyses. For each segment, we used an HKY+I substitution model, estimating the proportion of invariant sites. Uniform priors ranging from 1.0E-05 to 1.0E-02 s/s/y were assigned to the strict clock rate parameter (clockRate) and the relaxed clock mean parameter (ucldMean). All remaining priors were left at their default settings. MCMC analyses were run for 10-90 million iterations, with the initial 10% discarded as burn-in. Convergence and mixing of the chains were assessed using Tracer v1.7.2 [ref]. Maximum clade credibility (MCC) trees with median node heights were generated using TreeAnnotator with a 10% burn-in and visualised in FigTree v1.4.4 [ref]. For samples without exact collection dates, we assigned flat priors over the likely sampling interval based on information from the original studies. These date ranges are listed in Table S2. In some analyses, posterior tip-date estimates showed weak preference toward the lower bound of the prior interval, but the signal was not very strong (Figure S2). Nevertheless, including these bounded-date samples improved the consistency of molecular clock rate estimates across strict and relaxed clock analyses.
We compared strict and relaxed molecular-clock models under constant and exponential population-size priors. Because relaxed-clock analyses showed little evidence for strong among-branch rate variation, and because strict-clock analyses converged consistently across all segments, the main results are reported from the strict-clock analyses.
Ancestral sequence reconstruction
We inferred ancestral sequences for the internal nodes of segment-specific trees containing subsets of human and rodent-derived sequences closely related to the current outbreak. Ancestral-state reconstruction was performed in IQ-TREE v2.3.5 using the –asr flag using the GTR+F+G4 substitution model, which was identified by ModelFinderPlus as the best-fitting model under AIC for each segment [ref].
To characterise the mutations leading to the current outbreak lineage, we compared the reconstructed sequence at the closest common ancestor of the outbreak lineage with the reconstructed sequence on the branch leading to the current outbreak cluster (see Figure 5). We then counted nucleotide changes falling within the annotated coding regions of each segment. The resulting mutation set was consistent with the mutations inferred using Delphy, with the exception of one additional S-segment mutation at position 354 in our IQ-TREE-based reconstruction.
We thank all laboratories and researchers who generated and shared the sequence data used in this analysis. Full accession information and acknowledgements are provided in Table S1. MG acknowledges funding provided by Wellcome Trust (Grant number: 309205/Z/24/Z). CS acknowledges funding support provided by the Moh Family Foundation Global Health scholarship towards her DPhil.
Table S1. Sequence metadata (zip file attached). Hanta_metadata_2026-05-19_all_segments.csv.zip (4.2 KB)
Table S2. Sequences with uncertain collection dates and assigned sampling-date uniform priors.
Table S3. Inferred clock rate estimates under strict clock and constant population size models. Rates are given in substitutions/site/year. Dataset 1 includes human samples with complete collection dates, with the oldest sample from 2016. Dataset 2 adds human samples with partial or bounded collection dates, extending the sampling window to 2010. Dataset 3 further includes rodent-associated samples, extending the sampling window to 1999.
Table S4. Inferred estimates for the closest common ancestor of the current outbreak lineage across the S, M, and L segments using strict clock and coalescent constant population size models. Dataset 1 includes human samples with complete collection dates, with the oldest sample from 2016. Dataset 2 adds human samples with partial or bounded collection dates, extending the sampling window to 2010. Dataset 3 further includes rodent-associated samples, extending the sampling window to 1999.
Figure_S1_relaxed_clock_trees.pdf (74.7 KB)
Figure S1. Time-scaled phylogenies across the S, M and L segments using uncorrelated lognormal relaxed clock and coalescent constant population size models. Time-scaled phylogenies for the S, M and L genome segments, including the current outbreak sequences (turquoise) and the closest available human and rodent-associated Andes virus sequences. The closest previously sampled human sequences with complete collection dates from Bellomo et al. [ref] (GenBank accession IDs beginning with MN) are shown in orange. Rodent-associated sequences from Medina et al. [ref] (GenBank accession IDs beginning with EU) are displayed in grey, and human-associated M-segment sequences with inexact collection dates from Martinez-Valdebenito et al. [ref] (GenBank accession IDs beginning with KC) are shown in purple. Branches in the phylogenetic trees are coloured according to median evolutionary rate estimates (substitutions/site/year), with red indicating lower rates and blue indicating higher rates. Median rate estimates and their corresponding 95% highest posterior density intervals (95% HPDs) for the stem branch leading to the current outbreak are shown beneath the branch. The S- and M-segment analyses were performed using dataset 3, which includes closely related human and rodent-associated sequences, whereas the L-segment analysis used dataset 1 due to the absence of closely related rodent-derived L-segment sequences. For the L-segment, relaxed clock analyses with coalescent constant population size model based solely on human-derived samples exhibited poor mixing, resulting in ESS values below 100 for multiple model parameters, and these results should therefore be interpreted with caution. Comparable issues were observed in the S- and M-segment relaxed clock analyses using dataset 1.
Figure S2. Posterior estimates of tip dates for samples lacking exact collection dates. Results are shown for the M-segment dataset 3 analysis under a strict molecular clock and coalescent constant population size model. In each panel, red dashed lines indicate the lower and upper bounds of the uniform prior distribution applied for each tip. Estimates are expressed in years before the most recent sample (2026-05-06).
Figure S3. Phylogenetic trees with the best-fitting root obtained using ‘heuristic residual mean squared’ from Tempest showing all human sequences for the S, M and L segments. Sequences from the Epuyen outbreak are highlighted in blue and the selected human sub-samples for the molecular clock analysis (including the current Hondius outbreak sequences) in red.