
Baseline characteristics of participants
Initially, 717 potentially eligible patients were identified from the hospital databases. Subsequently, 17 patients were excluded due to diagnosis of other type diabetes, pregnancy, or end-stage comorbidities. An additional 262 patients were excluded because of missing echocardiography reports, and 76 were excluded for established cardiovascular diseases. Ultimately, 362 patients were included in the final analysis. Among them, 178 (50.28%) were male. The mean age of the patients was 45.07 years old while onset age of diabetes was 36.19 years old, with a mean diabetes duration of 8.78 years. The average BMI was 22.69 kg/m2 and the mean HbA1c was 80.92 mmol/mol (9.55%). There were 108 (30.59%) patients with a history of smoking, 82 (23.56%) patients with hypertension, and 226 (62.43%) patients with dyslipidemia. All enrolled participants received standardized diabetes care according to prevailing clinical guidelines. The majority of patients (337 [93.09%]) utilized a multiple daily injection (MDI) regimen. Moreover, there were 25 (6.91%) of the population utilized continuous subcutaneous insulin infusion (CSII) therapy. A proportion of patients were prescribed adjunctive glucose-lowering agents, primarily metformin and acarbose, which were used by 71 (19.61%) and 70 (19.34%) patients respectively. Additionally, cardiovascular disease risk assessment and management were implemented for all patients. Statins were used by 134 patients (37.02%), and angiotensin-converting enzyme inhibitor or angiotensin II receptor blocker (ACEI/ARB) agents by 43 patients (11.88%).
According to echocardiography examination, the overall prevalence of echocardiographic abnormalities in this study was 32.60%, with cardiac structural abnormalities and ventricular diastolic dysfunction accounting for 19.61% and 21.27% respectively. Additionally, 8.29% of patients were concomitantly diagnosed with both subtypes.
The association between echocardiography indicators and clinical parameters
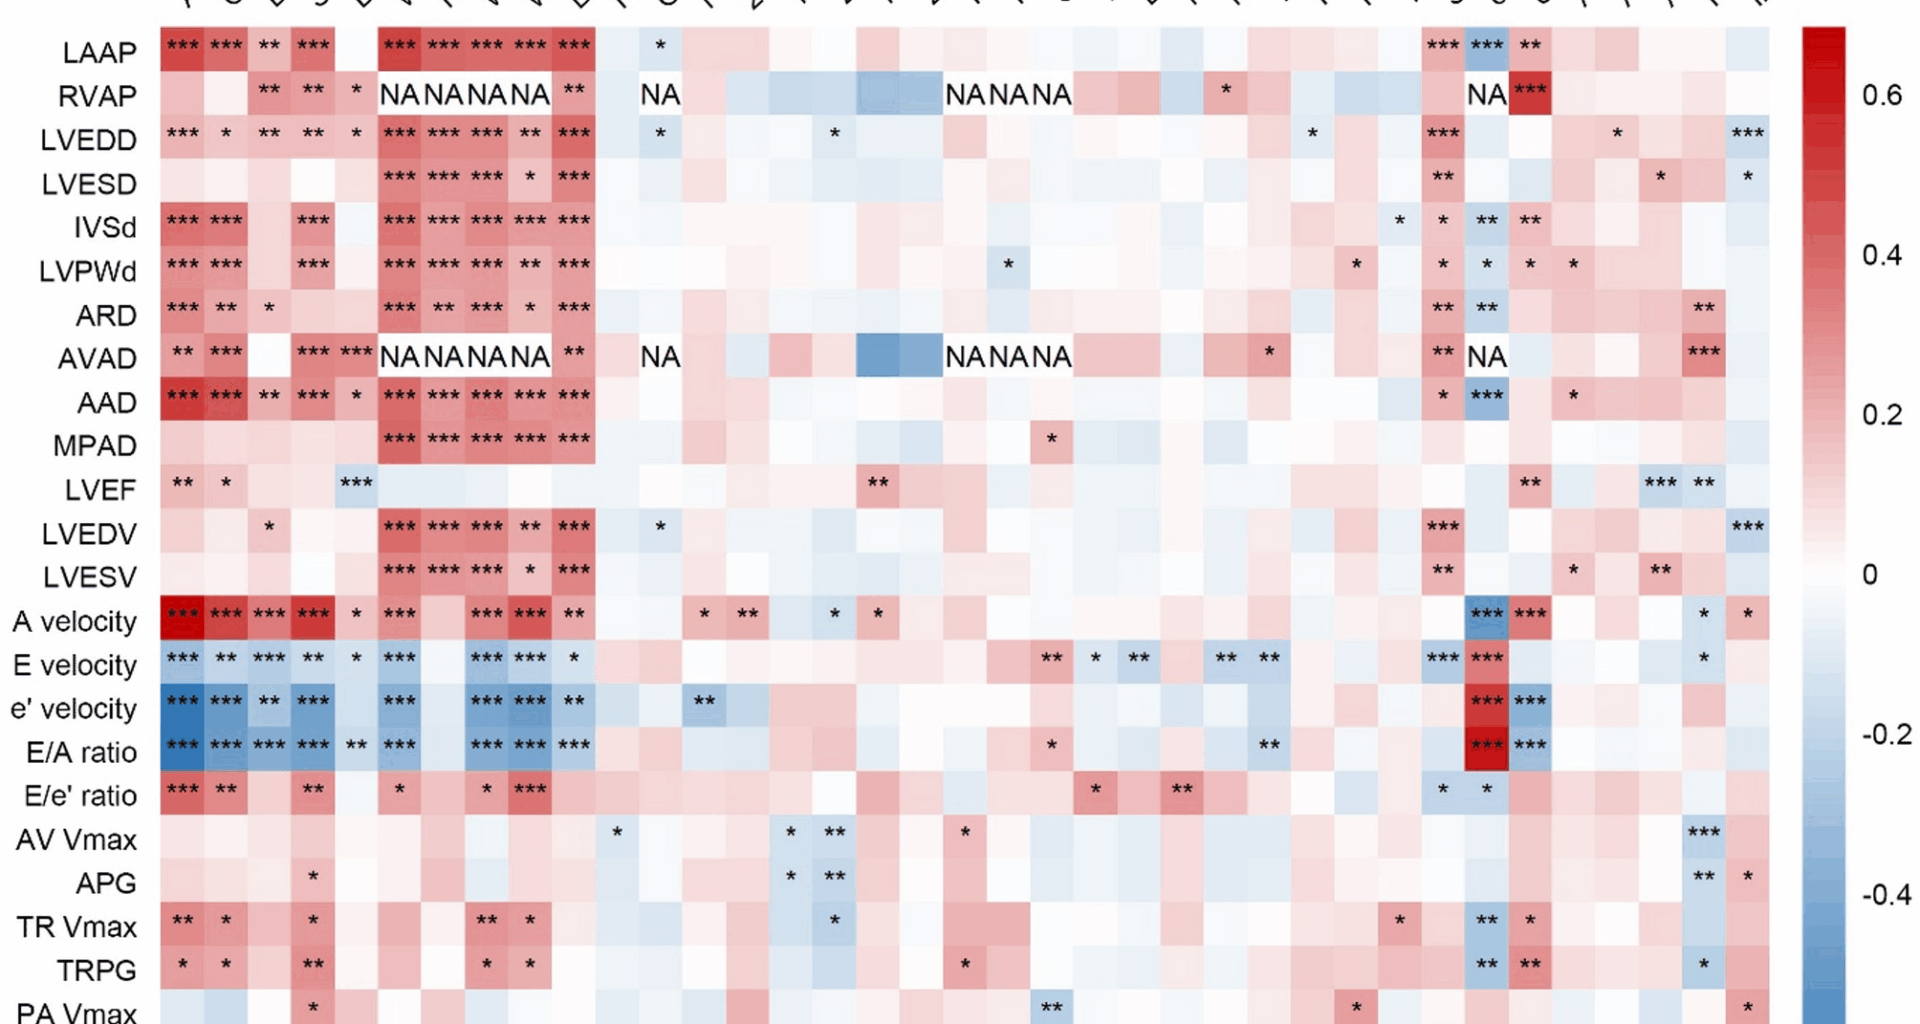
The results of spearman’s rank correlation analysis between clinical parameters and echocardiography indicators were displayed in Fig. 1. It was found that an older age was associated with higher LAAP, LVEDD, IVSd, LVPWd, LVEF, A velocity, E/e’ ratio, TR Vmax, but lower E velocity, e’ velocity and E/A ratio (all P < 0.05). Higher SBP was associated with higher LAAP, LVEDD, IVSd, LVPWd, A velocity, E/e’ ratio, TR Vmax, ePASP, and lower E velocity, e’ velocity, E/A ratio (all P < 0.05). As for obesity-related parameters, higher BMI was associated with a higher LAAP, LVEDD, IVSd, LVPWd, and lower E velocity, e’ velocity, E/A ratio (all P < 0.05). Concerning renal-related indicators, Higher eGFR was associated with lower LAAP, IVSd, LVPWd, A velocity, TR Vmax, ePASP and higher E velocity, e’ velocity, E/A ratio (all P < 0.05). Higher UACR was associated with higher LAAP, IVSd, LVPWd, LVEF, A velocity, TR Vmax, ePASP and lower e’ velocity, E/A ratio (all P < 0.05).
Fig. 1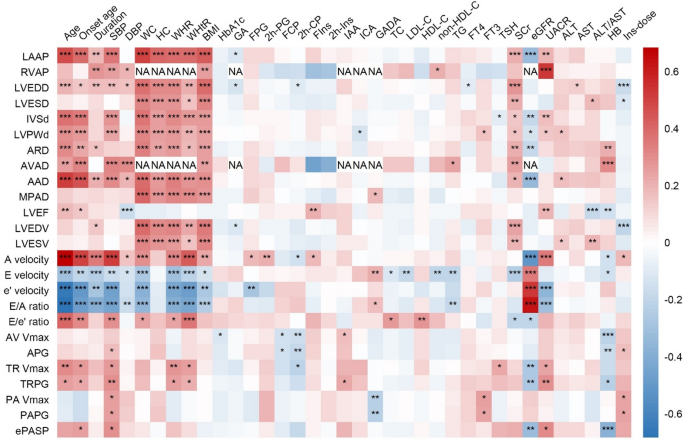
The correlations between clinical parameters and echocardiographic indicators. *P < 0.05, **P < 0.01, ***P < 0.001. NA, not available due to insufficient data. LAAP, left atrial anteroposterior diameter; RVAP, right ventricular anteroposterior diameter; LVEDD, left ventricular end-diastolic diameter; LVESD, left ventricular end-systolic diameter; IVSd, interventricular septal thickness at end-diastole; LVPWd, left ventricular posterior wall thickness at end-diastole; ARD, aortic root diameter; AVAD, aortic valve annulus diameter; AAD, ascending aortic diameter; MPAD, main pulmonary artery diameter; LVEF, left ventricular ejection fraction; LVEDV, left ventricular end-diastolic volume; LVESV, left ventricular end-systolic volume; AV Vmax, aortic valve maximum velocity; APG, aortic pressure gradient; TR Vmax, tricuspid regurgitation maximum velocity; TRPG, tricuspid regurgitation pressure gradient; PA Vmax, pulmonary artery maximum velocity; PAPG, pulmonary artery pressure gradient; ePASP, estimated pulmonary artery systolic pressure; SBP, systolic blood pressure; DBP, diastolic blood pressure; WC, waist circumference; HC, hip circumference; WHR, waist-hip ratio; WHtR, waist-height ratio; HbA1c, glycated Hemoglobin; GA, glycated albumin; FPG, fasting plasma glucose; 2 h-PG, 2-h plasma glucose; FCP, fasting C-peptide; 2 h-CP, 2-h C-peptide; FIns, fasting insulin; 2 h-Ins, 2-h insulin; IAA, insulin autoantibodies; ICA, islet cell autoantibodies; GADA, glutamic acid decarboxylase autoantibodies; TC, total cholesterol; LDL-C, low-density lipoprotein cholesterol; HDL-C, high-density lipoprotein cholesterol; non-HDL-C, non-high-density lipoprotein cholesterol; TG, triglycerides; FT4, free thyroxine; FT3, free triiodothyronine; TSH, thyroid stimulating hormone; SCr, serum creatinine; eGFR, estimated glomerular filtration rate; UACR, urinary albumin to creatinine ratio; ALT, alanine aminotransferase; AST, aspartate aminotransferase; HB, hemoglobin; Ins-dose, insulin dosage per kilogram of body weight
The associations between clinical parameters and echocardiographic abnormalities in patients with T1DDemographic and lifestyle
Age (56.10 ± 14.95 years old vs. 39.69 ± 14.85 years old, P < 0.001), onset age (45.31 ± 14.48 years old vs. 31.78 ± 14.57 years old, P < 0.001), and duration (10.67 ± 9.50 years vs. 7.87 ± 8.54 years, P = 0.003) were significantly higher in patients with echocardiographic abnormalities than those without. The distribution of smoking status also differed among the subgroups (P = 0.003) as the proportions of past smokers (14[12.17%] vs. 8[3.36%]) and current smokers (31[26.96%] vs. 55[23.11%]) were higher in those with echocardiographic abnormalities (Table 1). After applying Bonferroni correction for multiple comparisons, the statistical significance was maintained. Univariable modified Poisson regression analysis indicated that older age, older onset age, longer diabetes duration, and smoking history were associated with an increased prevalence of echocardiographic abnormalities (Additional file 1: Figure S1). After adjusted for confounders including age, sex, duration, smoking history, BMI, and HbA1c, it was found that older age (PR = 1.04, 95% CI 1.03 to 1.05), smoking history (PR = 1.85, 95% CI 1.21 to 2.83), and male sex (PR = 1.60, 95% CI 1.04 to 2.47) were still associated with higher prevalence of echocardiographic abnormalities while older onset age (PR = 0.93, 95% CI 0.88 to 0.98) was associated with a reduced prevalence (Fig. 2).
Table 1 Comparison of clinical parameters between groups classified by echocardiographic abnormalitiesFig. 2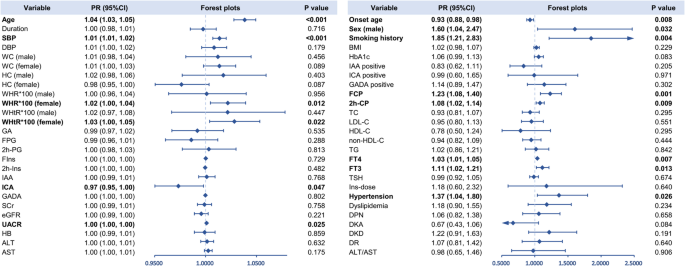
Multivariate Poisson regression for the associations between clinical parameters and echocardiographic abnormalities in patients with T1D. Age, duration, sex, smoking history, BMI, and HbA1c were accordingly adjusted. Bold font indicates significance. SBP, systolic blood pressure; DBP, diastolic blood pressure; WC, waist circumference; HC, hip circumference; WHR, waist-hip ratio; WHtR, waist-height ratio; HbA1c, glycated Hemoglobin; GA, glycated albumin; FPG, fasting plasma glucose; 2 h-PG, 2-h plasma glucose; FCP, fasting C-peptide; 2 h-CP, 2-h C-peptide; FIns, fasting insulin; 2 h-Ins, 2-h insulin; IAA, insulin autoantibodies; ICA, islet cell autoantibodies; GADA, glutamic acid decarboxylase autoantibodies; TC, total cholesterol; LDL-C, low-density lipoprotein cholesterol; HDL-C, high-density lipoprotein cholesterol; non-HDL-C, non-high-density lipoprotein cholesterol; TG, triglycerides; FT4, free thyroxine; FT3, free triiodothyronine; TSH, thyroid stimulating hormone; SCr, serum creatinine; eGFR, estimated glomerular filtration rate; UACR, urinary albumin to creatinine ratio; ALT, alanine aminotransferase; AST, aspartate aminotransferase; HB, hemoglobin; Ins-dose, insulin dosage per kilogram of body weight; DPN, diabetic peripheral neuropathy; DKD, diabetic kidney disease; DR, diabetic retinopathy; DKA, diabetic ketoacidosis
Physical parameters
Individuals with echocardiographic abnormalities had a higher SBP (137.18 ± 19.12 mmHg vs. 121.57 ± 18.49 mmHg, P < 0.001) compared with those without, while DBP exhibited no significant difference between the groups. As for obesity-related parameters, WC (male: 87.62 ± 8.55 cm vs. 83.32 ± 9.78 cm, P = 0.018; female: 85.88 ± 13.95 cm vs. 79.69 ± 8.96 cm, P = 0.008), WHR (male: 0.91 ± 0.07 vs. 0.89 ± 0.07, P = 0.043; female: 0.90 ± 0.09 vs. 0.84 ± 0.07, P < 0.001), and WHtR (male: 0.52 ± 0.05 vs. 0.49 ± 0.05, P = 0.004; female: 0.55 ± 0.09 vs. 0.50 ± 0.06, P < 0.001) were all higher in echocardiographic abnormalities group both for male and female. Moreover, patients with echocardiographic abnormalities had a higher BMI (23.28 ± 3.39 kg/m2 vs. 22.40 ± 3.50 kg/m2, P = 0.027) compared with those without (Table 1). Univariable modified Poisson regression analysis revealed that SBP, WC, WHR, WHtR, and BMI were associated with an increased prevalence of echocardiographic abnormalities (Additional file 1: Figure S1). After adjusted for confounding factors including age, sex, duration, smoking history, BMI, and HbA1c, it was found that SBP (PR = 1.014, 95% CI 1.007 to 1.020), WHR in female (PR = 1.022, 95% CI 1.005 to 1.039), and WHtR in female (PR = 1.028, 95% CI 1.004 to 1.053) were still associated with higher prevalence of echocardiographic abnormalities (Fig. 2).
Blood glucose, islet function, and autoantibodies
Blood glucose, islet function, and autoantibodies parameters did not exhibit inter-group difference (Table 1). In univariable modified Poisson regression, FCP and 2 h-CP were associated with an elevated prevalence of echocardiographic abnormalities while higher level of ICA titer was associated with lower prevalence (Additional file 1: Figure S1). This effect remained significant for FCP (PR = 1.23, 95% CI 1.08 to 1.40), 2 h-CP (PR = 1.08, 95% CI 1.02 to 1.14) and ICA titer (PR = 0.97, 95% CI 0.95 to 0.99) after adjusted for confounding factors including age, sex, duration, smoking history, BMI, HbA1c (Fig. 2).
Biochemical metabolic indicators
The eGFR was significantly lower in patients with echocardiographic abnormalities than those without (100.60 ± 22.25 ml/min/1.73 m2 vs. 116.95 ± 16.99 ml/min/1.73 m2, P < 0.001) while UACR was significantly higher (164.42 ± 567.12 mg/g vs. 63.33 ± 325.52 mg/g, P < 0.001). Additionally, in patients with echocardiographic abnormalities, HB was significant lower (129.26 ± 14.84 g/L vs. 134.22 ± 17.51 g/L, P = 0.009) (Table 1). Univariable modified Poisson regression analysis showed that higher level of FT3, UACR and AST were associated with an increased prevalence of echocardiographic abnormalities while higher level of eGFR and HB were associated lower prevalence (Additional file 1: Figure S1). After adjusted for confounding factors (age, sex, duration, smoking history, BMI, and HbA1c), it was found that FT4 (PR = 1.03, 95% CI 1.01 to 1.05), FT3 (PR = 1.11, 95% CI 1.02 to 1.21), and UACR (PR = 1.0002, 95% CI 1.00003 to 1.0004) were associated with higher prevalence of echocardiographic abnormalities (Fig. 2).
Cardiovascular comorbidities and diabetic complications
Patients with echocardiographic abnormalities had a higher prevalence of hypertension (45[39.47%] vs. 37[15.81%], P < 0.001), DPN (61[51.69%] vs. 93[38.11%], P = 0.015) and DKD (32[27.12%] vs. 43[17.62%], P = 0.040) but a lower prevalence of DKA (13[11.02%] vs. 69[28.28%], P < 0.001) (Table 1). In univariable modified Poisson regression, higher prevalence of hypertension, DPN and DKD were associated with an increased prevalence of echocardiographic abnormalities, but higher prevalence of DKA was associated with lower prevalence (Additional file 1: Figure S1). In multivariate Poisson regression model, hypertension (PR = 1.37, 95% CI 1.04 to 1.80) was still associated with higher prevalence of echocardiographic abnormalities (Fig. 2).
The non-linear associations between clinical parameters and echocardiographic abnormalities
Univariable RCS analysis showed that there were non-linear associations between SBP (P for overall < 0.001, P for non-linearity = 0.007), FPG (P for overall = 0.024, P for non-linearity = 0.011), non-HDL-C (P for overall = 0.028, P for non-linearity = 0.027), TSH (P for overall < 0.001, P for non-linearity < 0.001), eGFR (P for overall < 0.001, P for non-linearity = 0.001), UACR (P for overall < 0.001, P for non-linearity < 0.001), HB (P for overall = 0.014, P for non-linearity = 0.037), and Ins-dose (P for overall = 0.014, P for non-linearity = 0.009) and echocardiographic abnormalities (Additional file 1: Figure S2).
After adjusted for confounding factors including age, sex, duration, smoking, HbA1c and BMI, the non-linear association could still be observed between SBP (P for overall < 0.001, P for non-linearity = 0.003) (Fig. 3a), SCr (P for overall = 0.029, P for non-linearity = 0.011) (Fig. 3b), UACR (P for overall = 0.015, P for non-linearity = 0.048) (Fig. 3c), and Ins-dose (P for overall = 0.001, P for non-linearity < 0.001) (Fig. 3d) and prevalence of echocardiographic abnormalities. Specifically, the relationship between SBP and the prevalence of echocardiographic abnormalities exhibited an approximately S-shaped curve. The PR for echocardiographic abnormalities increased moderately when SBP was below 100 mmHg or above 150 mmHg. In contrast, a steeper gradient in the PR was observed within the intermediate SBP range (100–150 mmHg). The associations between SCr or UACR and echocardiographic abnormalities demonstrated L-shaped and inverted L-shaped patterns, respectively. The PR for echocardiographic abnormalities rose sharply with decreasing SCr within 0–50 μmol/L and with increasing UACR within 0–5 mg/g. Beyond these ranges, changes in SCr or UACR were not significantly associated with alterations in the PR of echocardiographic abnormalities. Furthermore, Ins-dose displayed a U-shaped association with the prevalence of echocardiographic abnormalities, wherein both excessively high and low Ins-dose were associated with an elevated prevalence.
Fig. 3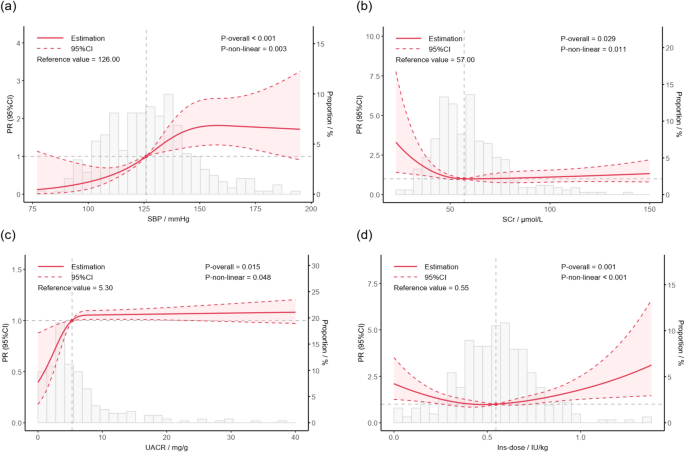
The non-linear associations between clinical parameters and echocardiographic abnormalities. Age, duration, sex, smoking history, BMI, and HbA1c were accordingly adjusted. SBP, systolic blood pressure; SCr, serum creatinine; UACR, urinary albumin to creatinine ratio; Ins-dose, insulin dosage per kilogram of body weight. a The non-linear associations between SBP and echocardiographic abnormalities; b The non-linear associations between SCr and echocardiographic abnormalities; c The non-linear associations between UACR and echocardiographic abnormalities; d The non-linear associations between Ins-dose and echocardiographic abnormalities
Sensitive analysis
In sensitive analysis regarding different subtype of echocardiographic abnormalities, some factors demonstrated robust consistency with the primary outcome, while subtype-specific patterns also emerged for certain variables (Additional file 1: Figure S3). It showed consistent associations of older age, younger onset age, smoking history, elevated SBP, higher FT3 and FT4, and lower ICA titer with higher prevalence of both cardiac structural abnormality and ventricular diastolic dysfunction. Notably, obesity-related parameters exhibited subtype-specific divergence: elevated WHR (PR = 1.04, 95% CI 1.01 to 1.06) and WHtR (PR = 1.05, 95% CI 1.02 to 1.08) remained significantly associated with cardiac structural abnormality in females, aligning with echocardiographic abnormalities, whereas no such associations were observed in ventricular diastolic dysfunction group. Conversely, hypertension, elevated DBP, FCP, 2 h-CP, UACR, AST, and reduced HDL-C were specifically associated with higher prevalence of ventricular diastolic dysfunction.