
Research subjects
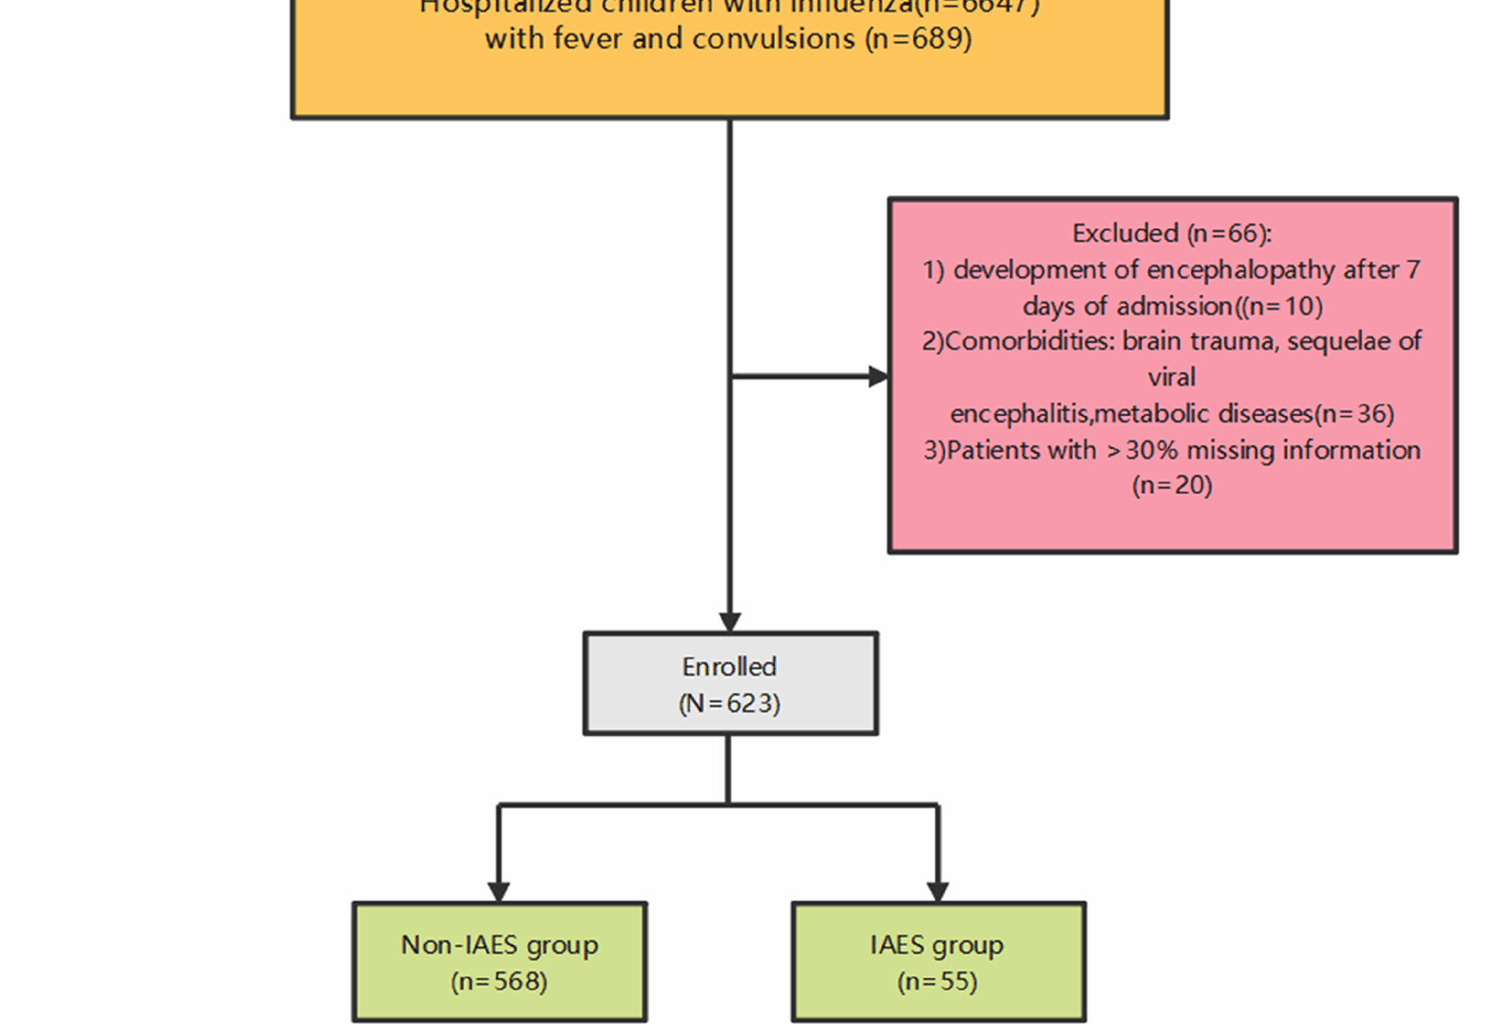
This study is a retrospective case-control study. Data of 6,647 pediatric influenza patients treated at Wuhan Children’s Hospital Affiliated to Tongji Medical College of Huazhong University of Science and Technology from January 2020 to January 2025 were collected. We enrolled 623 influenza patients presenting with fever and convulsions (Fig. 1), all of whom had no evidence of co-infections and received oseltamivir after diagnosis, with Nonsteroidal Anti -inflammatory Drugs (NSAIDs) administered for fever management during the febrile phase. The study was approved by the Medical Ethics Committee of Wuhan Children’s Hospital (approval number: 2024R044-E01). Due to the retrospective nature of the study, the Medical Ethics Committee of Wuhan Children’s Hospital waived the need of obtaining informed consent. All methods were carried out in accordance with relevant guidelines and regulations (e.g. Helsinki guidelines).
Fig. 1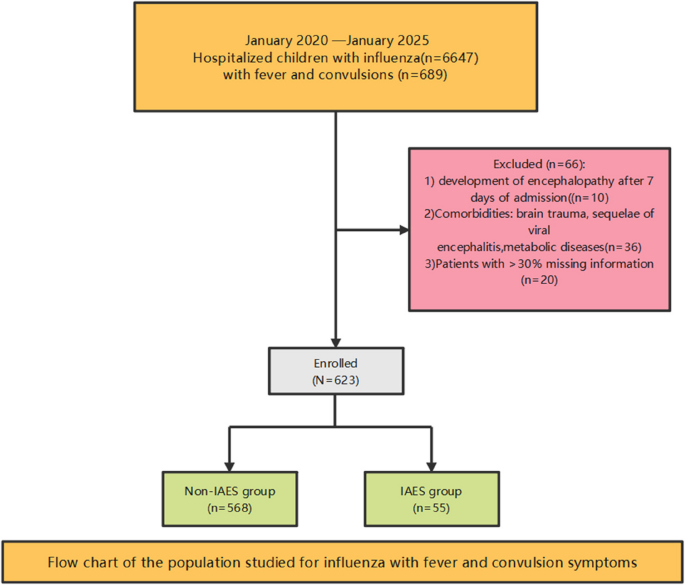
Flow chart of the population studied for influenza with fever and convulsion symptoms
Inclusion criteria
① Oropharyngeal swab pathogen detection indicates type A (type B) antigen (RNA) positivity; ② Clinical symptoms include both fever and seizures. Exclusion criteria: ①development of encephalopathy/neurological complications after 7 days of admission (to focus only on acute course IAES; ② Presence of underlying diseases: brain trauma, post-viral encephalitis, metabolic disorders; ③ Patients with missing information > 30%.
The diagnostic criteria for IAES
Clinical manifestations
Presence of central nervous system dysfunction (consciousness disturbance with Glasgow Coma Scale (GCS) < 12, seizures, or other neurological deficits) persisting for > 24 h.
Imaging findings
Head CT or MRI showing cerebral edema, symmetric lesions in bilateral deep gray matter (e.g., basal ganglia, thalamus), or multifocal hemorrhagic necrosis (in acute necrotizing encephalopathy).
Epidemiological link
Illness occurring during the influenza season or within 7 days of confirmed/suspected influenza infection.
Exclusion of other causes
Ruling out other CNS infections, autoimmune encephalitis, or metabolic encephalopathy.
Research methods
Clinical data includes baseline information (gender, age, weight, height), symptoms and signs (fever peak, number of convulsions, DFOC, duration of convulsions, body temperature during convulsions, nasal congestion, runny nose, cough, wheezing, vomiting, diarrhea, altered consciousness, respiration and heart rate), medical history (febrile seizures, epilepsy), invasive treatment methods (mechanical ventilation (MV), blood purification), laboratory tests upon admission (pathogen detection (Influenza A, Influenza B), complete blood count (white blood cells(WBC), neutrophils(NEU), lymphocytes(LYM), monocytes(MONO), red blood cells(RBC), hemoglobin(Hb), platelets(PLT)), inflammatory markers (procalcitonin(PCT), high-sensitivity C-reactive protein(hs-CRP)), organ function indicators (liver function, myocardial enzymes, kidney function, electrolytes, coagulation function), full immune test (IgG, IgM, IgA, IgE, C3, C4), immune function monitoring (CD3 + CD4 + T, CD3 + T, NK, CD19 + B, CD3 + CD8 + T, CD4+/CD8 + ratio), cytokines (IL-6, IL-10, IL-2, TNF-a, IL-4)).
Statistical analysis
Statistical analyses were performed using R 4.4.3 and SPSS 25.0 software. Shapiro-Wilk test was used to test whether the data followed a normal distribution. Measurement data conforming to a normal distribution were expressed as mean ± standard deviation (SD), and compared with Student’s t-test. For non-normal data, they used Mann-Whitney U (reporting median [IQR]), and for categorical data χ² or Fisher (frequencies and percentages). Variables with statistically significant differences in univariate analysis (p < 0.05) were included in multivariate logistic regression analysis. Stepwise regression methods were used to screen independent risk factors for IAES in influenza pediatric patients with symptoms of fever and convulsions. Independent risk factors and statistical parameters identified based on the logistic regression model were used to construct a nomogram model using R software. P value of less than 0.05 was considered statistically significant. The receiver operating characteristic curve (ROC) was plotted to evaluate the predictive performance of the model. The Bootstrap resampling method was used for 1,000 internal resamples to plot the calibration curve and calculate the mean square error (MSE) for evaluating model accuracy. Additionally, decision curve analysis was utilized to evaluate the clinical effectiveness of the model.