
Baseline clinical characteristics of the study population
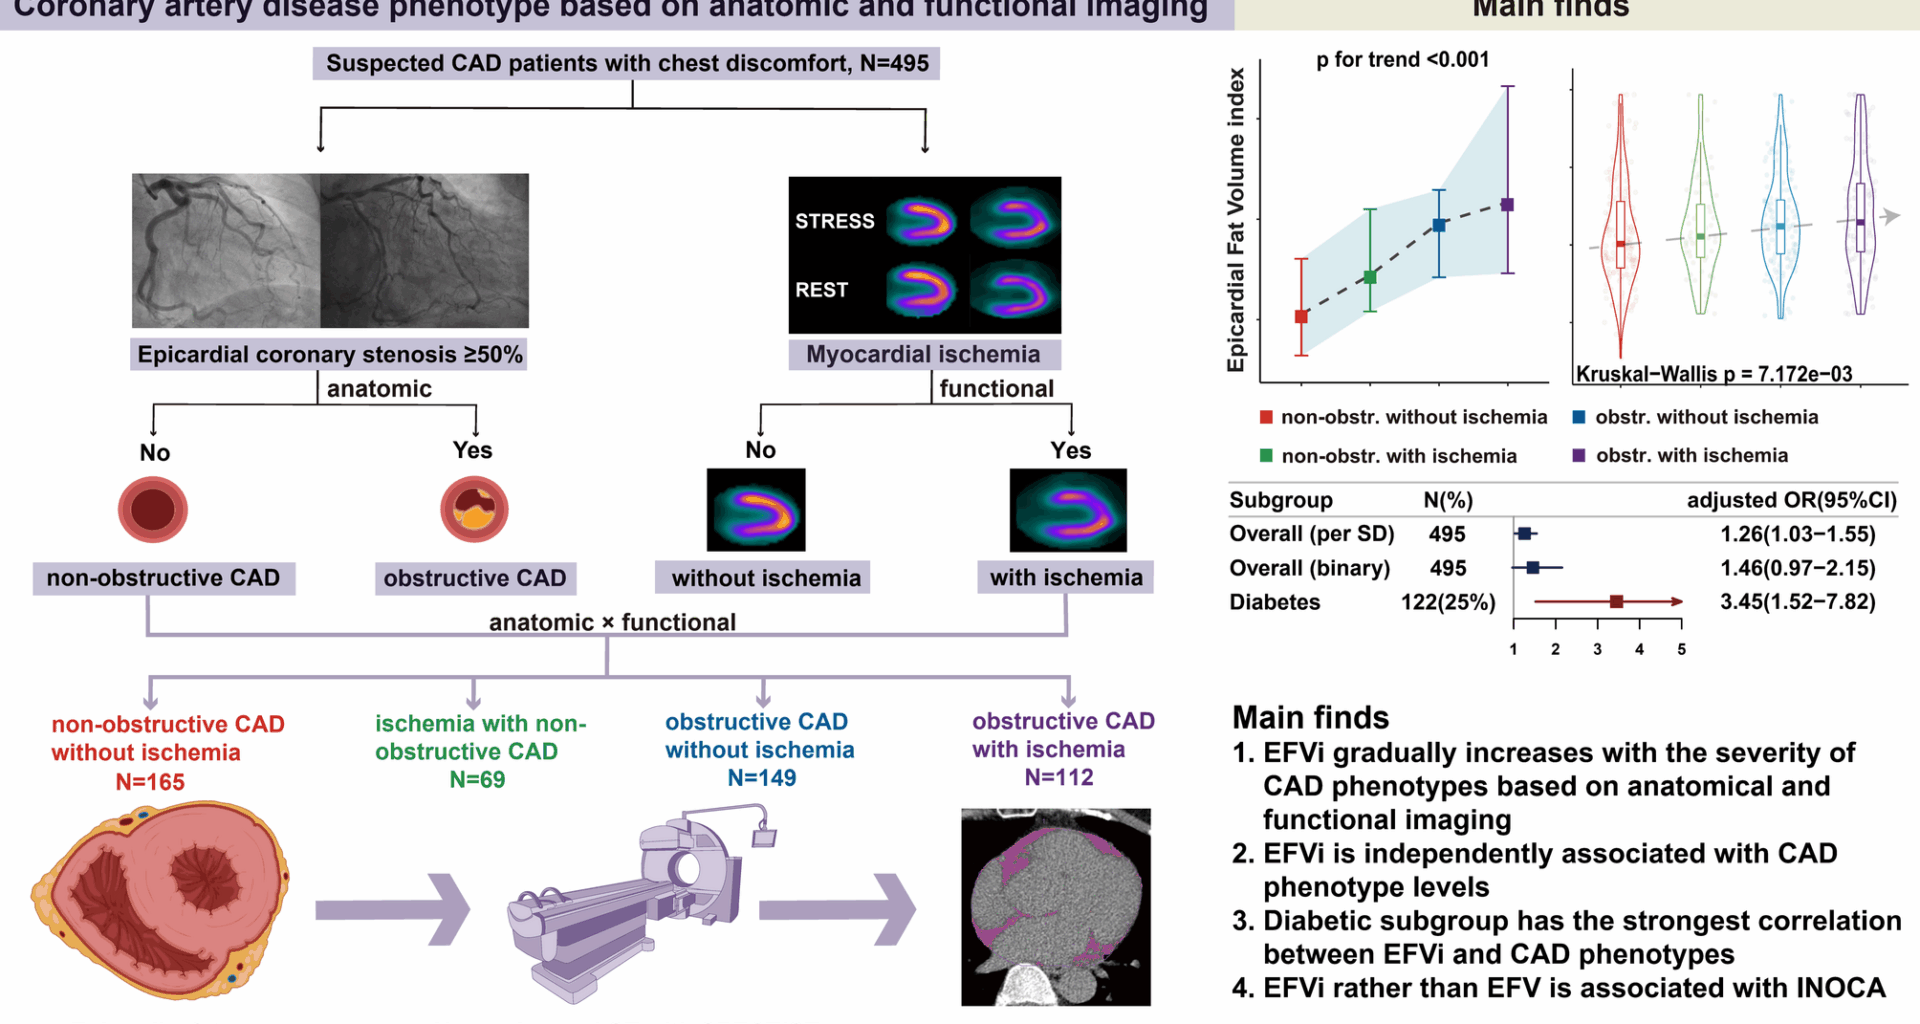
In our study, a total of 495 patients were included. The median age of the study population was 63 years (IQR: 56–70 years), with 57% male. Patients underwent exercise stress (79%) or pharmacologic stress with adenosine/regadenoson (21%). Coronary anatomy stenosis was assessed by CAG (77%) or CTA (23%). In 495 suspected CAD patients, 165 (33%) had non-obstructive CAD without ischemia (Group1), 69 (14%) had ischemia with non-obstructive CAD (Group2), 149 (30%) had obstructive CAD without ischemia (Group3), and 112 (23%) had obstructive CAD with ischemia (Group4). The baseline clinical characteristics were listed in Table 1.
Table 1 Baseline clinical data distribution of the study population
The proportion of males and diabetes increased progressively from Group1 to Group4 (male: 46% vs. 51% vs. 65% vs. 68%, diabetes: 16% vs. 20% vs. 29% vs. 34%, both p for trend < 0.001). Hypertension prevalence was highest in patients with Group4, while it was comparable among other three groups (58% vs. 59% vs. 56% vs. 77%, p = 0.003). There were no significant statistical differences in the distribution of hyperlipidemia across four groups. Medication usage, including antiplatelet agents, statins, and nitrates, showed a gradual increase trend from Group1 to Group4 (all p for trend < 0.001). All revascularization until discharge occurred in obstructive CAD, especially in obstructive CAD with ischemia (Table 1). In terms of hematological indicators and echocardiography parameters, fibrinogen concentration (FIB) showed a gradual increase trend from Group1 to Group4 (p for trend < 0.001). C-reactive protein (CRP) and left ventricular ejection fraction (LVEF) did not show significant differences or trends across four groups (Table S1).
Epicardial fat parameters in the study population
EFVi showed significant differences across four groups but post hoc analysis showed only Group3 vs. Group1 and Group4 vs. Group1 were statistically significant (Table 1; Fig. 2). EFVi showed a gradually increasing trend from Group1 to Group4 in trend analysis [cm3/m2, 80.54 (68.10-102.37) vs. 84.44 (73.57-100.93) vs. 89.63 (75.39-103.15) vs. 91.67 (76.48-111.66), p = 0.007, p for trend < 0.001, Table 1; Fig. 2]. Similar results were found in EFV between four groups (Table 1, Fig. S1). Epicardial fat mean density had no difference or trends across four groups.
Association of epicardial fat volume index and coronary artery disease phenotypes
In ordered logistic regression model, cutoff value was determined by univariate ordered logistic regression model between EFVi and CAD phenotypes with the minimum p value. In unadjusted ordered logistic regression model, for every SD (26.26) cm3/m2 unit change in EFVi, the probability of CAD phenotype transitioning to higher level increased by 1.35 times (OR = 1.35, 95%CI: 1.15–1.60, p < 0.001, Table 2). For 96.68cm3/m2 for the binary cutoff threshold, higher EFVi increased the probability of CAD phenotype transitioning to higher level by 1.82 times compared to lower EFVi (OR = 1.82, 95%CI: 1.30–2.54, p < 0.001, Table 2). After adjusting for age, sex, BMI, log transformed CACS, LVEF and the traditional cardiovascular risk factors, EFVi showed independent association of CAD phenotypes except for binary form which was borderline statistically associated with CAD phenotypes [EFVi (per SD), OR = 1.26, 95%CI: 1.03–1.55, p = 0.024; EFVi (EFVi >96.68), OR = 1.46, 95%CI: 0.97–2.15, p = 0.059, Table 2]. EFV showed independent association of CAD phenotypes both in continuous and binary forms after adjusting for age, sex, BMI, log transformed CACS, LVEF and the traditional cardiovascular risk factors [EFV (per SD), OR = 1.25, 95%CI: 1.01–1.54, p = 0.044; EFV (EFV >152.25), OR = 1.49, 95%CI: 1.02–2.10, p = 0.041, Table S2].
Table 2 Association of EFVi with CAD phenotypes
In unordered multinomial logistic regression model, optimal cutoff values of EFVi distinguishing Group2 to Group4 from the reference category (non-obstructive CAD without ischemia) were derived through ROC curve analysis, with Youden index maximization via the R software pROC package. Three cutoff values of EFVi were used: the cutoff value for INOCA was 80.67cm3/m2, cutoff value for Group3 was 89.22 cm3/m2 and cutoff value for Group4 was 96.81 cm3/m2. After adjusting for age, sex, BMI, log transformed CACS, LVEF and the number of traditional cardiovascular risk factors, EFVi in both continuous and binary forms showed the independent association of Group3 and Group4 [EFVi: per SD unit change for Group3, OR = 1.40, 95%CI:1.03–1.90, p = 0.031, per SD unit change for Group4, OR = 1.48, 95%CI:1.01–2.07, p = 0.023; EFVi (binary): EFVi >89.22 for Group3, OR = 2.30, 95%CI: 1.31–4.06, p = 0.004; EFVi >96.81 for group4, OR = 2.26, 95%CI: 1.17–4.38, p = 0.015, Tables S3, S4, Fig. S2]. EFV was also independently associated with Group3 and Group4 [EFV: per SD unit change for Group3, OR = 1.39, 95%CI:1.01–1.92, p = 0.046, per SD unit change for Group4, OR = 1.43, 95%CI: 1.01–2.04, p = 0.046; EFV (binary): EFV >136.02 for Group3, OR = 2.54, 95%CI: 1.43–4.54, p = 0.002; EFV >151.74 for group4, OR = 2.20, 95%CI: 1.15–4.24, p = 0.018, Tables S3, S4, Fig. S2]. However, the association of EFVi with INOCA was only independent in binary form (EFVi: per SD unit change for INOCA, OR = 1.13, 95%CI: 0.79–1.61, p = 0.494; binary, EFVi >80.67 for INOCA, OR = 2.53, 95%CI: 1.25–5.12, p = 0.010, Tables S3, S4, Fig. S2). EFV was not correlated with INOCA neither in continuous nor binary forms (EFV: per SD unit change for INOCA, OR = 1.08, 95%CI: 0.74–1.57, p = 0.696; binary, EFV >134.47 for INOCA, OR = 1.94, 95%CI: 0.97–3.88, p = 0.058, Tables S3, S4, Fig. S2).
Correlation between epicardial fat volume index and cardiovascular risk markers
Table 3 presented the correlation between EFVi and cardiovascular risk markers. EFVi was positively correlated with age, BMI, systolic blood pressure (SBP), fasting blood glucose (FBG), Triglycerides (TG), TnI/hsTnI and logCACS, while it was negatively correlated with high density lipoprotein (HDL) (all p < 0.05). The correlations between EFVi and these parameters were very weak to weak (correlation coefficients r absolute values ranged from 0.095 to 0.387, Table 3). EFVi was correlated with hypertension, diabetes, hyperlipidemia and obstructive CAD (all p < 0.05). However, EFVi was marginally correlated with myocardial ischemia (OR = 1.20, 95%CI: 1.00-1.44, p = 0.056, Table 3). Meanwhile, after adjusting for age, BMI, SBP, FBG, TG, HDL, diabetes and smoke, EFVi is still independently correlated with CAD phenotype levels in ordered logistic regression model (EFVi: per SD unit change: OR = 1.29, 95%CI: 1.06–1.57, p = 0.011; EFVi >96.68: OR = 1.56, 95%CI: 1.07–2.28, p = 0.02). Although EFVi is correlated with CAD risk factors, EFVi is still an independent risk factor for CAD phenotype levels.
Table 3 Correlation between EFVi and cardiovascular risk markersSubgroup analysis
Subgroup analysis found that the association of EFVi with CAD phenotype levels was more prominent in normal weight (BMI < 25) and diabetes subgroups, particularly in diabetes subgroup in ordered logistic regression model (Fig. 3). The proportional odds ratio was 1.99 in normal weight subgroup (OR = 1.99, 95%CI: 1.02–3.86, p = 0.043) and 3.45 in diabetes subgroup (OR = 3.45, 95%CI: 1.52–7.82, p = 0.003). Interaction analysis showed that EFVi was independent of age, sex, BMI, hypertension, hyperlipidemia, smoke and coronary artery calcium score (CACS >0) on CAD phenotype levels. The interaction between diabetes and EFVi on CAD phenotype levels showed a trend interaction effect (p for interaction = 0.067, Fig. 3).
Incremental value of epicardial fat volume index to differentiate coronary artery disease phenotypes over traditional cardiovascular risk factors
Net reclassification improvement (NRI) showed that after adding EFVi >96.68 in clinical models including age, sex, BMI, hypertension, diabetes, hyperlipidemia and smoke in overall populations, EFVi could provide the incremental value of differentiating specific CAD phenotypes which were Group1 (non-obstructive CAD without ischemia) and Group4 (obstructive CAD with ischemia) over traditional cardiovascular risk factors (NRI for Group1: 0.22, 95%CI: 0.04–0.39, p = 0.013; NRI for INOCA: 0.02, 95%CI: -0.23-0.26, p = 0.91; NRI for Group3: 0.05, 95%CI: -0.14-0.23, p = 0.603, NRI for Group4: 0.22, 95%CI:0.02–0.42, p = 0.033, Fig. 4). Similar results were found in EFV. However, when analyzed in diabetes subgroup, EFVi could provide the incremental value of differentiating CAD phenotypes over traditional cardiovascular risk factors except for Group3 (NRI for Group1: 0.54, 95%CI: 0.11–0.92, p = 0.008; NRI for INOCA: 0.55, 95%CI: 0.04–1.03, p = 0.023; NRI for Group3: 0.18, 95%CI: -0.19-0.57, p = 0.355; NRI for Group4: 0.63, 95%CI: 0.26–0.95, p < 0.001, Fig. 5). EFV could only provide incremental value of differentiating Group4 over traditional cardiovascular risk factors in diabetes subgroup (NRI for Group4: 0.55, 95%CI: 0.18–0.86, p = 0.002, Fig. 5). The micro-average-AUC of adding EFVi in clinical model was trend higher than clinical model in diabetes subgroup (0.772 vs. 0.748, p = 0.094, Table S5).