
Study area
We developed, to our knowledge, the first integrated measurement of multi-taxa diversity, ecosystem services, pests and diseases, soil fertility, microclimate, and yield across 28 organic cacao agroforests in the northern Peruvian Amazon (San Martín Department; Fig. 7). The San Martín Department, responsible for 40% of the cacao production in Peru, has undergone a profound economic transformation over the past 30 years driven by alternative development policies aimed at replacing illicit coca cultivation with high-value agroforestry crops such as cacao and coffee8. The expansion of robust, legal agricultural markets and the development of farmer associations have successfully integrated smallholders into global value chains, catalyzing regional infrastructure development, improved public safety, and substantial rural poverty reduction79.
Fig. 7: Map of the study area.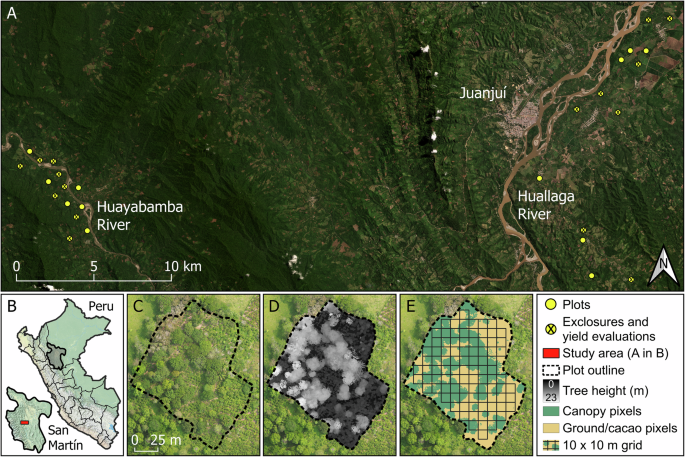
Location of the 28 study agroforests in the northern Peruvian Amazon (A, B) and an example of a drone-acquired orthomosaic image (C) used to calculate local shade-tree height (D) and cover (E) of the agroforests. We calculated shade-tree cover heterogeneity as the standard deviation of shade-tree cover values in 10 × 10 m squares (E). The satellite image (A) corresponds to a PlanetScope image for August 2022 and was accessed via Planet Explorer108 (© Planet Labs PBC 2026. All rights reserved). The maps of Peru and San Martín (B) were built in QGIS 3.28.1 based on the ESRI World Physical Map (ESRI Inc.). Orthomosaics and digital elevation models (C–E) were built using Agisoft Metashape Pro v.2.0.0 (Agisoft LLC) by blending georeferenced drone images taken at 100 m above ground.
San Martín has two marked seasons: a dry season from April to September (24 mm of minimum monthly average precipitation) and a wet season from October to March (92 mm of minimum monthly average precipitation; data extracted from https://weatherspark.com). Our 28 agroforests were evenly distributed between the central Huallaga River valley and the middle-upper Huayabamba River valley (Supplementary Fig. 1). Both regions have similar mean annual temperatures (26 °C) and precipitation levels (1200–1400 mm), but differ in the agricultural intensity of the predominant land-use types and the characteristics of the remaining secondary forest. The Huallaga River valley has a greater proportion of intensive monocultures (e.g., rice and papaya), and its forest cover is mainly composed of seasonally dry tropical forests. On the other hand, the Huayabamba River valley—approximately 30 km away—is dominated by smallholder agroforests and banana plantations, with its forest cover composed of lowland tropical moist forests. Soils in both regions are classified as Orthic Acrisols, characterized by high acidity and low nutrient retention capacity80.
In each region, we selected agroforests following gradients of shade-tree canopy openness and landscape complexity, represented by the proportion of tree and forest cover. Elevations ranged from 256 to 358 m.a.s.l. in the Huallaga valley and from 330 to 436 m.a.s.l. in the Huayabamba. Agroforests varied from 0.3 to 2.3 ha in size, with mean areas of 1.29 ± 0.63 ha in the Huallaga valley and 1.29 ± 0.67 ha in the Huayabamba. The minimum distance between agroforests was 407 m, and all but three of them were spaced at least 500 m apart (mean distance to the nearest agroforests: 1093 m). All cacao agroforests were managed by smallholders affiliated with organic farmer cooperatives—the Cooperativa Agraria Cacaotera Acopagro Ltda. in the Huallaga valley and the Cooperativa Agraria Cacaotera Choba Choba Ltda. in the Huayabamba—both of which adhere to stringent organic and fair-trade standards81. Shade trees in the agroforests were dominated by native timber species planted by farmers, including mahogany (Swietenia macrophylla), capirona (Calycophyllum spruceanum), and bolaina (Guazuma crinita). Fruit trees such as avocado (Persea americana), papaya (Carica papaya), and Citrus spp., as well as non-native timber species like Tectona grandis, were also present but generally less abundant. Although shade timber trees are regularly harvested and used as a secondary income source in our study area, agroforest owners committed to abstaining from harvesting them to maintain a consistent agroforest canopy structure throughout the study period.
Environmental variables
We used four variables to characterize agroforest canopy structure: shade-tree cover, cover heterogeneity, height, and height heterogeneity. For each agroforest, we built digital elevation models (DEMs) from drone images and measured shade-tree cover as the percentage of the agroforest covered by shade trees (pixels >7 m; Supplementary Fig. 1C–E). To calculate shade-tree cover heterogeneity, we divided canopy cover maps into 10 × 10 m sections (Supplementary Fig. 1E), measured the percentage of shade-tree cover in each section, and then calculated the standard deviation of shade-tree cover values across sections. Shade-tree height and height heterogeneity were measured as the average and standard deviation, respectively, of the maximum shade-tree height values in each 10 × 10 m section containing shade trees. DEMs were corrected to account for agroforest slopes before calculating shade-tree variables.
We estimated landscape complexity by calculating the percentages of landscape tree and forest cover in 500 m buffers from the agroforest perimeter. We extracted data on landscape tree cover using a 10 × 10 m resolution raster layer from ref. 82. The cover of mature, secondary, and riparian forests was estimated using satellite images extracted from PlanetScope for September 2022 on QGIS v3.28.1 and corrected through ground-truthing and drone images. Because dense agroforests are difficult to distinguish from forests in satellite imagery, the forest cover in this study may partially include highly shaded agroforests. Therefore, the main difference between the two landscape variables is the inclusion of scattered trees, tree monocrops, and low-shade agroforests in the landscape tree cover, but not in the forest cover.
We used the Pearson coefficient to calculate pairwise correlations between all environmental variables and additive models to analyze non-linear relationships between shade-tree cover and cover heterogeneity and between landscape tree and forest cover (Supplementary Table 9 and Supplementary Fig. 1).
Biodiversity surveys and metrics
In each of the 28 cacao agroforests, we assessed the diversity of two vertebrate and five arthropod taxa, namely: birds, aerial insectivorous bats, ants, butterflies, spiders, Hemiptera species, and beetles. As highly mobile organisms, insectivorous birds and bats act as critical top-down regulators of arthropod populations, while frugivorous and nectarivorous species utilize agroforests as transient or complementary habitats, promoting forest regeneration through seed dispersal and pollination36,58,83. Additionally, arthropods such as ants and spiders, as well as predatory beetles and Hemiptera species, form a complex mesopredator network that may further regulate herbivore dynamics37,42,84. Conversely, specialized herbivores such as butterfly caterpillars, sap-sucking Hemiptera, and leaf-cutter ants represent lower-trophic guilds that can damage cacao tissues, flowers, and developing pods, potentially limiting agroforest productivity38,74. Therefore, the selected taxa serve as complementary ecological indicators for assessing how shade-tree configuration and landscape context shape agroforest biodiversity and multifunctionality.
Bird surveys
Bird surveys were conducted using 15-min point counts in 2022 (September–November) and 2023 (May–September). Each agroforest was visited eight times between 06:00 and 10:00 a.m., with all birds seen or heard within a 25-m radius from the agroforest center recorded85. To minimize temporal bias related to observation time, point counts were alternated between regions and times of day. Birds flying over the agroforests were excluded from the counts. All point counts were carried out by the same observer (P.A-L.).
Bird data was previously published in ref. 44. Here, we expand these analyses to assess the influence of understudied aspects of shade-tree spatial and vertical heterogeneity and identify management practices that potentially promote agroforest biodiversity without yield loss.
Bat surveys
We surveyed bats using ultrasonic bat detectors (Song Meter Mini Bat, Wildlife Acoustics, USA) positioned approximately 1.5 m above the ground in 2022 (August–November). While acoustic detectors are the standard methodology for surveying aerial insectivorous bats in the Neotropics86, they cannot reliably assess phyllostomid species richness due to high structural and frequency overlap in their echolocation calls53. Consequently, our acoustic assessments focus exclusively on the aerial insectivorous guild. Each agroforest was sampled over four full nights (17:30-06:30), divided into two rounds of two consecutive nights. To account for spatial heterogeneity within the plots, the detector locations were changed between sampling rounds. Sampling was repeated in cases of heavy rainfall. Bat detectors recorded in full spectrum at a sampling rate of 385 kHz. We programmed them to trigger on ultrasonic signals exceeding a minimum threshold of 12 kHz, with a five-second recording duration and a left-channel gain of 12 dB. Recordings were analyzed using Kaleidoscope Pro v.5.6.6 (Wildlife Acoustics, USA) to identify five-second audio files containing at least two bat echolocation calls with frequencies between 8 and 180 kHz, durations of 2–500 ms, and a maximum inter-pulse interval of 500 ms. All the recordings matching these characteristics were classified manually to the species/sonotype level following reference keys for Amazonian bats87,88.
As for birds, the data obtained from the bat surveys were previously published in ref. 44 and re-analyzed here to assess the potential of promoting shade-tree spatial and vertical heterogeneity in agroforests as a win-win strategy for biodiversity and farmers.
Ant surveys
We assessed tree-dwelling ants in six cacao trees in each agroforest using baits in 2023 (March–June). The baits, two pieces of tuna of about two cm3 and two small sponge cubes soaked in a 30–40% sugar solution, were placed on a plastic plate (25 cm diameter) fixed on a cacao tree at about 1.5 m height89. The baits were active for two hours, during which we collected up to five individuals per morphospecies for later identification. Ant observations were carried out from 06:00 to 18:00. Each tree was sampled twice, once in the morning and once in the afternoon, with visits to the same agroforests spaced two or three weeks apart. We treated these two-hour observations per tree as our sampling unit when estimating ant species richness (see “Species richness and multidiversity calculation” section). This made a total of 12 ant samples per agroforest, except for one that only had ten samples.
Previous comprehensive assessments of ant diversity in primary Amazonian rainforests revealed marked differences in assemblage composition between the forest canopy and ground90. Consequently, as we sampled ants only on cacao trees, our conclusions about shade-tree and landscape management effects on ant richness are restricted to this subset of the ant assemblage.
Butterfly surveys
Butterfly species richness in agroforests was assessed in 2022 (August to November) using Van Someren-Rydon traps baited with bananas fermented for ca. 48 h prior to deployment91. Each agroforest was sampled twice using four understory traps (ca. 80 cm above ground). We used two additional canopy traps (ca. 8 m above ground) during the first visit to account for possible differences in butterfly communities between vertical strata. Visits to the same agroforest were spaced by at least two weeks. Traps were at least 30 m apart from the nearest one and remained active for 24 h. Two agroforests were sampled for 48 h on the second visit due to continuous rain during the first 24-h period of the second visit. Captured butterflies were photographed for identification. Specimens not easily identifiable were collected for later identification.
Spider, Hemiptera, and beetle surveys
We used pyrethrum knockdown via canopy fogging to sample free-living arthropods from three pairs of mature cacao trees in each agroforest, following the procedure described in ref. 92. Sampling occurred twice—once in September–October 2022 and again in 2023. A Swingfog SN-50 fogging machine (Swingtec GmbH, Germany) was used with a 1% pyrethrum suspension in petroleum white oil to produce a thermal fog that dispersed the insecticide throughout the tree crowns. Fogging was performed for 5–10 min per tree pair, from 18:00 to 21:00 under still air conditions. Arthropods were collected on plastic sheets placed beneath the tree crowns and left in place for 30 min. The collected specimens were preserved in 96% ethanol for later identification.
We used CO1-5P (mitochondrial cytochrome oxidase 1) DNA metabarcoding to identify spider, Hemiptera, and beetle Operational Taxonomic Units (OTUs) in the canopy fogging samples. Sample preparation (homogenization of bulk samples), laboratory work (DNA extraction from homogenized samples, amplification and sequencing), and bioinformatic analyses (OTU identification) were performed by Advanced Identification Methods GmbH (AIM; Leipzig, Germany; https://www.metabarcoding.com) following the protocols described in ref. 93 and ref. 94. We used a geographically filtered South American Barcode of Life Data Systems (BOLD) reference database curated by AIM to identify our OTUs to the order level. This database was compiled by filtering the full public BOLD dataset (downloaded on July 4, 2025) to retain valid barcode records restricted to South American countries and geographic coordinates between −58° and 17° latitude, and −86° and −30° longitude. Records from Costa Rica were additionally integrated into the reference database due to its high density of barcode sequences within the BOLD repository. We compared OTUs identified in the samples with this geo-delimited dataset and kept those with a BOLD Grade ID of at least 85%, the minimum required to identify OTUs at the order level93. We then selected OTUs belonging to the orders Araneae (spiders), Hemiptera, and Coleoptera (beetles) and summed the number of reads per OTU and agroforest.
Species richness and multidiversity calculation
To correct for differences in sample completeness between agroforests (Supplementary Table 10), we pooled species records to estimate agroforest-level species richness for an equal abundance-based sample coverage between agroforests using the R package iNEXT 95. We refer to these estimated values as “species richness” for simplicity. Bird and bat data were pooled by taking the maximum number of individuals per species recorded during each visit to prevent overestimation of species abundances from repeated counts. For ants, we used sampling-unit-based incidence frequency data due to the lack of abundance data. Butterfly records were pooled by summing the total number of captures of each species in each agroforest. For spiders, Hemiptera species, and beetles, we summed the number of reads per OTU and agroforest and then reduced the number of singletons (OTUs with only one read) before estimating species richness values, following ref. 93. Reference sample coverages for the estimations were defined as the minimum sample coverage across all agroforests extrapolated to twice the sample sizes96 (Supplementary Table 2). Finally, we calculated agroforest-level multidiversity as the average of the scaled richness values of each taxon, obtained by dividing the estimated richness of each taxon in the agroforest by the maximum estimated richness of each taxon across all agroforests97.
Exclusion experiments and cacao yield evaluations
To estimate bird and bat contributions to cacao yield, we set up exclusion experiments in 16 of the 28 agroforests (eight per region) selected to represent the gradients in shade-tree canopy structure and landscape complexity realized in each of the two regions. In each agroforest, we selected two pairs of contiguous cacao trees and built one exclosure for each pair. Therefore, each of the two exclosures covered two trees at the same time. Exclosures consisted of bamboo frames (6 m length, 2.5 m width, and 3.5 m height) covered with commercial fishing nets made of 0.40 mm invisible monofilament thread with a 2.5 cm mesh size. Exclosures were designed to block access by birds and bats to the treatment trees while permitting the entry of plant pathogens and arthropods, including potential insect pests39. In each agroforest, we selected two additional pairs of contiguous, non-enclosed trees as controls (n = 128 trees in total). By excluding bird and bat insectivores, we expected an increase in phytophagous arthropod damage to cacao leaves, flowers, and developing fruits in the exclusion trees, ultimately resulting in reduced harvestable yields compared to control trees39.
We monitored exclusion and control trees every two weeks from September 2022 to September 2023. In each monitoring visit, we (1) noted the number of healthy flowers (both open and developing flower buds) and developing fruits less than one cm long (ca. less than 15 days old) in a one-meter section of the trunk, (2) noted the number of fruits at different stages of development affected by different pests and diseases in the whole tree, (3) noted the number of healthy fruits at different stages of development in the whole tree; and (4) harvested all ripe healthy fruits. Healthy developing fruits were marked with plastic rings to avoid repeated counts, while those affected by pests and diseases were removed if they could no longer be harvested.
To transform the annual number of harvested pods per tree into weight measurements, we calculated the average dry weight of cacao beans in pods of different varieties. During the harvesting peak (June–August 2023), we (1) harvested 10 cacao pods from the most dominant cacao varieties in each agroforest, (2) fermented and sun-dried the contents of all pods of each variety separately, following the protocols of each cacao cooperative (6–7 days of fermentation and 2–3 days of drying), and (3) divided the total weight of the dry cacao beans by the number of pods in the sample. The most dominant varieties in the studied agroforests were: (1) Hybrid Huallaga, a mixture of the native Huallaga variety with commercial clones (60 pods harvested); (2) ICS-95 (40 pods harvested); (3) CYP-99 (40 pods harvested); and (4) mixtures of different native varieties (60 pods harvested98). We then multiplied the average dry weight of cacao beans per pod by the total number of pods harvested in each tree to calculate the kilograms of dry cacao produced by each tree throughout the year. The average dry weights of cacao beans per pod were calculated separately for each agroforest and cacao variety to account for genetic and spatial variability (e.g., differences in soil fertility and moisture between agroforests).
Ecosystem services and pest and disease incidence
To analyze how shade-tree structure and landscape complexity affected ecosystem services in cacao agroforests, we focused on two key services potentially affecting cacao yield: pest control by birds and bats, and pollination14. We estimated bird and bat pest control services by assessing their contributions to cacao yield at the agroforest level. To do so, we calculated the difference between the average yield of the control and exclusion trees in each agroforest (∆yield).
Cacao pollination is a complex process involving intricate ecological interactions in which, despite the presumed importance of ceratopogonid midges, the precise identity of the primary pollinators remains a subject of ongoing debate99,100. Rather than analyzing the cascading effects of arthropod suppression by birds and bats on cacao pollination, we aimed to identify shade-tree and landscape management strategies promoting pollination under natural conditions. Therefore, we assessed pollination services in the agroforests based on the fruit-set of cacao control trees only. As cacao flowers cannot self-pollinate, cacao fruit-set is a good proxy for pollination services in agroforests14. To calculate cacao fruit-set, we divided the total number of developing fruits with less than one cm (i.e., fruits that started developing in the past 15 days) counted in the marked one-meter sections by the total number of flowers counted throughout the year in this same section. Cacao flowers only remain open for 48 h, ensuring that they are not counted twice on different visits. Note that cacao fruit-set might have been underestimated due to the loss of flowers that were successfully pollinated after one visit but lost before they could be counted as developing fruits on the next visit.
To assess shade-tree and landscape effects on cacao pests and diseases, we calculated the incidence of Moniliophthora roreri (frosty pod rot, Agaricales) and Carmenta spp. (mainly C. foraseminis, Lepidoptera:Sessidae). Both incidences were calculated as the total number of fruits damaged by each species divided by the total number of developing fruits counted in each control tree. We only evaluated flower production, fruit-set, and pests and diseases in control trees (n = 64) to avoid interference from the exclusion experiments.
Agroforest soil fertility and microclimate
Soil fertility was assessed based on the pH and potassium, phosphorus, total nitrogen, and organic carbon contents of soil samples extracted at 0–-10 cm depth near the center of the agroforest. To evaluate the localized influence of shade-tree canopy structure on soil fertility, we collected a single soil sample per agroforest rather than a homogenized composite sample. This ensured the soil data remained paired with the canopy metrics quantified directly overhead. The studied agroforests were homogeneously fertilized in each region following advice from each cacao farmers’ cooperative. Soil samples were collected at least two months after applying organic fertilizers to avoid biases. One of the 28 plots was not sampled for soil fertility analyses due to logistical constraints. Composite samples (≈200 g) were dried in paper bags and analyzed at a commercial laboratory (Institut Dr. Nuss GmbH & Co. KG, Bad Kissingen, Germany) following the standard protocols of the Association of German Agricultural Analytic and Research Institutes101.
We used soil temperature and moisture loggers (TMS-4; TOMST, Czech Republic) to assess soil microclimatic variables (soil moisture and average and maximum daily temperature). One logger was placed near the center of each agroforest, recording temperature and moisture data every 15 min. Temperature (°C) was recorded at 8-cm depth, while moisture was measured at 0–14 cm depth using the time-domain transmission (TDT) method. Moisture values recorded with this method range from 100 (ambient air) to 3500 (distilled water102). Three of the loggers were damaged or lost during the study. Therefore, those agroforests were not included in the analyses of soil moisture and temperature.
Air temperature (°C) was measured using iButton DS1921H data loggers attached to cacao trees at ca. 1.5 m height. Initially, we placed one logger on each tree used in the yield evaluations and in those sampled with canopy fogging, making a total of eight loggers per agroforest in the 16 agroforests with exclusion experiments and 6 loggers per agroforest in the remaining 12 agroforests. However, due to logger loss or malfunction, the final number of loggers used per agroforest varied between four and eight (median = 6.5 loggers per agroforest). Air temperature measurements were taken every two hours.
To analyze how shade-tree management influenced agroforest microclimate across seasons, we calculated the average temperature and the average daily maximum temperature recorded by each logger in March and August 2023, the rainiest and driest months, respectively. For soil moisture, we used the mean records in each month. To relate soil composition and microclimate variables to shade-tree canopy structure, we used the digital elevation models to measure shade-tree cover, cover heterogeneity, height, and height heterogeneity in 20 × 20-m squares above each logger and soil collection site. For paired trees with temperature loggers (e.g., two exclusion trees inside the same bamboo cage), we measured shade-tree structure at the midpoint between the two trees.
Statistical analyses
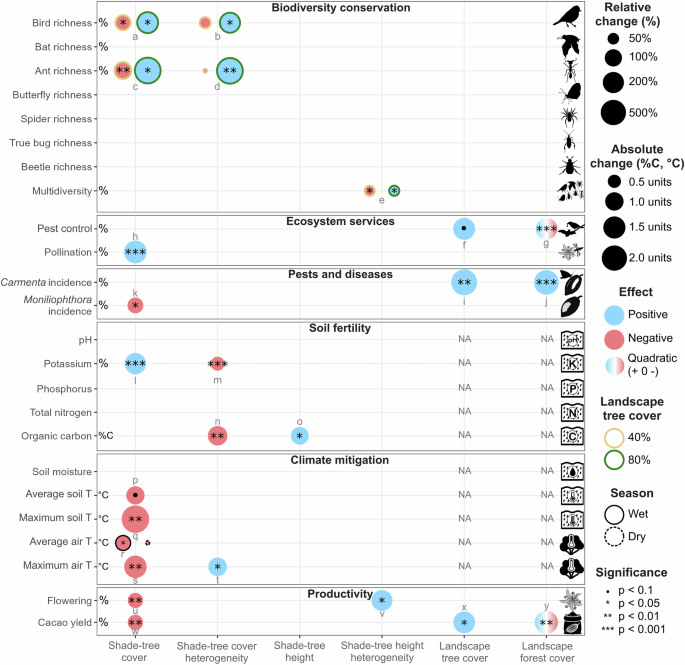
We used a multiple-testing approach to analyze shade-tree and landscape effects on biodiversity, ecosystem services, pest and disease incidence, and cacao yield. To assess biodiversity responses to shade-tree and landscape variables, we fitted eight generalized linear mixed models (GLMMs) for each of the eight response variables using Gamma distributions and logarithmic link functions for the seven richness variables, and beta distributions with logit link functions for multidiversity. Four of the eight models included one of the shade-tree structure variables (shade-tree cover, cover heterogeneity, height, or height heterogeneity) and its interaction with landscape tree cover, measured in the 500 m buffers around the agroforests. The remaining four models included each shade-tree variable and its interaction with landscape forest cover in the same buffers. Local and landscape predictors were scaled (mean = 0, sd = 1) before modeling. Region identity was included as a random effect. We compared each model to one with the same local and landscape variables but no interaction, and selected the one with the lowest Akaike Information Criterion corrected for small sample sizes (AICc) as the best-fitting one. Then, we compared the average marginal R2 of the four final models fitted with landscape tree cover and the average of the four models fitted with forest cover to identify the landscape variable that explained the greatest variability for each species richness response variable and multidiversity. In case of significant interactions between local shade-tree and landscape predictors in the best-fitting models, we projected the model to assess the influence of the shade-tree predictor on the response variable in landscapes with, on average, low tree or forest cover (40% tree cover or 6% forest cover; mean tree and forest cover minus one standard deviation) and in landscapes with high tree or forest cover (80% tree cover or 37% forest cover, mean tree and forest cover plus one standard deviation).
Shade-tree and landscape effects on cacao tree yield were analyzed using GLMMs with Gamma distributions and logarithmic link functions. We fitted two separate full models, each including either landscape tree cover or forest cover as a main predictor. Each model included the four scaled local variables (shade-tree cover, cover heterogeneity, height, and height heterogeneity) and their interactions with the treatment (control or exclusion trees), as well as the scaled landscape variable and its interaction with treatment. Additionally, we included the scaled quadratic effects of shade-tree cover and landscape tree and forest cover, and their two-way interactions with treatment, after preliminary visualizations of yield data distribution. Region was also included as a fixed effect to better represent differences in labor between the two cacao cooperatives. Tree-pair identity, nested within agroforest identity, was included as a random effect to account for spatial dependencies within agroforests. Before modeling, we transformed zeros into positive values by adding 0.0001 (0.1 g) in order to use Gamma distribution models. We removed shade-tree height from the full models after analyzing the multicollinearity between the predictors using the Variance Inflation Factor (VIF) in the R package performance103. We then used the ‘dredge’ function in MuMIn104 to sequentially remove interactions and predictors from the full models, and selected the model with the lowest AICc as the best-fitting one. Quadratic terms were retained if ∆AICc <2 to identify potential shade-tree cover and landscape tree and forest cover thresholds affecting cacao yield4. Additionally, we assessed yield-biodiversity relationships by calculating the Pearson correlation coefficient between biodiversity variables and the average yield of the four control trees in each agroforest (64 cacao trees in total) to identify potential trade-offs between biodiversity and yield.
As none of the best-fitting yield models for cacao yield included interactions between shade-tree predictors and treatment (Supplementary Table 3), we only included landscape predictors in the Linear Mixed Models (LMMs) analyzing bird and bat contributions to cacao yield (agroforest-level ∆yield). One LMM included the linear term of landscape tree cover, while the other one included the linear and quadratic terms of landscape forest cover. Both models included region identity as a random effect. We report tree yield and ∆yield results multiplied by 1100 to scale tree-level yield to kilograms per hectare, assuming 1100 trees per hectare at a 3 × 3 m planting grid typical of the studied cacao agroforests14.
We analyzed local and landscape effects on cacao fruit-set, number of cacao flowers, and incidences of Moniliophthora roreri and Carmenta spp. using GLMMs. Models for fruit set and pest and disease incidence were fitted with beta distributions and logit link functions, while models for the number of cacao flowers were fitted using a negative binomial distribution. Before modeling, we transformed zeros into positive values by adding 0.0001 in order to use beta distribution models. We fitted two models for each of these response variables, one including the four shade-tree variables and landscape tree cover, and one with the shade-tree variables and landscape forest cover. Both models included tree-pair identity nested within agroforest and region identity as random effects. Carmenta models did not include tree-pair identity as a random effect to avoid model convergence issues derived from low random variance. After checking the collinearity between the predictors, we removed shade-tree height from the full models due to high VIF values (>6; Supplementary Table 11). We then used ‘dredge’ to perform model selection and chose the model with the lowest AICc as the best-fitting one.
Because landscape tree and forest cover were correlated with agroforest elevation (r = 0.74 for tree cover and 0.86 for forest cover), which can influence agroforest soil composition and microclimate, we did not assess the influence of landscape variables on soil fertility and microclimatic variables. Instead, these models only included the four shade-tree variables and agroforest elevation as a covariate to control for its potential effects. Models for proportions of soil organic carbon and total nitrogen were fitted with beta distributions and logit link functions. Models for soil pH, phosphorus, potassium, and moisture were fitted with Gamma distributions and log link functions, while soil and air temperature models were fitted with Gaussian distributions. Air and soil temperature models, as well as soil moisture models, included two-way interactions between each shade-tree variable and season, and between agroforest elevation and season. All soil composition and microclimate models included region identity as a random effect. Microclimate models also included agroforest identity as a random effect to account for the repeated measurements (one in each season). Additionally, air temperature models included logger and tree-pair identity as random effects. Again, we reduced the full models using ‘dredge’ and selected the model with the lowest AICc as the best-fitting one.
To correct for multiple testing, we adjusted the p-values of the best-fitting models using the Bonferroni method. For biodiversity models, we compared the AICc values of the four models fitted with landscape tree cover and those of the models fitted with forest cover and selected the landscape predictor with the lowest mean AICc to infer shade-tree and landscape effects on biodiversity variables. Therefore, we multiplied the p-values of species richness and multidiversity models by four to report the results. The p-values of the models analyzing ecosystem services, pests and diseases, cacao flowering, and yield were multiplied by two to correct for the use of different models to analyze landscape tree and forest cover effects. In this case, we used the model with the lowest AICc of the two to report the p-values and estimates of shade-tree effects.
All models were run using the R package glmmTMB105 in R v4.5.1106. Residual distributions were inspected using the package performance103, while their spatial autocorrelation was tested using Moran’s I test (package ape107; Supplementary Table 12).