
Study population
UKB is a prospective cohort study of over 500,000 men and women aged 40–69 years at recruitment, which took place between 2006 and 2010 across 22 centres in England, Scotland, and Wales. At the baseline assessment, participants provided information on socio-demographic characteristics, lifestyle factors, diet, and underwent anthropometric measurements including BA and BIA.
The UKB imaging sub-study, nested within UKB [22], was initiated in 2014 and recruited approximately 20% of all UKB participants through a multi-stage process: 31% of invited UKB participants expressed willingness to join the imaging assessment, of whom 71% met eligibility criteria (excluding those with metal implants or inability to complete protocols), and 97% of eligible participants attended their scheduled appointments. During the imaging visits, participants underwent abdominal MRI imaging and reassessment of their BA, BIA, and lifestyle factors such as smoking status, alcohol consumption, and menopausal status in women. UKB imaging data are released in periodic batches, and our analysis used information on the 49,403 participants who had completed the imaging protocols at the time of data access (October 23, 2021). Details of the sub-study are reported elsewhere [22].
Our main analysis used the imaging cohort data, while we used data from the baseline cohort (the complete UKB population assessed during their initial recruitment visit) in secondary analyses focusing on BA and BIA indicators. For the imaging cohort, date of recruitment was defined as the date of imaging assessment. For the baseline cohort, date of recruitment was defined as the initial assessment date. For each studied health-related outcome, follow-up continued from date of recruitment until the earliest occurrence of the event of interest, death (for non-mortality outcomes), loss to follow-up, or the end of the study period, which ranged between December 2020 (Cancer registry of England) and May 2024 (Death registry of England and Wales), depending on the study centre and health-related outcomes.
All UKB participants provided informed consent at the baseline assessment, which included permission to access past and future medical records. UK Biobank is approved by the Northwest Multi-centre Research Ethics Committee as a Research Tissue Bank, and researchers do not require separate ethical clearance. The current study was conducted under the approved application number 55780.
BA measurements, BIA, and MRI assay
We considered six BA indicators: height, weight, BMI, WC, hip circumference (HC), and WHR. Height was measured to the nearest centimetre using a Seca 202 stadiometer, WC and HC were measured to the nearest centimetre using a Seca 200 tape measure, and body weight to the nearest 0.1 kg using a Tanita BC418MA (Tanita, Illinois, USA). BMI was calculated as body weight (kilograms, kg) divided by height in metres squared (m2), and WHR was calculated as WC (cm) divided by HC (cm).
We considered 18 BIA-derived indicators and 22 MRI-derived indicators (16 indicators of body composition (BC) and six indicators of organ morphometry (OM)). A complete list of indicators measured or quantified can be found in Additional file 1: Tables S1.1 to S1.3. Detailed descriptions of the procedures of BIA and the MRI acquisition can be found on the study website [23, 24]. Briefly, BIA was conducted using Tanita BC418MA body composition analyser, generating BIA-derived indicators including whole body, trunk, arms, and legs fat mass, fat-free mass, and fat percentage. Abdominal MRI scans were performed using a Siemens Aera 1.5T scanner (Syngo MR D13) (Siemens, Erlangen, Germany). Different groups of acquisitions were analysed including Dixon protocol and high-resolution T1-weighted sequences to quantify the abdominal compositions and organ volumes [25].
MRI-derived indicators were quantified by two quantification pipelines provided by AMRA® Medical AB (Linköping, Sweden) and Calico (Calico Life Sciences LLC, South San Francisco, USA) with different priorities. AMRA® provides quantification of abdominal fat, muscle volume, and muscle fat infiltration of the thigh [16]. Calico provides organ-level quantification of abdominal organ morphometries including the size of lung, liver, left/right kidney, spleen, and pancreas [15]. Indicators generated by the two pipelines were treated as two subcategories termed body composition (BC) indicators and organ morphometry (OM) indicators.
Selection criteria and analyses populations
From the UKB imaging cohort (N = 49,403), we excluded participants with a history of CVDs (n = 4615), cancer (n = 4132), or T2D (n = 1831) at the time of imaging assessment. Among the remaining 40,338 participants, our main analysis focused on participants with complete anthropometric measurements across all measurement types, thus excluding those with missing BA indicators (n = 1356), BIA indicators (n = 2175), or MRI-derived indicators (n = 10,039). After these exclusions, the main analysis included 28,925 participants. Participants with missing information on socio-demographic or lifestyle factors were included in our analysis with missing values labelled accordingly to preserve statistical power.
In the baseline cohort used in a secondary analysis, similar exclusion criteria were applied. From the original 502,411 participants, we excluded those with prevalent CVDs, cancer, or T2D, leading to 441,236 participants without prevalent disease. We then excluded participants with missing BA (n = 2529) and BIA indicators (n = 11,699). After these exclusions, the secondary analysis included 429,294 participants. Detailed participant flow diagrams are provided in Additional file 1: Figs. S1 and S2.
Ascertainment of health-related outcomes
Mortality data were provided by NHS England and NHS Central Register for participants from England and Wales, for participants residing in Scotland were ascertained through National Death Registries. Incidence of primary CVDs and T2D were ascertained via linked hospital admission records. Inpatient hospital data were obtained through linked medical records, mapped across England, Scotland, and Wales using the Hospital Episode Statistics in England, Scottish Morbidity Record, and Patient Episode Database (for Wales). Primary cancer diagnoses were ascertained through linkage to cancer registries, with data provided by NHS Digital and Public Health England for participants from England and Wales, and by the NHS Central Register (NHSCR) for participants from Scotland.
Incident cases of CVDs, cancer, and T2D were identified based on ICD-10 coding (Additional file 1: Table S2). Following the definition of the European society of cardiology cardiovascular risk collaboration, CVDs events were defined as any cerebrovascular diseases (I61, I63, I64, I65, I66, I67.2–67.9, I68.1–68.9, I69), heart diseases (I20–I25, I48–I49, I50), and vascular diseases (I70–I73) [26]. Overall cancer was defined as any first primary malignant cancer, excluding non-melanoma skin cancer and in situ cancers. Obesity-related cancers were defined as meningioma (C70), multiple myeloma (C90), oesophagus adenocarcinoma (C15 with ICDO-3 code 8140/3, 8144/3, 8480/3, 8481/3, and 8490/3), and cancers of the thyroid (C73), postmenopausal breast (C50 and postmenopausal or aged over 55 at diagnosis), gallbladder (C23–C24), stomach (C16.0 cardia), liver (C22), pancreas (C25), kidney (C64), ovary (C56), uterus (C54–C55), colon and rectum (colorectal C18–C21) [27, 28]. T2D was defined as E11.
Statistical analysis
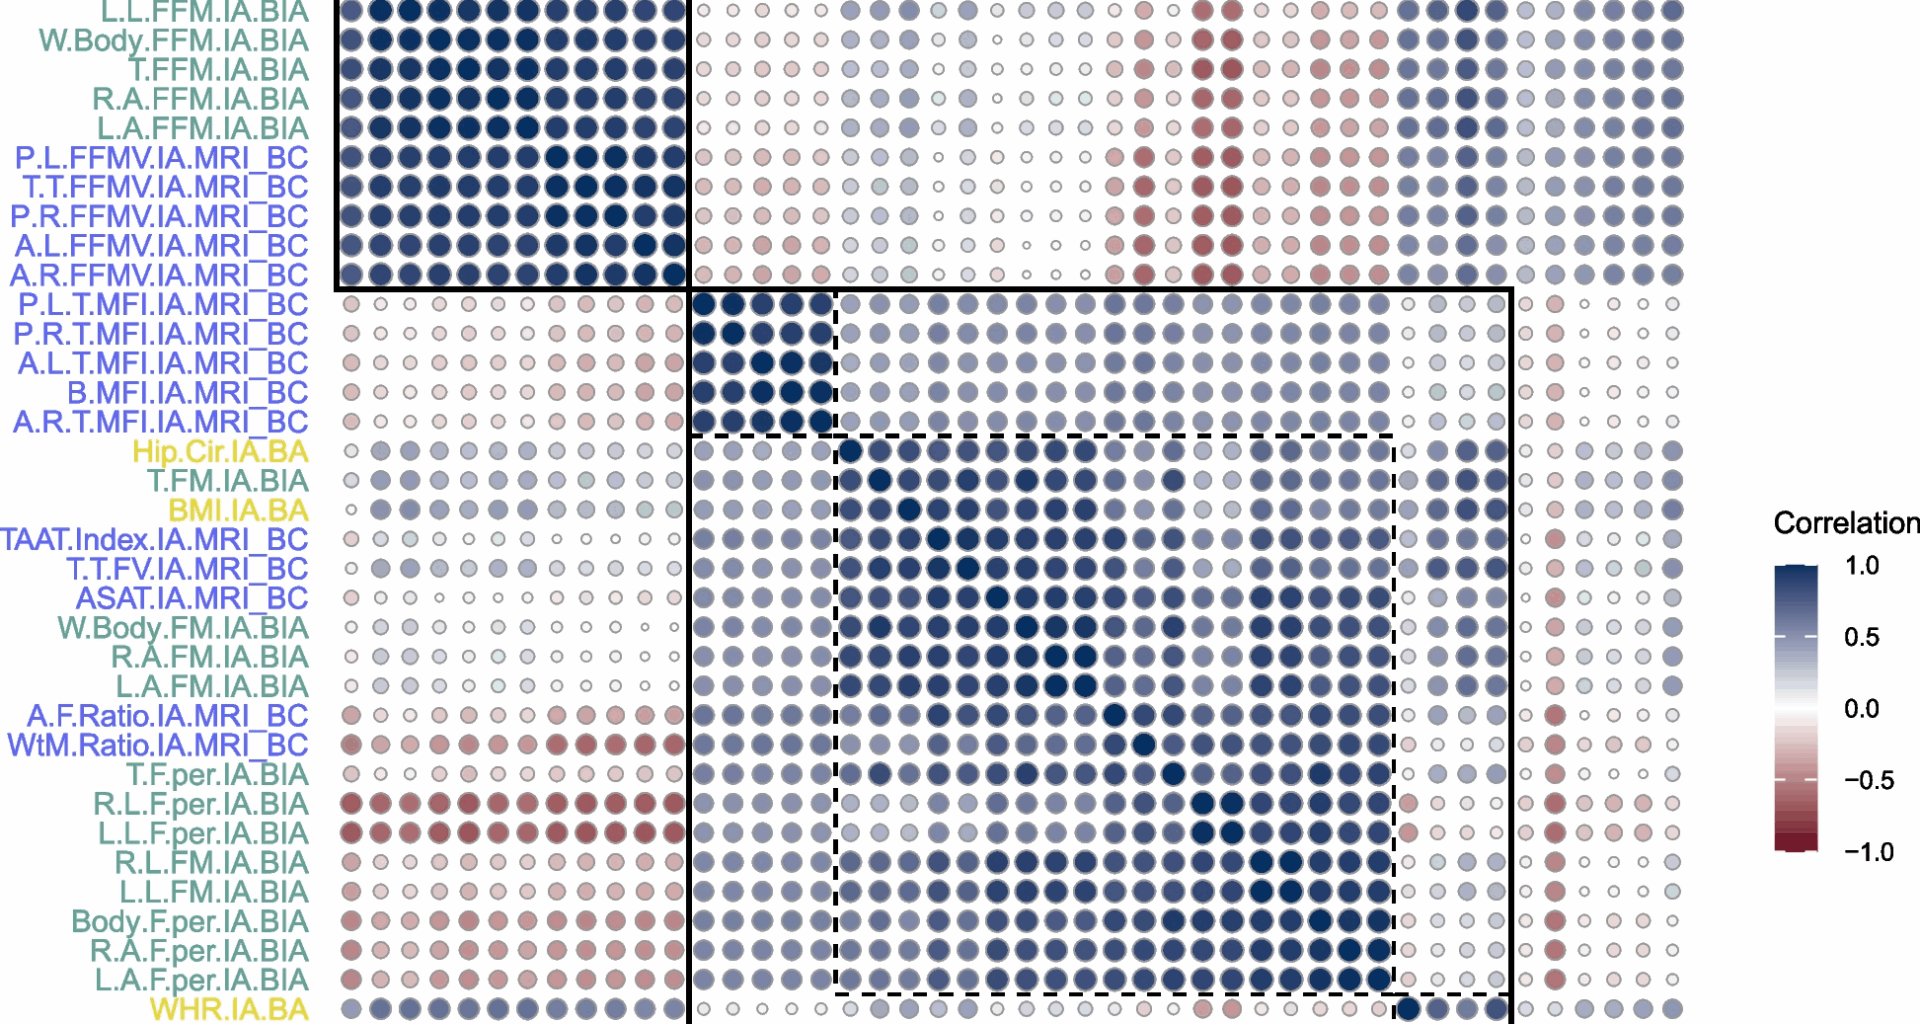
Descriptive statistics were presented as frequencies and percentages for categorical variables and means with standard deviations for continuous variables, stratified by health-related outcomes. Correlations between anthropometric indicators were assessed using Pearson correlation coefficients and visualised through a correlation matrix plot.
Cox proportional hazard models were employed for each of the five health-related outcomes with age as the time scale. The base model, labelled as socio-demographic and lifestyle information model (SLIM), included established risk factors coded as categorical variables: assessment centre, biological sex, self-reported ethnicity, education, diet score, physical activity, alcohol intake frequency, smoking status, and hypertension status as determined from blood pressure measurements (≥ 140/90 mmHg), clinical diagnoses (ICD-10 codes I10–I16 or self-reported), or antihypertensive medication use at assessment time, and, for women, menopausal status and ever use of hormone replacement therapy. Family history of a disease was included as an approximation of genetic predisposition to develop chronic diseases based on information on the father, mother, and siblings. Mortality models included family history of T2D, major CVDs (stroke or heart disease), and cancer of the prostate, breast, bowel, or lung; T2D models included family history of T2D; CVD models included family history of T2D and major CVDs and baseline measured blood lipids including low-density lipoprotein, high-density lipoprotein, and triglycerides; and cancer models included family history of cancer of the prostate, breast, bowel, or lung, as shown in Additional file 1: Table S3.
Next to SLIM models, we considered models that further included combinations of anthropometric indicators. In the imaging cohort (n = 28,925), nine expanded models were examined: SLIM + BA, SLIM + BIA, SLIM + BC, SLIM + OM, SLIM + BA + BIA, SLIM + BA + BC, SLIM + BA + OM, SLIM + BC + OM, and SLIM + BA + BC + OM. In the baseline cohort (n = 429,294), three expanded models were examined: SLIM + BA, SLIM + BIA, and SLIM + BA + BIA. Within each expanded model, we performed variable selection using forward stepwise selection with the Akaike information criterion (AIC) to identify the most informative anthropometric indicators. For each model, we used the tenfold cross-validated Harrell’s C-index as a measure of model discrimination. Specifically, the data were first divided into ten folds. In each iteration, nine folds were combined to form the training set, which was used for variable selection and model construction. Harrell’s C-index was then computed on the remaining fold, used as an independent test set, thus helping to prevent overfitting. The cross-validated C-index was calculated as the average across the 10 iterations. To compare model performance, we applied the DeLong test to pooled cross-validation predictions [29, 30], using predicted probabilities obtained for each participant when they were part of the test set during cross-validation. We focused on the comparison between the SLIM + BA model and models that included indicators from a single family of advanced anthropometric indicators (SLIM + BIA, SLIM + BC and SLIM + OM), as these directly address whether each measurement modality improves risk prediction. To correct for multiple comparisons, we applied a Bonferroni correction to account for 15 tests (3 model comparisons across 5 health outcomes).
Several sensitivity analyses were conducted. The tenfold cross-validated age-dependent area under the curve (AUC) at ages 65, 70, and 75 years was used to assess model discrimination as an alternative to Harrell’s C-index. Backward stepwise selection and/or the Bayesian information criterion (BIC) were used as an alternative to the forward stepwise selection based on the AIC. Possible nonlinear relationships between anthropometric indicators and health-related outcomes were considered using restricted cubic splines with five knots placed at the 5th, 27.5th, 50th, 72.5th, and 95th percentiles.
To evaluate the impact of missing data, we conducted sensitivity analyses using both complete-case and multiple imputation approaches. For complete-case analyses, we included participants with complete anthropometric indicators and socio-demographic and lifestyle information (total sample size in imaging cohort: n = 23,867, in baseline cohort: n = 333,802). We also implemented three strategies using multiple imputation by chained equations approach [31] in the imaging cohort: (1) imputing only missing socio-demographic and lifestyle variables (total sample size: n = 28,925), (2) additionally imputing missing BIA and MRI indicators (total sample size: n = 38,982), and (3) additionally imputing missing BA indicators (total sample size: n = 40,338). For each strategy, the imputation models incorporated lifestyle factors, anthropometric indicators, event indicators, and Nelson-Aalen estimator of the cumulative hazard of the five studied health outcomes computed at the time of event or censoring [32]. Ten imputed datasets were generated for each strategy. The tenfold cross-validated C-indices were computed for each imputed dataset and combined using Rubin’s rules [33]. Associations between selected anthropometric indicators and the five health-related outcomes were reported as hazard ratios (HR) with 95% confidence intervals (CI) per one standard deviation (SD). To address potential reverse causation, we also assessed associations after excluding the first 1 and 2 year(s) of follow-up. Additionally, we forced the inclusion of all BA variables that were selected in the baseline cohort into the imaging cohort models for each outcome, rather than relying on forward stepwise selection in the imaging cohort. Under this approach, comparing SLIM + BA with SLIM + BA + BIA, SLIM + BA + BC, SLIM + BA + OM, and SLIM + BA + BC + OM allowed us to evaluate whether BIA, BC, and OM indicators improved risk discrimination beyond the BA predictors selected in the baseline cohort.
All analyses were performed using R, version 4.1.2 (R Foundation for Statistical Computing, Vienna, Austria).