
Study design and population
The National Health and Nutrition Examination Survey (NHANES) is an ongoing cross-sectional study designed to assess the health and nutrition status of adults and children in the United States. The survey uses a complex multistage probability sampling, which enrolls a nationally representative sample of about 5,000 people each year. All data were obtained from standard questionnaires, physical examinations, and laboratory tests. The study has been approved by the institutional review board of the National Center for Health Statistics, and all participants provided written informed consent.
We included participants from NHANES 2007-2018 who underwent an assessment of a history of GDM and cardiometabolic diseases and had at least one live birth. Of these, we excluded participants who were currently pregnant. Additionally, those diagnosed with T2DM, hypertension, or CVD prior to GDM were also excluded to ensure temporal sequence and avoid confounding by pre-existing cardiometabolic diseases. Women with other underlying causes of hepatic steatosis, including those who consumed more than 14 drinks/week or tested positive for the hepatitis virus were further ruled out.
Exposures and covariates
Information on GDM was obtained from the reproductive health questionnaire. A history of GDM was determined by self-reporting whether they had diabetes during pregnancy. Participants with a history of GDM were further divided into early-onset (< 30 years) and late-onset (≥ 30 years) according to the median age of first onset of GDM.
Baseline demographic data, physical activity, smoking status, alcohol consumption, dietary intake, and pregnancy-labor history were evaluated through structured questionnaires. Smoking status was divided into never smokers (< 100 cigarettes in a lifetime), former smokers (≥ 100 cigarettes in a lifetime, but recently quit smoking), and current smokers (persistent smoking habits). Weekly alcohol consumption was assessed based on the number of drinking days per week, and the average daily alcohol consumption. Recreational physical activity was created as a binary binge indicator, with active recreational physical activity defined as walking or cycling trips, or moderate or vigorous recreational activities lasting at least 10 minutes per week. Body mass index (BMI) was calculated from the height and weight derived from physical examinations.
Definition of outcome
The primary outcome of the study was cardiovascular and metabolic morbidity. CVD included coronary heart disease (CHD), heart failure and stroke, which were obtained from the medical health questionnaire. Participants were identified as having CHD if they self-reported a diagnosis of major coronary heart disease events, angina, or heart attack.
Metabolic diseases including obesity, hyperlipidemia, T2DM, hypertension, MetS, and NAFLD were the outcomes of interest. Obesity was defined as a BMI greater than 30 kg/m2. Hyperlipidemia was assessed based on the ATP 3-NCEP criteria, which includes total cholesterol (TC) ≥ 200 mg/dL, triglycerides (TG) ≥ 150 mg/dL, high-density lipoprotein cholesterol (HDL-C) < 50 mg/dL, or low-density lipoprotein cholesterol (LDL-C) ≥ 130 mg/dL [13]. Participants were considered to have T2DM if they self-reported a diagnosis of diabetes, were currently taking insulin or glucose-lowering medication, had hemoglobin A1C >6.5%, fasting blood glucose (FBG) >125 mg/dL, or 2-h blood glucose ≥ 200 mg/dL. Hypertension was defined as a self-reported diagnosis of high blood pressure or a mean systolic/diastolic blood pressure of ≥ 140/90 mmHg at physical examination. MetS was defined according to the NCEP ATP III-2005 criteria for participants who met three or more of the following criteria: (1) elevated waist circumference (≥ 88 cm); (2) elevated blood pressure (≥ 130/85 mmHg or previously diagnosed hypertension); (3) decreased HDL-C (< 50 mg/dL); (4) elevated TG (≥ 150 mg/dL); (5) elevated FBG (≥ 100 mg/L or diagnosis of T2DM) [14]. Fatty liver index (FLI) ≥ 60 was used to diagnose NAFLD [15]. The FLI was calculated using physical measurements including BMI and waist circumference, as well as laboratory test results including TG and gamma-glutamyl transferase (GGT). The specific calculation method of FLI was described in the previous study [16].
Data sources for MR analysis
Summary statistics of GDM were extracted from the ninth release of the FinnGen study including 13,039 cases and 197,831 controls of the European population (Table S1). Strict selection criteria were used to obtain qualified IVs. Firstly, the significant SNPs strongly associated with GDM with a P value less than 5×10⁻⁸ were extracted as candidate IVs. Secondly, SNPs with linkage disequilibrium (r2 = 0.01 and kb = 10,000) or palindromic SNPs with intermediate allele frequencies were eliminated. Furthermore, we excluded SNPs that were not obtained in the outcome genome-wide association study (GWAS). F-statistic was used to assess the strength of IVs, and only strong IVs with F-statistic >10 were included in further analysis. Detailed information on genetic variations including SNP IDs, effect alleles, effect sizes, and F-statistics is displayed in Table S2. 17 SNPs strongly associated with GDM were used as IVs. Based on F-statistics (range 30 to 766), our findings were unlikely to be influenced by weak instrumental variables.
Genetic instruments for obesity (4,688 cases and 458,322 controls), hyperlipidemia (3,439 cases and 459,010 controls), and hypertension (119,731 cases and 343,202 controls) were extracted from the largest publicly available GWAS conducted by Elswort et al. T2DM were obtained from a meta-analysis of GWAS (62,892 cases and 596,424 controls) [17]. MetS was extracted from the most comprehensive collection of GWAS in the UK Biobank (UKB), comprising 59,677 cases and 231,430 controls of European ancestry [18]. The summary statistics for NAFLD were extracted from a genome-wide meta-analysis of 4 European ancestry cohorts, including 8,434 cases and 770,180 controls [19]. In addition, the summary statistics for CVD were obtained from the UKB consortium, comprising 177,923 cases and 306,675 controls [20]. The summary statistics data for CHD were obtained from the Coronary Artery Disease Genome-wide Replication and Meta-analysis (CARDIoGRAM) plus the Coronary Artery Disease (C4D) Genetics Consortium (CARDIoGRAMplusC4D), comprising 60,801cases and 123,504 controls [21]. The data on heart failure were extracted from the Heart Failure Molecular Epidemiology for Therapeutic Targets Consortium (HERMES), which consisted of 47,309 cases and 930,014 controls from 26 cohorts [22]. Summary-level data of stroke were obtained from MEGASTROKE consortium, including 40,585 cases and 406,111 controls [23]. The sources of datasets are shown in Table S1.
Statistical analysis
Sample weights, strata, and primary sampling units were incorporated in the analysis due to the complex sample design of NHANES. Continuous variables were presented in the form of means and standard deviations (SD) or medians and interquartile ranges (IQR) depending on the distribution, while categorical parameters were presented as number (N) and percentage (%). For descriptive statistics, t-tests or Mann-Whitney tests were used for continuous variables and Chi-square tests were used for categorical variables. Survey-weighted logistic regression analysis was performed to estimate the odds ratios (OR) and 95% confidence interval (CI) to investigate the association between the history of GDM, the onset age of GDM and the risk of cardiometabolic diseases. A multinomial logistic regression analysis was used to investigate the relationship between the history of GDM and cardiometabolic disease comorbidities. We also conducted a sensitivity analysis by excluding those women with BMI >40 kg/m2. Model 1 was adjusted for age, and race; Model 2 was further adjusted for BMI, educational level, income, parity, alcohol consumption, smoking status, physical activity, energy intake, and age at first birth. For obesity, the covariates adjusted in model 2 did not include BMI. For CVD, we also accounted for additional adjustments for hyperlipidemia, T2DM, hypertension, MetS, and NAFLD in model 2. In addition, mediation analysis was used to explore the mediating role of metabolic diseases (including obesity, hyperlipidemia, T2DM, hypertension, MetS, and NAFLD) in the association of the history of GDM with CVD risk. In this analysis, we adjusted for the same covariates as the multivariable regression models. A parameter regression approach was used to estimate the total effect, including both the indirect effect and the direct effect of GDM on CVD risk. The coefficients were estimated from 1000-replication bootstrap [24]. The mediation analysis was conducted using the R package “mediation”.
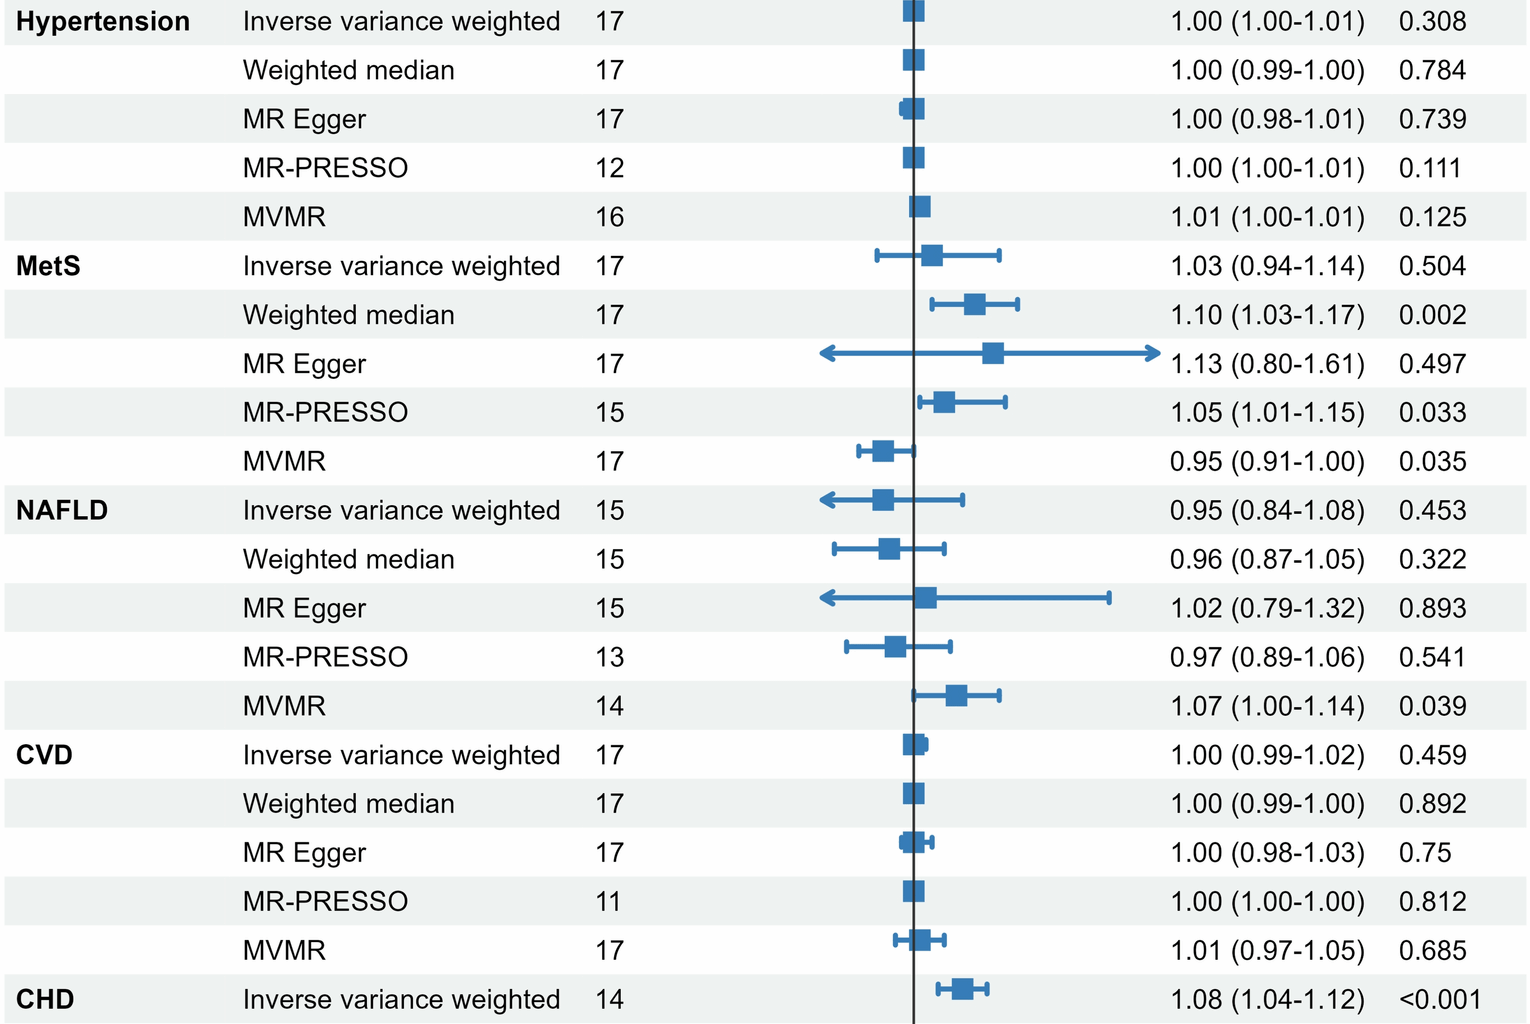
The two-sample MR analysis was performed to evaluate the potential causal effects of GDM on cardiometabolic events. Inverse-variance weighted (IVW) method that provides unbiased causal estimates in the absence of horizontal pleiotropy and heterogeneity was used as the primary method [25]. In addition, three complementary MR methods, including the weighted median method, MR Egger method and MR-pleiotropy residual sum and outlier (MR-PRESSO) method were employed as sensitivity analyses [26,27,28]. The weighted median method could provide robust estimates even when most IVs were invalid. Heterogeneity among genetic variants was assessed using Cochran’s Q statistic. Potential directional pleiotropy was evaluated with MR-Egger regression, where a non-zero intercept indicates pleiotropic bias and the slope offers a pleiotropy-adjusted causal estimate. Furthermore, the MR-PRESSO method was employed to detect and correct for horizontal pleiotropy through a global test, with outlier variants removed to derive refined causal estimates. Considering that BMI is strongly linked to the development of outcomes, we conducted multivariate MR (MVMR) analyses to assess the causal effect of GDM on cardiometabolic diseases independent of BMI [29]. Metabolic diseases with a significant causal relationship were included as mediators in subsequent mediation analyses. In this study, we used a two-step MR method to analyze the mediating role of T2DM in the association of GDM and CHD. All analyses were performed using R software version 4.2.1, with a P value < 0.05 considered statistically significant.