
Study design
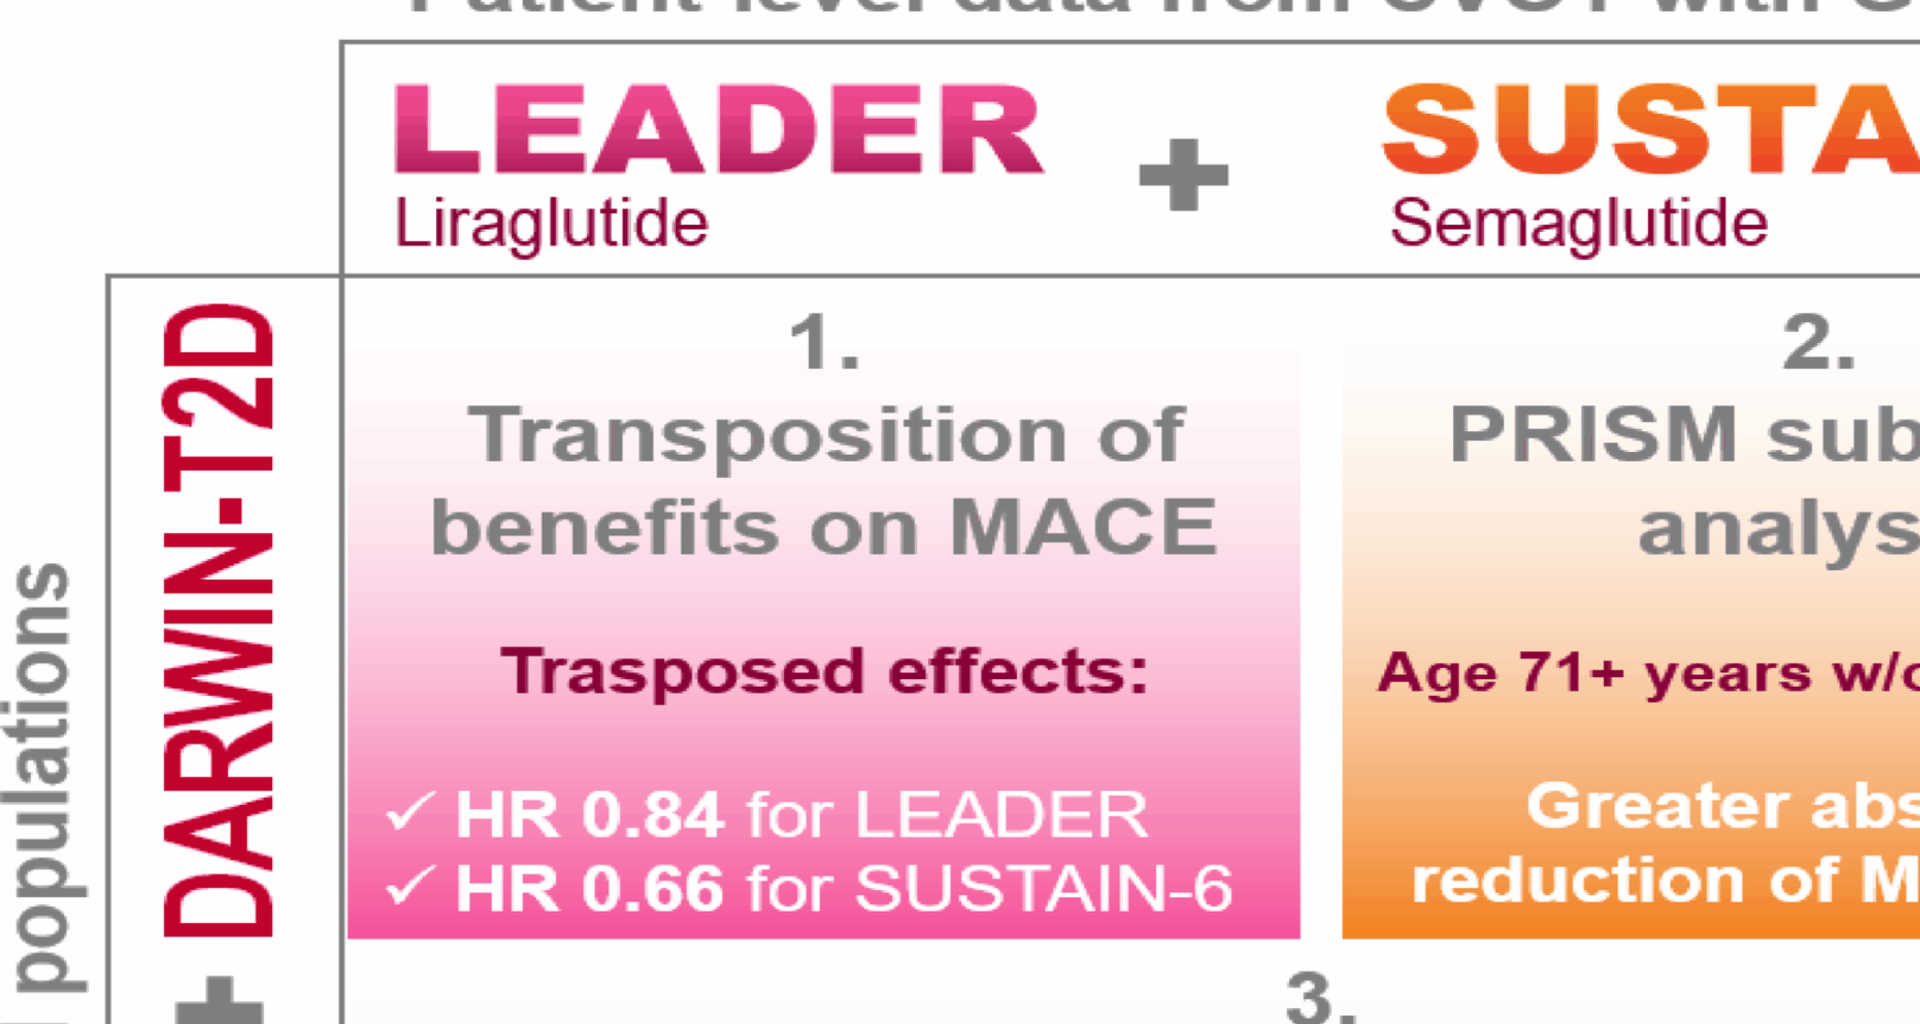
We collected individual patient-level data from the LEADER [7] and SUSTAIN-6 [8] CVOTs as well as from the DARWIN-T2D real world study (RWS) [9]. As summarized in Fig. S1A, after excluding patients with missing data for covariates in the RWS, we combined information from the two CVOTs with those of the RWS population (LEADER + DARWIN-T2D and SUSTAIN-6 + DARWIN-T2D). We modelled dependencies among variables in the combined populations and estimated appropriate weights for LEADER or SUSTAIN-6 participants. Parametric and non-parametric (i.e. Bayesian) models were used to estimate weights (as detailed in the Appendix). Such weights were then used to estimate the treatment effect of liraglutide or semaglutide transposed to the target population [4].
After evaluating the overall transferability of results from CVOTs to the target population, we assessed whether it was possible to identify subgroups of subjects in the RWS with greater benefit from treatment with GLP-1RA (Fig. S1B). To this end, we combined datasets from LEADER and SUSTAIN-6 and, after defining training and test sets, a machine learning approach was used to identify variables that modified the response to treatment in terms of the risk of MACE. These were validated on a test set and applied to the RWS to compute the proportions of individuals with T2D in the real-world population in each subgroup. Further external validation was performed in a longitudinal database previously used to test cardiovascular effectiveness of GLP-1RA [10, 11].
Study populations
The LEADER (n = 9340) and SUSTAIN-6 (n = 3297) included patients with T2D aged 50 years or more and established CVD or aged 60 years or more and at least one additional cardiovascular risk factor [7]. After excluding participants with missing information on key variables of interest, our study included 8758 patients from the LEADER study and 3227 patients from SUSTAIN-6 study.
DARWIN-T2D was a retrospective multicenter study collecting data from 46 diabetes specialist outpatient clinics in Italy [12, 13]. The study recorded cross-sectional data on all patients with T2D aged 18 years or older at their last available visit, yielding to a population of ~ 281,000 patients, evaluated between 2015 and 2016. This is estimated to represent about 20% of the entire population of individuals with T2D attending diabetes clinics in Italy (note that only diabetes clinics and not GPs were authorized to prescribe GLP-1RA at that time [14]). Data on demographics, anthropometrics, risk factors, laboratory values, complications, and medications were collected. After exclusion of participants with missing information on key variables of interest, the present analysis included 72,736 individuals. The study was conducted according to the principles of the Declaration of Helsinki and approved by ethics committees at all participating centers. Patients’ informed consent was waived based on national regulations on retrospective studies with anonymous data.
External validation cohort
We performed an external validation of the cardiovascular response to GLP-1RA in subgroups, using the administrative claims database of the Veneto Region [10, 11]. We employed two previous studies conducted by our group testing the cardiovascular effectiveness of GLP-1RA compared to DPP4i [10] or basal insulin [11]. These comparators are known to have neutral effects on MACE [15, 16]. As previously described, the Health Information Exchange system, covering a population of about 5 million inhabitants (330,193 with diabetes) was used to identify new users of GLP-1RA (exenatide, liraglutide, lixisenatide, dulaglutide), DPP-4i (sitagliptin, vildagliptin, alogliptin, linagliptin, saxagliptin) or basal insulins (detemir, glargine, degludec) from 2011 to 2018. To develop a pseudo-randomization approach, several clinical variables were used to obtain two propensity score matched (PSM) cohorts of new-users of GLP-1RA or active comparators.
Outcomes
The primary outcome was the first occurrence of 3-point MACE (3P-MACE) as specified in the LEADER and SUSTAIN-6 study protocols (i.e. a composite outcome of non-fatal myocardial infarction or stroke and cardiovascular mortality). In the real-world longitudinal cohort, due to the lack of information on causes of death, we used a modified version of the 3P-MACE, including overall mortality instead of cardiovascular mortality, with cardiovascular mortality expected to cause 70% of overall mortality in people with T2D [17].
Transposition analysis
To test the real-world validity of the treatment effect estimates obtained in the clinical trials, we applied weighted proportional hazards Cox regression analyses, using inverse odds of sampling weights as proposed by Westreich [18]. Further details are given in the Appendix.
Identification of subgroups with different treatment response
The training set was constructed by randomly selecting 70% of patients enrolled in LEADER and 70% of patients enrolled in SUSTAIN. The remaining 30% of LEADER and 30% of SUSTAIN participants were included in the test set.
To identify subgroups with different responses to treatment, we applied the statistical framework of the Patient Response Identifiers for Stratified Medicine (PRISM) tool, using the default ML algorithm for survival outcomes. Further details on the five steps of PRISM are given in the Appendix. Briefly the PRISM framework uses a multi-step ML approach: first, deriving a multivariable risk model for the outcome under control conditions; second, applying interaction modelling to detect key baseline modifiers of treatment benefit, selected through regularized regression (elastic net).
The overall clinical benefit of treatment in different groups was tested in the entire cohort of LEADER + SUSTAIN-6 with a Cox proportional hazard model including a covariate for trial identification. Sensitivity analyses were performed to account for possible imbalances of randomization in each subgroup (defined by a SMD >0.1 and p-value < 0.05). Predicted survival probability and number needed to treat (NNT) based on absolute risk reduction (NNT-ARR) were estimated according to Austin et al. [19, 20], at the time point closest to the median follow-up of RCTs (i.e. 3.6 years). Confidence intervals and standard errors for ARR were obtained with bootstrapping (1000 sampling with replacement). Quantitative absolute scale interactions were tested according to Gail and Simon methods [21].
Transferability and heterogeneity of treatment response were assessed using the following variables: age, sex, BMI, duration of diabetes, baseline HbA1c, history of CVD, history of HF, history of MI and stroke, hypertension, peripheral artery disease, eGFR and medications (metformin, sulphonylurea, thiazolidinediones, DPP4 inhibitors, RAS blockers, calcium channel blockers, beta blockers, diuretics, antiplatelet treatment, and statins). Urinary albumin/creatinine ratio (UACR) was used in the analyses specific to the LEADER study and not in SUSTAIN-6 due to high missingness (18%).
External validation
The analyses were conducted following the same approach, combining the populations described in original studies [10, 11]. The balance between new-users of GLP-1RA and comparators (DPP-4i or basal insulin) was obtained with PSM, using the nearest neighbor method and the logit distance. The PS was estimated from the following variables: age, sex, claims-based history length, diabetes duration, presence of CV risk factors (dyslipidemia and hypertension), pre-existing vascular conditions (i.e. peripheral circulatory complications, myocardial infarction, ischemic heart disease, stroke or TIA, heart failure, cardiovascular disease), complications (i.e. neurological complications, ocular complications, renal complications, chronic kidney disease, severe hypoglycemia) and other conditions (cancer, chronic pulmonary disease, systemic inflammatory disease, Charlson comorbidity index), detailed information on glucose-lowering medications and other drugs. The PSM was originally built in two steps, GLP-1RA vs. DPP-4i and GLP-1RA vs. basal-insulin and it was possible for subjects to be included in the two studies (matching with replacement). The balance was assessed by evaluating the standardized mean difference (SMD) and good balance was defined as a SMD < 0.10. The association between GLP-1RA use and 3P-MACE was assessed with Cox regression models including an indicator for comparisons with DPP-4i or basal insulin. In subgroup analyses, the balance was verified and the main model was eventually adjusted for variables showing imbalance in the various strata. ARR and NNT were estimated as done for the CVOTs.
Statistical analysis
Continuous variables are described as mean and standard deviations (SD). Categorical variables are presented as frequencies and percentages. Differences between groups for each variable were analyzed using t-test or chi-square for continuous or categorical variables, respectively. All records with at least one missing information were deleted from the analyses, as we applied a complete case scenario. The level of significance was set at 0.05, unless otherwise specified. All statistical analyses were performed using R version 4.2.1 and SAS v 9.4.