
Collection of plant samples
A total of ten plants were collected from the Orman Botanical Garden (30°01′45.12″ N, 31°12′47.16″ E) and the Research Institute of Plant Protection (30.046356° N, 31.207320° E), Giza, Egypt, in February 2023, and were included in this study. They comprised three ornamental and seven medicinal plants (Table 1). The collection was conducted with prior permission from the relevant authorities at both institutions and in accordance with national regulations governing plant material collection. Plant species were identified by expert botanists at the Research Institute of Plant Protection. Specimens of plants parts, including leaves, roots, and stems, were collected and transferred into sterile bags for laboratory analysis. All the plant species used in this study were not endangered or protected species.
Table 1 Endophytic and epiphytic bacterial isolates from the tested ornamental and medicinal plantsIsolation of endophytic bacteria
The plant’s leaves, stems, and roots were carefully rinsed with running water to remove dirt and then allowed to air dry. The plant parts were surface sterilized [31]. Briefly, the samples were immersed in 70% (v/v) ethanol for 2 min, subjected to multiple rinses with sterilized water, dipped in a 0.25% sodium hypochlorite solution for 1 min, and subsequently rinsed again with sterilized water for 3–5 times. The samples were then aseptically cut into small segments using a sterilized sharp blade and placed onto Luria-Bertani (LB, Biomark, India) agar plates. The plates were incubated at 30 °C for 48 h to promote the growth of endophytic bacteria. Controls included culturing the last washing water to ensure the inhibition of epiphytes, while negative control included non-inoculated LB plates to ensure the sterility of the media. Single colonies were isolated and inoculated onto fresh LB agar media. Each culture was checked to confirm its purity, and the confirmed pure endophytes were maintained in LB broth with 20% glycerol at − 80 °C [32].
Isolation of epiphytic bacteria
The healthy roots, leaves, and stems were washed and soaked in sterile 0.9% NaCl maintained at 37 °C under shaking conditions for 1 h. Serial dilutions with a tenfold dilution ranged from 10⁻1 to 10 −7 in sterile 0.9% NaCl. Then, 0.1 ml from each dilution was inoculated on LB agar plates, and the plates were incubated at 30 °C for 2 days [33]. The purified epiphytes were stored in LB broth with 20% glycerol at − 80 °C [32].
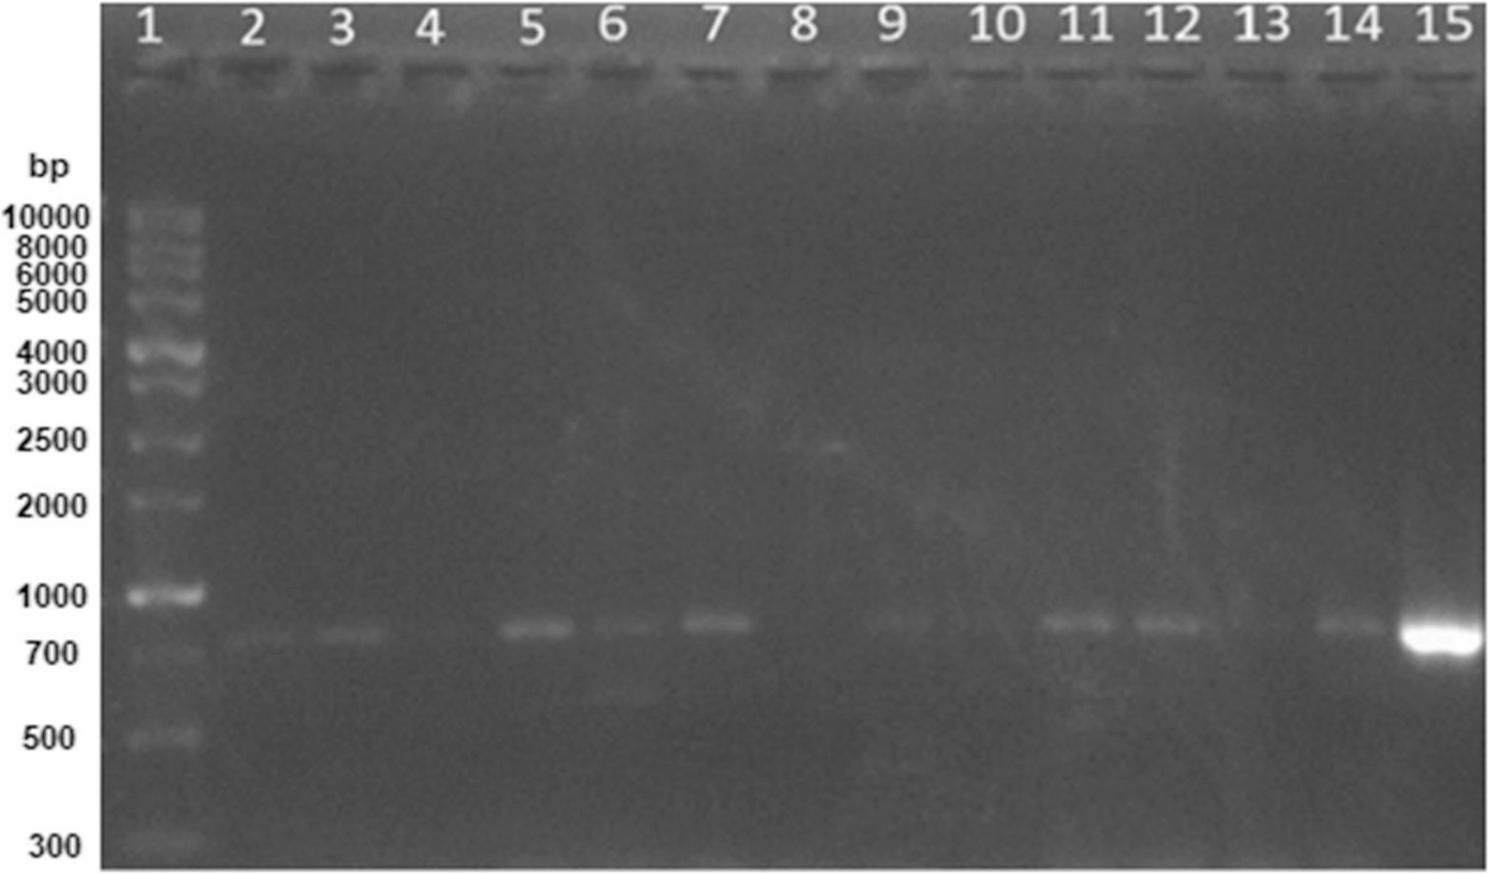
PCR screening for AHL-lactonase gene
DNA extraction from each bacterial isolate was performed using the QIAamp DNA Mini Kit (Qiagen, Germany), according to the manufacturer’s instructions. The presence of the lactonase gene (aiiA) in all bacterial isolates was screened through PCR, using the PCR master mix 2x FastTeq Premix (ToloBio, China) and aiiA primer pairs: aiiA-F2 (5′-CGGAATTCATGACAGTAAAGAAGCTTTA-3′) and aiiA-R2 (5′-CGCTCGAGTATATATTCAGGGAACACTT-3′) [20]. Lactonase-producing Bacillus weihenstephanensis P65 isolate was used as a positive control [34]. The cycling conditions were as follows: initial denaturation at 94 °C for 5 min, 5 cycles of 94 °C (45 s), 44 °C (45 s), 72 °C (1 min); 30 cycles of 94 °C (45 s), 53 °C (45 s), 72 °C (1 min), followed by final extension at 72 °C for 8 min [35]. The resulting PCR amplicons were examined by electrophoresis on 1.2% agarose gels [36].
Preparation of bacterial cell-free supernatants
The bacterial cell-free supernatants (CFSs) were prepared from aiiA-positive bacterial isolates according to Ayyappan et al. (2022) with modifications. In summary, a single colony was introduced into a 250 mL Erlenmeyer flask containing 50 mL LB broth and incubated at 37 °C with shaking at 180 rpm for 24 h. The culture was then adjusted to an optical density of 600 nm (OD₆₀₀ = 1.0) and used as a 2% (v/v) inoculum in 250 mL double-strength LB broth in a 1 L Erlenmeyer flask, followed by incubation at 37 °C with shaking at 200 rpm for 48 h. The centrifugation of cultures was performed at 10,000 rpm for 30 min at 4 °C, and supernatants were filter-sterilized through 0.22 μm filters before storage at −20 °C [37]. The Bradford assay was employed to determine protein concentration, with bovine serum albumin used for standardization [38].
Screening for a quorum quenching enzymatic activity using the agar well diffusion assay
The AHL inactivation assay was performed using the agar well diffusion technique with Agrobacterium tumefaciens (A. tumefaciens) KYC55 as reporter strain. The assay was conducted according to the method of Raafat et al. (2019) with some modifications [30]. Briefly, 1 mL of an overnight culture of A. tumefaciens KYC55 was inoculated into 50 mL of minimal medium supplemented with 100 µg/mL Gentamycin (Sigma- Aldrich), 4 µg/mL Tetracycline (Sigma- Aldrich), and 100 µg/mL Spectinomycin (Cayman, USA) and incubated overnight at 28–30 °C with shaking at 160 rpm. The prepared culture was mixed with 50 mL molten LB agar containing 1.2% agar, at 46 °C to prevent killing the used bacteria, and supplemented with the same antibiotics and 60 µg/mL X-Gal (Titan biotech ltd.) [39]. Twenty milliliters of the prepared agar culture were transferred into sterile petri dishes, and after solidification, wells of 10 mm diameter were bored into the medium. Fifty microliters of CFSs from aiiA positive isolates were incubated for 3 h with 50 µM N-hexanoyl-L-homoserine lactone (C6-HSL; Cayman, USA). After incubation, the enzymatic activity was terminated by heating the mixture at 95 °C for 10 min. Then, 50 µL of the reaction mixture was added per well. The positive control consisted of 50 µL of 50 µM C6-HSL, while 50 µL phosphate-buffered saline (PBS) served as the negative control. The plates were maintained at 28–30 °C for 12–18 h, after which the wells were examined for blue zones. A persistent blue zone confirms intact C6-HSL, whereas reduction or clearing around wells demonstrates AHL degradation.
Confirmation of a lactonase degradation activity by the acidification test
Fifty microliters of CFSs from the isolates showing a clear or reduced blue zone around the wells in the agar well diffusion assay were incubated for 3 h with C6-HSL (50 µM). Then, 100 µL of 0.2 M HCl was added to acidify the reaction, and it was incubated overnight at 30 °C [27]. Fifty microliters of the acidified reaction were added to each well of the prepared agar culture. Fifty microliters of 50 µM C6-HSL and PBS were used as positive and negative controls, respectively, as previously described in the agar well diffusion assay. The plates were incubated at 28–30 °C for 12–18 h. The appearance of a blue zone indicates that the activity is due to a lactonase rather than an acylase enzyme, as the hydrolysis of the HSL ring by AHL-lactonase is a reversible process.
Determination of the minimum inhibitory concentration of the prepared cell free supernatants against P. aeruginosa
The minimum inhibitory concentration (MIC) of crude (CFS) from the aiiA positive isolates against P. aeruginosa PAO1 and 10 MDR P. aeruginosa clinical isolates (P1-P10) was determined by the broth microdilution method [40]. All the MDR P. aeruginosa clinical isolates were from the culture collection of the Department of Microbiology and Immunology, Faculty of Pharmacy, Cairo University. Twofold serial dilutions of CFSs, starting at a concentration of 4 mg/mL, were prepared in LB medium. Subsequently, each well of a 96-well plate received 10 µL of the adjusted culture to achieve a final inoculum of approximately 5 × 10⁵ CFU/mL. Then the plates were incubated at 37 °C for 18 ± 2 h. Both positive and negative controls were included to ensure assay validity. The MIC value was defined as the lowest concentration of CFS that effectively suppressed visible bacterial growth. Triplicate measurements were obtained for all experimental conditions to confirm reproducibility.
Screening the anti-virulence activity of the CFS of aiiA-positive isolates against P. aeruginosa PAO1Anti-biofilm activity
The anti-biofilm effectiveness of CFS against P. aeruginosa PAO1 was evaluated using a static microtiter plate assay, following the methods described by Cady et al. (2012), with minor modifications [41]. P. aeruginosa PAO1 was grown in LB broth for 18 h at 37 °C with shaking at 180 rpm. The overnight culture was adjusted to approximately 1.5 × 10⁷ CFU/mL in LB medium. Then, 100 µL of the adjusted culture was mixed with 100 µL of the tested CFS (at a sub-inhibitory concentration) in a 96-well microtiter plate. Positive and negative controls were included, and the plate was kept at 37 °C for 18 h without agitation. The planktonic cells were transferred to a new microtiter plate, and the OD₆₀₀ was measured using a microtiter plate reader (ELISA microplate reader; BioTek, USA). Wells were washed three times with 150 µL of PBS. The formed biofilms were detected by staining with 100 µL of 0.1% (w/v) crystal violet (Alpha Chemika, India), followed by incubation for 15 min at room temperature and washing four times with PBS. Then 100 µL of ethanol (95%) was added to solubilize the crystal violet, transferred into a new microtiter plate, and the absorbance was measured at 595 nm. The assay was performed in triplicate. The ratio of OD 595/OD 600 was used to normalize the amount of biofilm formed to the growth of bacteria in the presence and absence of the enzyme. Then, the percentage of biofilm formation inhibition was calculated as follows [42]:
$$\begin{aligned}\mathrm{Biofilm}\;\mathrm{formation}\;\mathrm{inhibition}\;\%&=\mathrm{OD}595\;\mathrm{of}\;\mathrm{control}\;\\&-\mathrm{OD}595\;\mathrm{of}\;\mathrm{treated}/\mathrm{OD}595\;\mathrm{of}\;\mathrm{control}\;\\&\times100\end{aligned}$$
Swarming motility inhibition assay
Briefly, a 5 mL culture of P. aeruginosa PAO1 in Tryptic Soy Broth (TSB; Oxoid, UK) was incubated overnight at 37 °C with shaking at 180 rpm [43]. The culture was adjusted to 0.5 McFarland. Plates for swarming were prepared as follows: TSB media containing 0.5% agar were supplemented with 1 mg/mL of the crude enzyme (sub-inhibitory concentration). Then, 15–20 mL was poured into each petri dish [44]. Dried swarming agar plates were inoculated at the center with 10 µL of the adjusted P. aeruginosa PAO1 culture and incubated for 48 h [45]. Control plates without lactonase enzymes were included. The swarming behavior was assessed by observing the plates and measuring the diameter of the motility zone. The test was performed in triplicate. The percentage inhibition of motility was calculated as follows [42]:
$$\begin{aligned}\mathrm{Motility}\;\mathrm{Inhibition}\;\%=&\left[\left(\mathrm{motility}\;\mathrm{area}\;\mathrm{of}\;\mathrm{control}\;\right.\right.\\& \left.\left.-\mathrm{motility}\;\mathrm{area}\;\mathrm{of}\;\mathrm{treated}\right)\right.\\& \left. /\mathrm{motility}\;\mathrm{area}\;\mathrm{of}\;\mathrm{control}\right]\times100\end{aligned}$$
Pyocyanin production inhibition assay
Briefly, 5 mL of the overnight P. aeruginosa PAO1 cultures adjusted to a 0.5 McFarland were treated with 1 mg/mL of crude enzyme (CFS). A control culture without enzyme was included. All bacterial cultures were maintained at 37 °C for 48 h. After incubation, the bacterial culture was centrifuged at 8,000 rpm for 10 min to pellet the cells. The supernatant containing pyocyanin was subsequently extracted with 3 mL of chloroform, followed by back extraction into 1 mL of 0.2 M HCl, resulting in a pinkish-red solution. The test was repeated in triplicate. The amount of pyocyanin was measured spectrophotometrically by recording the OD at 520 nm [10]. The percentage inhibition of pyocyanin production was calculated using the formula:
\(\begin{aligned}&\mathrm{Inhibition}\;\mathrm{of}\;\mathrm{pyocyanin}\;\mathrm{production}\;\\&\left(\%\right)=\left[\left(\mathrm{AC}-\mathrm{At}\right)/\mathrm{AC}\right]\times100\end{aligned}\), where AC is the OD of the control culture and At denotes the OD of the treated culture [42].
Preparation of PP-Lactonase enzyme
Partial enzyme purification was performed using ammonium sulfate precipitation, as described by Rajesh et al. (2015), with slight modifications [46]. In summary, the protein content in 1000 mL of CFS was precipitated using solid ammonium sulfate at concentrations ranging from 50% to 80% with stirring overnight at 4 °C. The resulting precipitate was collected by centrifugation at 18,000 rpm for 30 min at 4 °C. The 0.05 M Tris-HCl buffer (pH 7.5) was utilized to dissolve the pellets, followed by dialysis in a dialysis tube with a molecular weight cut-off of 13,000 Da against 250 mL of the same buffer, and stirring overnight at 4 °C. The solution was filtered through a 0.22 μm cellulose acetate syringe filter, and the protein content was determined using the Bradford reagent and adjusted to 1 mg/mL. The agar well diffusion assay was performed to confirm activity, as mentioned before. To select the optimum ammonium sulfate concentration for partial purification of lactonase, Sodium Dodecyl Sulfate Polyacrylamide Gel Electrophoresis (SDS-PAGE) was performed using a 12.5% polyacrylamide gel following the method of Laemmli in 1970 [47]. A standard molecular weight protein marker (Genetix Biotech Asia Pvt. Ltd., New Delhi, India) was used.
Determination of the minimum inhibitory concentration of PP-Lactonases and assessment of the anti-virulence activity againstPseudomonas aeruginosa
The MIC of the PP-Lactonases from selected aiiA positive isolates was determined against P. aeruginosa PAO1 and the 10 MDR P. aeruginosa clinical isolates using the broth microdilution method, as described earlier [40]. All the tested clinical isolates produced pyocyanin, showed swarming motility, and were moderate to strong biofilm producers.
PP-Lactonase was evaluated for its ability to inhibit biofilm formation, swarming motility, and pyocyanin production in P. aeruginosa PAO1 and the tested clinical isolates at a sub-inhibitory concentration, following the same methodology previously described for the crude enzyme.
Furthermore, the alteration of P. aeruginosa PAO1 biofilm structure by the CFS and PP-lactonase of the selected isolate, showing promising anti-virulence activity was examined using scanning electron microscopy (SEM) (Zeiss EVO 15, Germany). Biofilms of P. aeruginosa PAO1 and P. aeruginosa PAO1 treated with either CFS or PP-Lactonase were grown in 8-well chambered cover slides for 24 h, gently rinsed with phosphate buffer, and fixed with glutaraldehyde. The fixed samples were dehydrated using ethanol, sputter-coated with gold, and observed using SEM [48].
Molecular identification of the most promising anti-virulence Lactonase-producing isolate and its aiiA gene
The bacterial isolate with the highest anti-virulent activity was identified through sequencing of its 16S rRNA gene. Genomic DNA was extracted by the QIAamp DNA Mini Kit (Qiagen, Germany) according to the manufacturer’s instructions. PCR was performed using the PCR master mix 2x FastTeq Premix (ToloBio, China) and the universal primers 27 F: (5′-AGA GTT TGA TCC TGG CTC AG-3′) and 1492R (5′-ACG GCT ACC TTG TTA CGC TT-3 [35]. The PCR conditions included an initial denaturation at 94 °C for 4 min, followed by 35 cycles of 94 °C for 45 s, 54 °C for 45 s, and 72 °C for 1 min, and a final extension of 72 °C for 8 min. The aiiA gene of the promising isolate was also amplified by PCR using aiiA primers as previously mentioned.
The PCR products of the amplified 16S rRNA and aiiA genes were purified using a QIAquick PCR purification kit (Qiagen, Germany). The purified PCR products were sequenced by the Sanger’s method using a 3500 Genetic Analyzer at Clinilab, Cairo, Egypt.
The 16S rRNA DNA sequence was analyzed using NCBI’s BLASTn tool to identify closely related sequences, and the identified isolate’s sequence was deposited in GenBank. Sequences with high similarity were retrieved from the NCBI database and used for phylogenetic analysis. The aiiA gene sequence was translated using the Expert Protein Analysis System (ExPASy) tool, and the resulting lactonase amino acid sequence was also deposited in GenBank. Multiple sequence alignments of the lactonase with homologous AHL lactonases from the NCBI database were performed. Phylogenetic trees were generated using the neighbor-joining method with 1000 bootstrap replicates in MEGA version 11.0 [49].
Identification of the PP-Lactonase enzyme using liquid chromatography-mass spectrometry
The protein sample was prepared and digested according to standard procedures [50]. The peptide band was sent to the Children Cancer Hospital Foundation 57357 Basic Research Department, Proteomics and Metabolomics research program, Cairo, Egypt, for liquid chromatography-mass spectrometry (LC-MS) analysis [50]. Briefly, the SDS-PAGE band corresponding to ~ 28 kDa was excised, destained, and treated with a fixation solution comprised of 50% methanol and 12% acetic acid. Subsequently, gel fragments underwent three 15-minute washes with 200 µL of 50 mM ammonium bicarbonate (ABC) and 50% acetonitrile (ACN) on a shaker. The pieces were vacuum-dried until they appeared shrunk and white. For reduction, 10 mM dithiothreitol (DTT) was added, and the samples were incubated at 60 °C for 30 min. Alkylation was carried out using 55 mM iodoacetamide (IAA) in the dark for 30 min. The pieces were then washed, dehydrated with ACN, and vacuum-dried.
For trypsin digestion, 50 µL of trypsin (10 ng/µL) was added to the gel and incubated overnight at 37 °C with shaking at 600 rpm. Peptides were extracted by adding 80 µL of an ACN: MilliQ water: formic acid (66:33:1) solution, shaking for 5 min twice. The peptide extracts were collected, and the solvent was evaporated using a SpeedVac. The final peptides were reconstituted in 25 µL of 0.2% formic acid (FA). LC-MS analysis was conducted on an Eksigent nanoLC 400 autosampler interfaced with an Ekspert nanoLC 425 pump and a Sciex TripleTOF 5600 + mass spectrometer (SCIEX, Canada). A 10 µL peptide sample was injected, and the peptides were trapped on a CHROMXP C18CL 5 μm (10 × 0.5 mm) (SCIEX, Canada) cartridge at a flow rate of 10 µL/min using mobile phase A (LC-MS water containing 0.1% FA) for 3 min. The peptides were eluted using a gradient of mobile phase B (acetonitrile containing 0.1% formic acid) from 3% to 80% over 45 min at a flow rate of 5 µL/min. The analytical column was a 3 μm ChromXP C18CL, 120 Å, 150 × 0.3 mm column (SCIEX, Canada). Mass spectrometry was operated in positive ion mode, with high-resolution time-of-flight (TOF) MS scans followed by product ion scans of the 40 most intense precursor ions in a cycle time of 1.5 s. The TOF mass range was set to 400–1250 m/z, and the MS2 product ion range was from 170 to 1500 m/z. The ion selection threshold was 150 counts per second (cps), and the source voltage was maintained at 5500 V, with a curtain gas pressure of 10 psi. Calibration was performed using the SCIEX, Canada tuning solution (part number 4457953), and samples were randomly distributed within each batch for consistent analysis. The total analysis time was 55 min [50].
Data acquisition was conducted using Analyst TF 1.7.1 software (SCIEX, Canada). The raw MS data files; obtained from the TripleTOF™ 5600 + mass spectrometer; were processed using ProteinPilot (version 5.0.1.0, 4895) with the Paragon Algorithm (version 5.0.1.0, 4874). Protein identification was carried out by searching against two databases: the B. cereus database (Swiss-Prot and TrEMBL, containing 223,040 proteins) and a custom database for the “Quorum-quenching N-acyl-homoserine lactonase” protein (containing 96 accessions). The following search parameters were applied: cysteine alkylation was performed using iodoacetamide, and trypsin was used as the digestion enzyme. Gel-based identification was employed. Biological modifications were considered, and a false discovery rate (FDR) analysis was performed. Bias correction was applied to ensure accurate protein identification.
Evaluation of the anti-virulence activity of PP-Lactonase using Galleria mellonella infection model
The anti-virulence activity of PP-Lactonase of the isolate with high in vitro anti-virulence activity was evaluated against P. aeruginosa PAO1 using a Galleria mellonella larvae infection model [51]. Laboratory-reared larvae, weighing 150–250 mg, were obtained from the National Research Center, Giza, Egypt, and reared on artificial media [52].
The toxicity of the PP-Lactonase on Galleria mellonella larvae was tested [51]. Different enzyme concentrations (0.125, 0.0625, 0.03125, 0.0156, 0.0078 mg/mL) were prepared, and each of the five groups (n = 7 larvae per group) received 10 µL of the tested concentration injected into the hemocoel (below the hind proleg). Survival was monitored daily for 3 days, and the percentage mortality was recorded. The highest non-toxic concentration of the PP-Lactonase was used in the infection model. To determine the lethal infective dose of P. aeruginosa PAO1, 10 µL of inoculum ranging from 101 to 109CFU/mL was injected into the hemocoel (below the hind proleg) in each group of tested larvae (n = 7 larvae per group) [53]. For the infection model assay, a total of 21 larvae were divided into three groups (n = 7 per group): infected-treated, infected-untreated, and a negative control group. Systemic infection of Galleria mellonella larvae was carried out according to Peleg et al. (2009). A 10 µL of PAO1 inoculum and 10 µL of PP-Lactonase were pre-incubated together at 37 °C for 1 hour before injection into the infected-treated group. The infected-untreated group received 10 µL of PAO1 inoculum mixed with 10 µL sterile saline. For the negative control group, 20 µL of sterile saline was injected. After injection, the larvae were incubated aerobically at 28 ± 2 °C, and the survival was monitored daily for 72 h. Larvae showing no reaction upon touch were classified as dead. The experiment was performed in triplicate.
Statistical analysis
Data is expressed as the mean of three independent replicates ± standard deviation (SD). The standard error and statistical analysis were performed using GraphPad Prism 10.1 (La Jolla, CA, USA) software to determine statistical significance; differences between means were assessed using an unpaired t-test and one-way ANOVA, followed by Tukey’s post-hoc multiple comparison test. Statistical significance was defined as a p-value < 0.05. For the Galleria mellonella survival assay, Kaplan–Meier survival curves were generated, and statistical differences between groups were assessed using the Gehan–Breslow–Wilcoxon test.