
An overview of the SINGER algorithm
SINGER takes in phased WGS data and samples ARGs iteratively by adding one haplotype at a time through an operation called threading15. Conditioned on a partial ARG for the first n − 1 haplotypes, the threading operation samples the points at which the lineage for the nth haplotype joins the partial ARG. SINGER solves this by first building an HMM with branches as hidden states and sampling a sequence of joining branches along the genome from the posterior, using stochastic traceback (Fig. 1a). Then, SINGER builds another HMM with joining times as hidden states, conditioned on these sampled joining branches (Fig. 1b). We refer to these two steps as ‘branch sampling’ and ‘time sampling’, respectively (Methods). Although this two-step threading algorithm is approximative, by substantially reducing the number of hidden states, it is much faster than ARGweaver’s HMM, which treats every joining point in the tree as a hidden state.
Fig. 1: Method overview.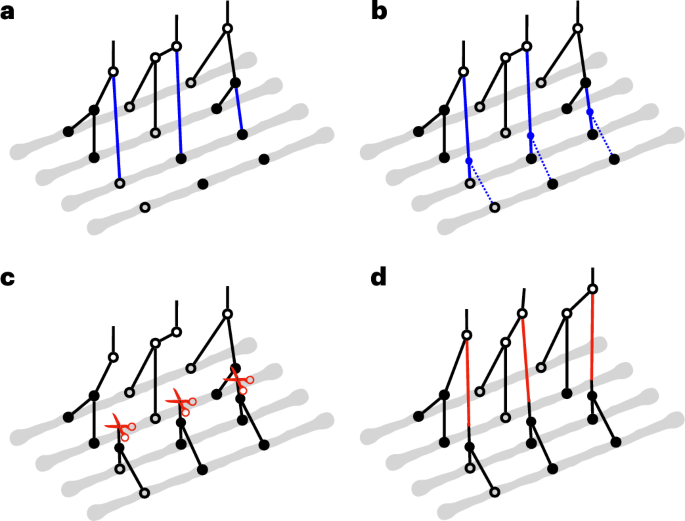
a–d, The gray lines represent haplotypes, and the circles indicate the allelic states of nodes in coalescent trees. Hollow circles correspond to ancestral alleles, and solid circles are derived alleles. In a, b and c, a partial ARG for the first three haplotypes has already been constructed, and a fourth haplotype is about to be threaded onto this partial ARG. a, The initial step in threading the fourth haplotype involves sampling the joining branch (highlighted in blue) in each marginal coalescent tree of the partial ARG, a process we call ‘branch sampling’. b, Following the determination of the joining branches, the next step is to sample the joining time for each of these joining branches. This step is referred to as ‘time sampling’. c,d, To propose an update to an ARG in MCMC, we first introduce cuts (illustrated by red scissors) to a sequence of marginal coalescent trees to prune subtrees. Then we re-graft them by solving the threading problem for the sub-ARG above the cuts. The branch length in the first two marginal trees and the topology of the third tree are altered after ‘sub-graph pruning and re-grafting’.
To explore the space of ARG topology and branch lengths according to the posterior distribution, SINGER uses an MCMC proposal called ‘sub-graph pruning and re-grafting’ (SGPR). In brief, an SGPR operation first prunes a sub-graph by introducing a cut and then extends it leftwards and rightwards (Fig. 1c); in Supplementary Section B.4, we show that the pruning step is equivalent to the removal step in the so-called ‘Kuhner move’41,42. However, our re-graft step (Fig. 1d) differs substantially from the Kuhner move; the latter samples from the prior by simulation, whereas SGPR uses the threading algorithm to sample from the posterior. Given that the Kuhner move ignores data during re-grafting, it rarely improves likelihood, whereas SGPR favors data-compatible updates. Compared to the Kuhner move and ARGweaver, SGPR introduces large updates to the ARG with higher acceptance rates (Supplementary Section B.4 and Supplementary Fig. 1), yielding a better convergence rate and mixing of the MCMC.
Lastly, to mitigate biases introduced by algorithmic approximations, SINGER performs ‘ARG re-scaling’ through a monotonic transformation of node times that aligns the inferred mutation density with branch lengths (Methods). This is conceptually similar to the ‘ARG normalization’ procedure introduced in ARG-Needle18, but ARG-Needle uses a provided demographic prior, whereas SINGER learns the transformation from the inferred ARG without external information. As long as the relative ordering of node ages is accurate, ARG re-scaling can calibrate the overall time distribution. In simulation benchmarks, we show that this greatly improves robustness against model misspecification (for example, population size changes) even though the HMMs assume a constant population size. This approach parallels site frequency spectra-based demography methods43,44,45 but incorporates explicit tree topologies inferred from SINGER, offering greater robustness to changing population sizes.
Performance benchmarks on simulated data
We first benchmarked the performance of several ARG inference methods (SINGER, ARGweaver, Relate, tsinfer + tsdate, ARG-Needle) using data simulated with msprime46. The simulation setup and benchmarking procedures are detailed in the Methods.
Coalescence time accuracy
To evaluate coalescence time estimation, we compared the ground truth and the inferred pairwise coalescence times for 100 randomly chosen leaf-node pairs, following a previous publication36. Pairwise coalescence times are important for applications such as demography inference16, genome-wide association studies18,25,47 and evolutionary studies35. For 50 haplotypes, SINGER was the most accurate; ARGweaver and Relate performed similarly, while tsinfer + tsdate was the least accurate (Fig. 2a). For 300 haplotypes, we compared only SINGER, Relate, tsinfer + tsdate and ARG-Needle, as this sample size is too large for ARGweaver. SINGER again performed best; Relate and ARG-Needle performed similarly and tsinfer + tsdate remained the least accurate (Extended Data Fig. 1). SINGER’s improved performance over ARGweaver might reflect better MCMC mixing efficiency and more flexible time discretization.
Fig. 2: Performance benchmarks on coalescence time and topology inference.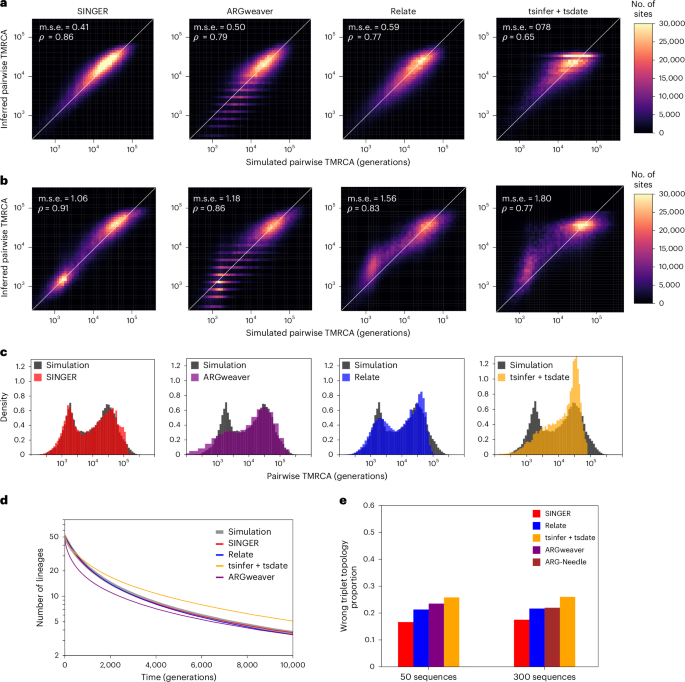
a, Inferred pairwise coalescence times compared with the ground truth in simulations involving 50 sequences under a constant population size scenario. b, Similar to a, but for data simulated under an inferred population size history for the CEU population. c, Inferred distribution of pairwise coalescence times (colored) compared with the ground truth (dark gray) from simulations under the same CEU demography as in b. d, Genome-wide average of the number of lineages as a function of time for 50 sequences under a constant population size history, compared with the ground truth in simulations. e, The proportion of triplet topologies that are incorrectly inferred for 50 and 300 sequences under a constant population size history. Owing to runtime constraints, ARGweaver is not benchmarked for 300 sequences.
We also compared against pairwise-coalescent methods that analyze each sequence pair independently, specifically considering the recently proposed method Gamma-SMC48. SINGER substantially outperforms Gamma-SMC (Fig. 2a and Supplementary Fig. 2), whereas Relate and tsinfer + tsdate show no improvement in either mean squared error or correlation.
We also evaluated the genome-wide average number of lineages as a function of time in marginal trees, a statistic relevant to demography and selection inference. ARGweaver underestimates many recent coalescence times, causing the number of lineages to drop too fast (Fig. 2d and Supplementary Fig. 3); this aligns with Fig. 2a and corroborates a previous finding16 that ARGweaver tends to underestimate times. On the other hand, tsdate substantially overestimates coalescence times (Fig. 2d). By contrast, Relate and SINGER agree well with the expectation (Fig. 2d).
Tree topology accuracy
To assess topology inference accuracy, we used the triplet distance, defined as the fraction of three-leaved subtrees with different topologies in a given pair of trees. This metric is relevant for applications such as imputation and local ancestry, which depend on the accuracy of local topologies. On average, SINGER achieved the lowest triplet distances to the ground truth (Fig. 2e). Again, ARGweaver was less accurate than SINGER, potentially owing to ARGweaver’s less efficient MCMC and the presence of polytomies in its inferred trees. We also considered an evaluation metric related to the total variation distance introduced in a previous work18, and the results similarly favored SINGER over other methods (Supplementary Section C.2 and Supplementary Figs. 4 and 5).
Robustness to model misspecification
One advantage of SINGER is its robustness to model misspecification; specifically, it is less sensitive to incorrect effective population sizes \(\,{(N}_{e})\) and unmodeled population size changes. When using an \({N}_{e}\) that is off by a factor of five, the coalescent times inferred by SINGER were less biased than Relate and tsinfer + tsdate, which showed systematic underestimation (Supplementary Fig. 6).
We simulated data under an inferred CEU population size history49,50, which contains a bottleneck and recent expansion. On these data, SINGER not only inferred the coalescence times more accurately than ARGweaver, Relate and tsinfer + tsdate (Fig. 2b) but also accurately captured the bi-modality in the pairwise coalescence time distribution caused by the bottleneck (Fig. 2c). Although Relate can incorporate population size changes, it requires running a separate module of estimating branch lengths and coalescent rates, which takes even longer than running Relate itself. ARG-Needle requires a user-specified size history to adjust its coalescence times and is not able to handle an unknown size history. By contrast, SINGER automatically adjusts branch lengths through ARG re-scaling, with little computational overhead.
Accuracy of mutation and recombination inferences
We also benchmarked allele age estimation using inferred ARGs, excluding ARG-Needle and ARGweaver because ARG-Needle does not map mutations to branches, and ARGweaver’s output is difficult to parse for this task. On simulated data with 50 sequences, SINGER noticeably outperformed Relate and tsinfer + tsdate (Fig. 3a). For 300 sequences, SINGER remained more accurate than Relate and tsinfer + tsdate (Extended Data Fig. 2).
Fig. 3: Benchmarks on mutation and recombination inference for data simulated with 50 sequences and constant population size.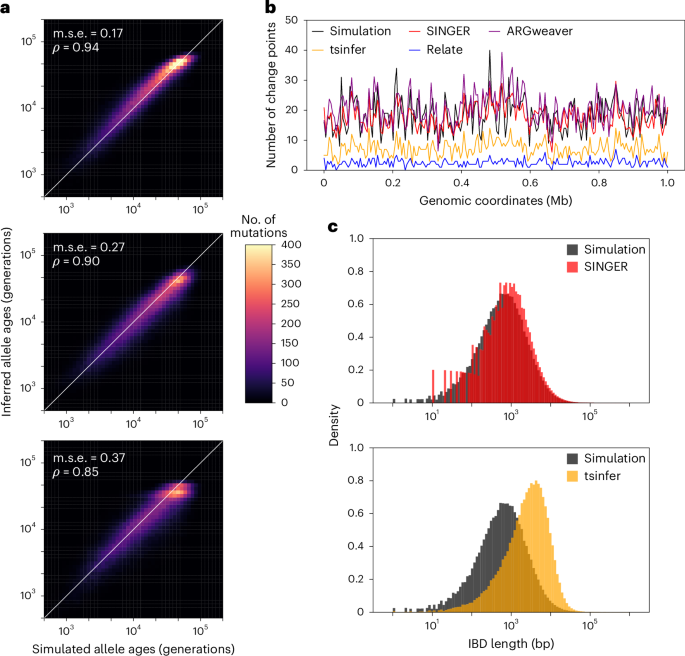
a, Inferred allele ages compared with the ground truth. b, Inferred number of recombination breakpoints in 5 kb genomic windows compared with the ground truth. c, The length distribution of pairwise IBD in the inferred ARGs compared with the ground truth.
We also compared the number of recombination breakpoints in 5 kb windows. Only ARGweaver and SINGER produced accurate estimates (Fig. 3b). Both Relate and tsinfer missed many recombination events, consistent with earlier studies37.
Finally, we assessed the accuracy of recombination inference by the distribution of pairwise identity-by-descent (IBD) lengths, which are shaped by recombination. ARGweaver and Relate were excluded from this analysis; the former because of difficulties extracting IBD information from its output, and the latter owing to a lack of node persistence across marginal trees. As illustrated in Fig. 3c, SINGER accurately captured the distribution of pairwise IBD lengths, while tsinfer substantially overestimated IBD lengths, consistent with previous findings37.
Comparison of MCMC convergence
In humans and many other organisms, the genome-wide average rates of recombination and mutation are similar, which leads to substantial uncertainty in ARG inference. Therefore, it is important to obtain samples from the posterior distribution and characterize uncertainties, rather than relying on point estimates. To assess MCMC convergence, we obtained 100 posterior MCMC samples from ARGweaver, Relate and SINGER, using the same burn-in and thinning intervals.
To assess the posterior sampling effectiveness, we used the same benchmark as in previous work36. This involved analyzing rank plots of pairwise coalescence times; a uniform distribution would be achieved by a perfect sampler from the posterior distribution51,52. A rank plot is a histogram of the rank of a parameter sampled from the prior relative to the posterior sample. Ideally, a converged and well-mixed MCMC should yield uniformly distributed ranks. By contrast, a U-shaped rank plot suggests sampling from an under-dispersed distribution51,52. Compared to ARGweaver and Relate, SINGER’s rank plots are much closer to the uniform distribution (Fig. 4b).
Fig. 4: Properties of ARG samples and runtimes.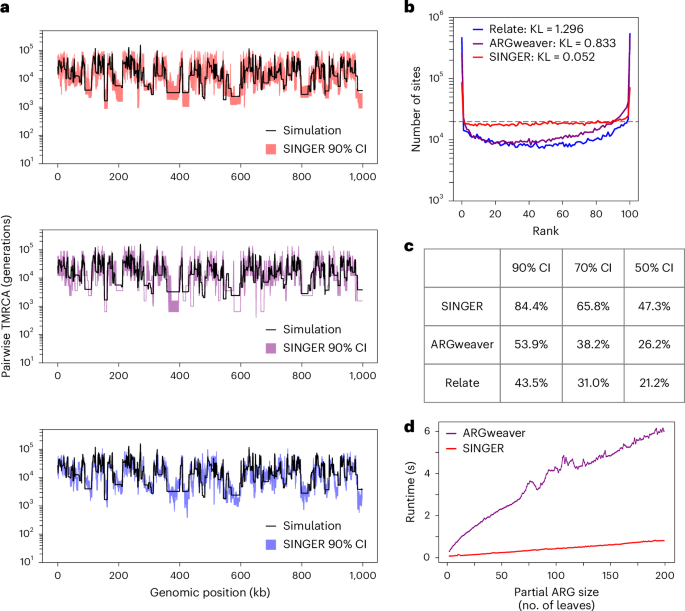
a, Empirical 90% CIs for pairwise coalescence times as inferred by SINGER, ARGweaver and Relate. b, Rank plots of pairwise coalescence times in MCMC samples. A perfect sampler from the posterior distribution would achieve the flat dashed line, corresponding to the uniform distribution. The Kullback–Leibler (KL) divergence is used to quantify deviation from a uniform distribution. c, The runtime of the threading algorithm as a function of the partial ARG size (measured by the number of leaves), for ARGweaver and SINGER. d, The empirical coverage of the ground truth pairwise coalescence time by the CI for different nominal levels.
The rank plot is closely related to the coverage property of empirical credible intervals (CIs). For each genomic position and pair of haplotypes, the empirical 90% CI is defined by the 5th to the 95th percentile of the sampled coalescence times (Fig. 4a). The same approach was applied to the 70% and 50% CIs. The 90% CI covered the ground truth in only 44% of instances for Relate and 54% for ARGweaver. By contrast, the coverage was substantially better for SINGER, at 85% (Fig. 4c). SINGER also compared favorably at other CI levels (Fig. 4c).
Furthermore, even with thinning intervals 40 times longer than SINGER, ARGweaver still underperforms in pairwise coalescence time inference and CI coverage (Extended Data Fig. 3). Combined with our faster threading algorithm, this suggests that ARGweaver would require hundreds to thousands of times longer to match SINGER’s performance. For Relate, even with long thinning intervals, CI coverage remains substantially below nominal levels (Extended Data Fig. 3 and Supplementary Section C.4), probably because Relate samples only coalescence times under a fixed topology, whereas SINGER samples both topologies and coalescence times.
Runtime comparison
Given that both SINGER and ARGweaver use threading algorithms, we compared their threading runtimes as a function of the number of leaves in the partial ARG. SINGER’s threading is approximately 10× faster than ARGweaver’s (Fig. 4d).
Other benchmarks
We performed additional benchmarks53 (Supplementary Sections C.2 and C.5 and Supplementary Fig. 7) and observed that SINGER outperforms other methods. We also note that a recent independent benchmarking study found that SINGER outperforms other ARG inference methods in reconstructing allele frequency trajectories and polygenic score histories54.
SINGER supports using an input recombination map to account for the recombination rate variation along the genome55,56, which improves inference accuracy (Supplementary Section C.6 and Supplementary Figs. 8 and 9).
Applications to WGS data from the 1000 Genomes Project
We applied SINGER to 200 whole-genome sequences from five African indigenous populations (GWD, YRI, ESN, LWK and MSL) in the 1000 Genomes Project57, with 40 genomes randomly sampled per population (Supplementary Section D.1). To demonstrate the utility of SINGER, we analyzed population differentiation in coalescence times, trans-species polymorphism and archaic introgression. We also ran SINGER and Relate on the British (GBR) population data from the 1000 Genomes Project (Supplementary Section D.1) and used tsinfer + tsdate ARG from a previous publication3 for comparison.
Diagnostics of the ARGs sampled by SINGER
We examined the sampled ARGs to check MCMC convergence and to ensure that sampling for inference occurred past proper burn-in (Supplementary Section D.4). The chains generally converged well (Supplementary Fig. 10). Additionally, we validated the accuracy of the sampled ARGs by comparing the inferred average pairwise coalescence times (scaled by \(4{N}_{e}\mu\)) with empirical single-nucleotide polymorphism (SNP)-based nucleotide diversities in 1 Mb windows, which showed high concordance. By contrast, Relate and tsinfer + tsdate3 underestimated the genome-wide variation of diversity (Extended Data Fig. 4a). This is possibly because of the \({N}_{e}\) variation as a result of background selection58,59. As shown earlier, SINGER is more robust to \({N}_{e}\) misspecification. Additionally, tsinfer + tsdate has a very biased variant density prediction from inferred ARG compared to observed data (Extended Data Fig. 4b). This is probably caused by polytomies, which distort the total branch length. In addition, Relate and tsinfer + tsdate require allele polarization (that is, distinguishing ancestral vs derived alleles), but it is difficult for the HLA locus with high levels of trans-species polymorphisms.
Population differentiation in coalescence times
Population-level differentiation in coalescence times at the same genomic locus is often used to identify sites that warrant further evolutionary analysis60,61,62. Such differentiation could be a result of evolutionary forces such as local adaptations, which reduce diversity for the population experiencing selective sweeps. However, SNP-based diversity can be noisy at fine scales (Supplementary Fig. 11). On the other hand, with accurately inferred ARGs, fine-scale diversity can be estimated more accurately. We observed that SINGER produces more accurate estimates of fine-scale diversity than Relate and tsinfer + tsdate (Supplementary Section D.5 and Supplementary Fig. 11). This improvement facilitates studying population-specific fine-scale differentiation in coalescence times. Many previously reported loci under positive selection in Europeans63 appear as outliers when comparing the 1 kb-scale average pairwise time to the most recent common ancestor (TMRCA) between GWD and GBR (Supplementary Fig. 12), probably reflecting European-specific selection. They also exhibit long segments of reduced pairwise TMRCA among target allele carriers compared to the overall sample (Supplementary Section D.6 and Extended Data Fig. 5). Here, we focus on population-specific reduction in local diversity in African populations.
To find population-specific reduction in local diversity, we partitioned the genome into 1 kb windows and computed the ratio of the ARG-based diversity estimate for the combined sample to that for each of the five populations; reductions in local diversity would show up as peaks when these ratios are plotted along the genome. The full list of regions with elevated ratios for each population is available in the Data Availability section. We highlight a few interesting findings in Fig. 5 and Supplementary Fig. 13. For example, we found that the gene MITF has experienced a reduction in diversity in GWD relative to other populations (see also Supplementary Fig. 14); this gene has been reported to be related to skin64. Around MITF, we observed substantial differences in local diversity across the five populations, consistent with pigmentation variation within Africa61. In YRI, we found that SPCS3 has reduced diversity in YRI compared to other populations; this gene encodes an immune-related protein believed to impact virion production of flaviviruses such as yellow fever virus65. This is concordant with the report of the spread of these diseases in Nigeria66. Lastly, we found that SCN9A, which encodes a voltage-gated sodium channel involved in the perception of pain67, has substantially reduced diversity. These examples illustrate the utility of SINGER for exploratory evolutionary analysis, but additional studies are needed to investigate if, and how, selection is acting in these loci.
Fig. 5: ARG-based detection of differentiated coalescence times in African populations.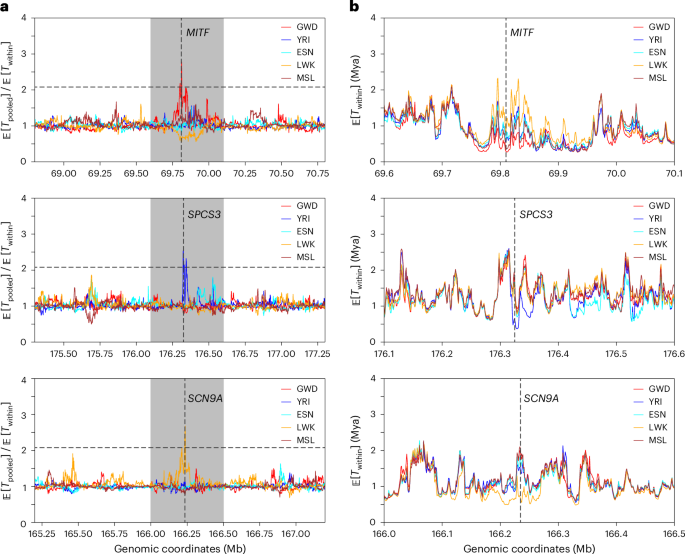
a, The ratio of the average pairwise coalescence time in the pooled sample, Tpooled (combining all five populations), to the average population-specific pairwise coalescence time, Twithin, for every 1 kb window. In each plot, the horizontal black dashed line denotes the genome-wide 99.99% quantile, and the gray shaded area corresponds to a 50 kb window surrounding the peak. The positions of these peaks are marked by vertical dashed lines, and the genes overlapping with these signals are indicated. b, The average Twithin for each population, zoomed into the gray regions highlighted in a.
Archaic introgression
Evidence shows that modern humans carry DNA segments from Neanderthals and Denisovans68,69,70 as well as unidentified hominid groups71. Identification of these introgressed genomic tracts is a challenging task, especially when there is little or no known genome of the source hominids. However, ARGs can facilitate this task by the following observation: for an introgressed tract in a given haplotype, its coalescence with other haplotypes will be depleted in the interval between the introgression time and the split time of modern humans from the ‘ghost’ population (Fig. 6a). This is similar to the ‘long branch’ signals described in previous work16, but expressed in the pairwise coalescence space.
Fig. 6: ARG-based detection of archaic introgression tracts.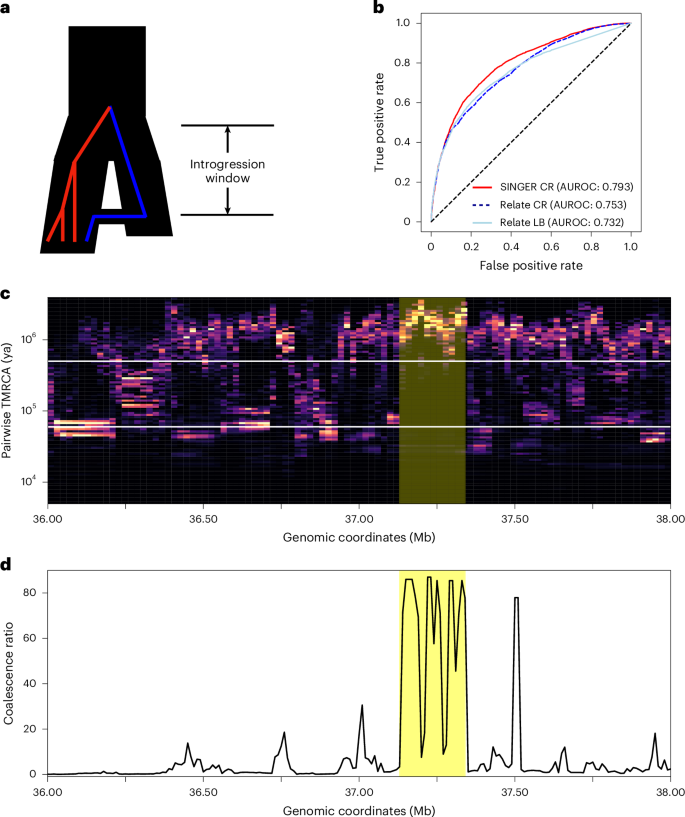
a, The demography model involving introgression and the un-introgressed (red) and introgressed (blue) lineages under the model. The time interval from the introgression time to the divergence time of the two populations is called the ‘introgression window’. b, The receiver operating characteristic (AUROC) plot of using coalescence ratio (CR) and long branch proportion (LB) from Relate and SINGER to differentiate the inferred introgressed and un-introgressed tracts from IBDmix. c, Identification of potential archaic introgression tracts. For a given leaf node, its pairwise coalescence times with every other leaf node in the marginal tree are summarized as a distribution. In the plot, each column represents such a distribution from marginal trees within a 10 kb window. The two white horizontal lines delineate the interval between the introgression time and the split time. A tract indicative of introgression should exhibit a depletion of coalescence events within this interval and an enrichment of coalescence events above the split time. Regions shaded in red denote putative introgression tracts. d, The ratio of pairwise coalescence density above the split time to that within the interval between the introgression time and the split time.
However, the ‘long branch’ signals can be sensitive to topology inference errors (Supplementary Fig. 15); specifically, the introgressed lineage can group incorrectly with the ancestral lineages of non-introgressed sequences, thereby destroying the long branch (Supplementary Section D.7). To mitigate this issue, we provide a technique based on the coalescence distribution heatmap. For each sequence, we plot the distribution of its pairwise coalescence time with the remaining sequences in 10 kb windows (Fig. 6c), in which each column corresponds to a 10 kb window. We found that using posterior samples of ARGs is helpful, as the coalescence distribution from a single ARG can be noisy (Supplementary Fig. 16). ARG samples with different topologies help smooth the heatmap (Supplementary Fig. 16). This is related to the visualization shown in previous work48.
To detect introgression tracts, we look for a depletion of probability mass in the aforementioned interval and an enrichment of mass above the interval. This is more robust than long branches because slight mis-grouping would still lead to probabilistic depletion in the interval, whereas the long branch would be disrupted completely. We demonstrated the feasibility of this approach by showing that the ARGs inferred by SINGER can recover the Neanderthal introgression tracts inferred by IBDmix72, a referenced-based method directly comparing Neanderthal and modern genomes (Supplementary Section D.7). The coalescence ratio slightly outperforms long branch signals for detecting archaic introgression in Relate, and SINGER compares favorably with Relate on this task (Fig. 6b).
Here, we highlight a potential 200 kb Neanderthal introgression tract in GBR (Fig. 6c), supported by IBDmix and the coalescence depletion signal from SINGER-inferred ARGs. We use 60 kya and 500 kya for introgression and split times, respectively, following previous work73, and plot the ratio of coalescence probability above the split time to that in the interval between introgression and split times. This tract appears as distinctive peaks in the ARG-based analysis (Fig. 6d).
Trans-species polymorphism in the HLA locus
The HLA locus comprises a cluster of genes that encode transmembrane proteins that present antigen peptides to T cells. This region is known to be the most diverse region in the human genome, and it has been hypothesized to be under extreme balancing selection to maintain high diversity to handle various immune challenges74,75. There has been evidence of trans-species polymorphism for some alleles across primates, which otherwise is very rare74.
The ARGs inferred by SINGER show extremely ancient pairwise coalescence times in the HLA locus, with many regions harboring coalescence times older than the human–chimpanzee divergence time (Fig. 7a,b). In African individuals, we computed the average TMRCA in 1 kb windows on chromosome 6 and found that HLA is the only region with the average TMRCA above 10 million years (Supplementary Fig. 17), making erroneous ARG inference an unlikely explanation for these ancient coalescence times. This is consistent with the hypothesis of strong balancing selection in this locus and the known trans-species polymorphisms. The human–chimpanzee divergence time is estimated to be 5–12 Mya76. Although many genes in the HLA region do not show strong evidence of coalescence times older than the human–chimpanzee split (for example, TAP1, TAP2 and TAPBP), many do, including HLA-A, HLA-DRB1 and HLA-DRB6. Unsurprisingly, there are no noticeable differences across the five populations, as the polymorphism has been maintained since ancient times. By contrast, in GBR, Relate and tsinfer + tsdate3 do not recover such extreme coalescence times (Fig. 7b), probably owing to poor allele polarization in the HLA locus and model misspecification arising from deviations from selective neutrality. To validate our results, we compared the mutation densities in 10 kb windows from real data with predictions from the inferred ARG; SINGER provides a good fit, while Relate and tsinfer + tsdate underestimate substantially (Fig. 7c).
Fig. 7: The fine-scale diversity landscape in the HLA region in Africans and GBR, and comparison between observed and inferred mutation density in GBR.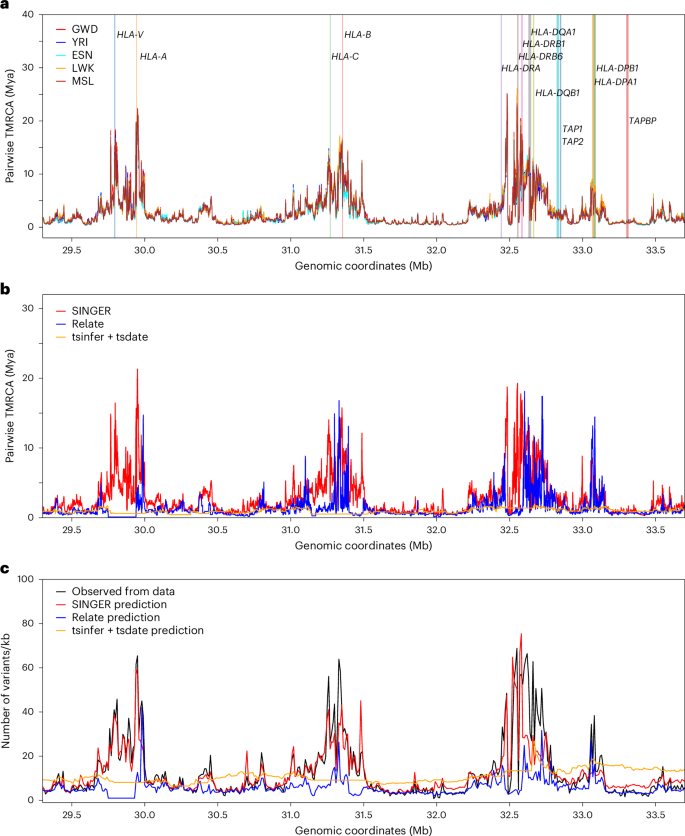
a, The average pairwise coalescence time in the HLA in the African sample, with a few genes highlighted (vertical bar colors have no meaning aside from denoting different genes). b, The average pairwise coalescence time in the HLA in GBR, inferred from SINGER, Relate and tsinfer + tsdate. c, The observed mutation density from data compared with that predicted from ARGs, inferred from SINGER, Relate and tsinfer + tsdate.
In addition to the HLA locus, we extended the analysis genome-wide to find other loci with exceptionally ancient coalescence times (Supplementary Fig. 18), some of which coincide with previous findings of long-term balancing selection, including TRIM5 (ref. 77), ABO78, IGFBP7 (ref. 79), PKD1L1 and DMBT1 (ref. 80).