
Variation in the opportunity cost of food production
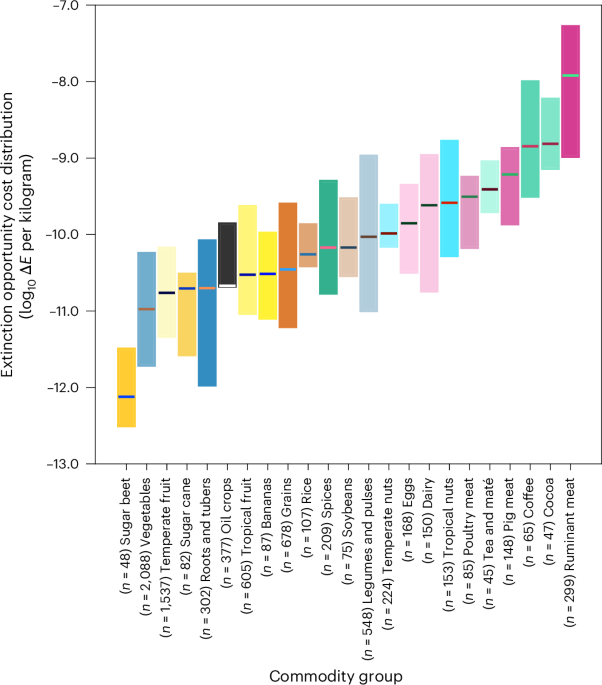
Animal products generally have substantially greater impacts on species extinction risk than staple vegetal products (Fig. 1). This is a result of the inherently inefficient nature of these products28,29: producing a unit of animal product requires grazing land and/or cropland for feed production, which when combined with the intrinsic feed conversion efficiency of animals leads to high land use and hence extinction impacts. Ruminant meat, for example, has a weighted global median opportunity cost on speciesʼ extinctions ~340 times greater than that of grains, by mass, and around 100 times greater than plant derived proteins such as soybeans and other legumes. We fully acknowledge the high protein content and hence relative nutritional or cultural importance of animal products in some diets. We found that when accounting for protein density (Extended Data Fig. 1), the high protein content of animal-derived protein sources reduced their relative impacts compared with plant-based options. The full ranges of poultry meat and eggs sat within the boundaries of the legumes and pulses group, indicating that well-performing poultry meat might be less damaging than the very worst legumes, though the median impacts are still around five times higher. The median consequences of ruminant meat remained 100 times higher than that of legumes and pulses when accounting for protein. Indeed, across most commodities, the pattern of our findings remains broadly consistent when expressed instead in terms of functional units of consumption (for example, impact per unit protein, or unit serving, commodity dependent). This result is unsurprising, given that more than three-quarters of the human-appropriated land surface is dedicated to the production of animal products while providing only 17% of global calories30.
Fig. 1: Global variation across and within commodities in the expected extinction impact of producing 1 kg of agricultural commodity or commodity group.
The lower and upper boundaries of the boxes represent the production-mass-weighted 10th and 90th percentiles, respectively. Horizontal lines represent the weighted global median (50th percentile). Where commodities are grouped, the per kilogram extinction risk values of each constituent commodity are weighted by their contribution (by mass) to the total global production of that group. Extended Data Fig. 1 provides a version of this analysis based on functional units of consumption (for example, by protein content or serving size) rather than mass.
In contrast staple crops have relatively low impacts on the opportunity cost to speciesʼ extinctions (∆E); grains (excluding rice), vegetables, roots, oil crops and fruits all sit between 10−10 ∆E kg−1 and 10−11 ∆E kg−1. Conversely, ‘luxury’ crops (those with little to no calorific benefit but generally commanding a high price) such as coffee, cocoa, tea and spices are all towards the higher end of the impact distribution per kilogram—although, of course, these commodities are typically consumed in relatively modest amounts. Sugar beet has the lowest extinction opportunity cost impact per kilogram; it is high yielding compared with most other crops27, and its production is concentrated in northern and central Europe and the northern United States, where the opportunity cost to biodiversity of agricultural land use is relatively low.
The extinction impact of 1 kg of production varies within most commodities by nearly an order of magnitude, with some varying substantially more. Exceptions to this general pattern include commodities whose production is dominated by a handful of nations. For example, India and China alone produce around 50% of the world’s rice with relatively similar per kilogram impacts, and so there is relatively low variation in the impacts of rice production. The opposite is true of commodity groups that are produced in many different locations—grains, legumes and pulses and dairy products, for example, are produced in sizable quantities on every continent and vary in their per kilogram impacts by almost two orders of magnitude. Likewise, impacts vary widely with provenance for coffee. Coffee produced in South America and sub-Saharan Africa has an impact approximately ten times greater than that produced in southeast Asia, explained by lower per-area LIFE opportunity costs and higher yields of robusta coffee, which dominates Asian production31, compared with arabica, which dominates production elsewhere.
Generally, commodities that are produced in tropical or sub-tropical regions have higher per kilogram impacts than those from temperate regions (evident from the distinction between temperate and tropical fruit and nuts, for example). This is unsurprising, given that tropical regions often house exceptional levels of biodiversity and endemism, greatly increasing the impacts of agriculture on global extinction. In the next section we explore the issue of location in more depth by comparing the extinction impacts of food consumption across six countries with widely differing dietary and sourcing profiles.
Across-country differences in the impacts of food consumption and provenance
We selected six countries as examples for comparing consumption impacts—the United States, Japan and the United Kingdom as global north nations with high, moderate and low levels of agricultural self sufficiency, respectively32,33; Brazil as a largely self sufficient, highly productive tropical country, which is a globally important producer of many commodities34 (soy, corn, sugar cane, cattle meat, fruits and nuts); Uganda as one of several nations in sub-Saharan Africa that, while not reliant on imports, nevertheless faces widespread malnutrition35,36; and India as a largely self-sufficient country and a major exporter of rice, sugar cane and tea32.
Our results reveal the very substantial contribution of ruminant meat consumption to the per capita extinction impact of food consumption in every one of these countries (Fig. 2). The impact profiles of the three nations in the global north are driven strongly by their ruminant meat intake, suggesting that even small changes to diet composition would have proportionally large consequences (next section). In the case of the United States, cattle production is concentrated in southern states, where the extinction impact of a unit area of agricultural land use is much higher than the north23. Per capita, Brazil is the third-highest consumer of beef at 36 kg per capita per year (ref. 27), so it is unsurprising that over half of its extinction opportunity cost arises from ruminant meat. Despite suffering relatively high levels of food insecurity, the consumption of beef is consistent across socio-economic groups in Brazil37. Whereas priority should, of course, be given to ensuring sufficient nutrition for consumers, a reduction in Brazilian beef consumption in lieu of healthier and more sustainable alternatives might align with health and greenhouse gas targets at the same time as reducing extinction impact38.
Fig. 2: The mean per capita extinction impact caused by consumption within the United States, Japan, the United Kingdom, Brazil, Uganda and India.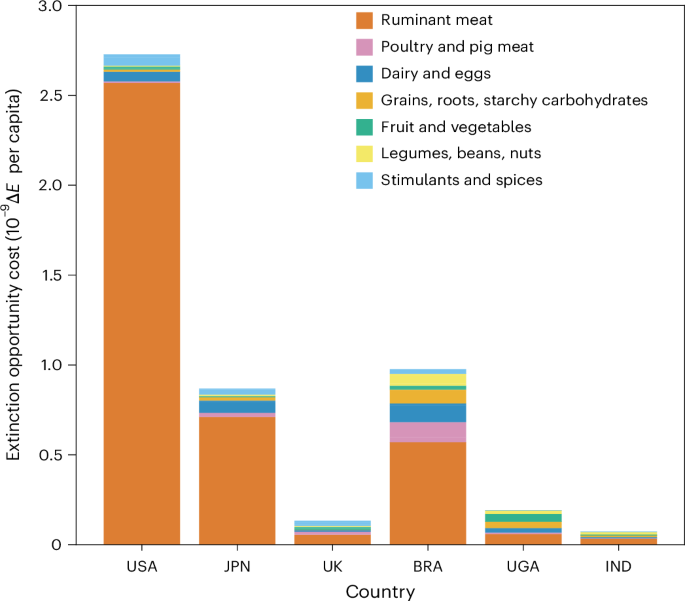
Note that due to complex and opaque supply chains, sugar impacts have been excluded from these consumption analyses. A version of this figure with commodity detail broken down further can be found in Extended Data Fig. 2. USA refers to United States, JPN to Japan, UK to United Kingdom, BRA to Brazil, UGA to Uganda and IND to India.
Whereas the United Kingdom and Japan consume comparable quantities of ruminant meat per capita, the United Kingdom’s ruminant footprint arises largely from imported cattle and sheep meat from Australia and New Zealand (approximately 25% of consumption) and soy imported from South America. On the other hand, roughly half of all ruminant meat consumed in Japan is imported from high-impact regions (in particular, the United States, Australia and New Zealand and Mexico) and so, on average, the per kilogram impact of consumption is far greater. Even in India, where approximately one-third of the population are lacto-vegetarian and cattle slaughter is banned in many states39, ruminant meats (mainly sheep and goat meat) contribute of 40% of the impact of people’s diets on speciesʼ extinctions. A version of Fig. 2 with commodity detail broken down further can be found in Extended Data Fig. 2. The magnitude of impact across these countries is dramatic. Even though the United Kingdom and similar countries might have low per capita impacts, land use for agriculture is nevertheless the biggest threat to biodiversity in these places40,41. Sixty-three percent of agricultural land in the United Kingdom is used as grazing land for ruminants at the same time as 21% of the least-productive land produces only 3% of calories for the United Kingdom42. Clearly, changes to consumption patterns could free large areas of land for restoration to benefit biodiversity both domestically and overseas as we explore in the next section.
Unpacking the issue of provenance further, Fig. 3 shows the proportion of the impact of consuming 1 kg of a commodity that arises from imported versus domestically produced food. A version of Fig. 3 with commodity detail broken down further can be found in Extended Data Fig. 3. The extinction opportunity costs of food consumption within the United Kingdom and Japan are both driven almost entirely by imports. Although these countries produce 60% and 38% of their food domestically33,43, 95% and 98% of their impacts, respectively, come from imported commodities. In terms of speciesʼ extinction risks, for both nations almost all of the impacts of food they consume are accrued in other nations. Given their size and population densities, some reliance on imported food is perhaps inevitable, but this result suggests that sustainably intensifying domestic production and investing in less-damaging production overseas should be key policy concerns for these countries. Conversely, current trends in both countries towards promoting low-yielding domestic agriculture44,45—which may increase reliance on imports from higher-impact regions—are a cause for concern46. These countries might still take steps to reduce the localized impact of domestic agriculture (for example, through some regenerative practices) whereas at the same time reducing their exported impacts through trade policies or more efficient use of their available land, for example, through dietary shifts or sustainable intensification. In addition, for the United Kingdom, the effects of post-Brexit trade deals on the extent to which they increase imports of ruminant products from Australia and New Zealand should also be carefully scrutinized47,48,49.
Fig. 3: The percentage of consumption-driven extinctions arising from imported and domestically produced food commodities, estimated for the United States, Japan, the United Kingdom, Brazil, Uganda and India.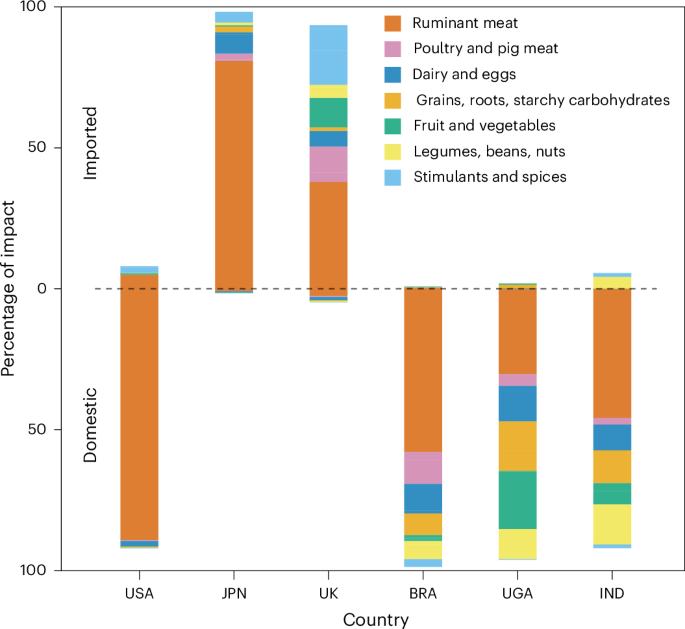
Imported food commodities are shown above the dashed line, and domestically produced food commodities are shown below the dashed line. Country abbreviations are the same as Fig. 2. As in Fig. 2, sugar is excluded from these analyses. A version of this figure with commodity detail broken down further can be found in Extended Data Fig. 3.
In contrast, the extinction impact of food consumed in Brazil, Uganda and India arises very largely from domestic production, with the impact of imports being just 2%, 9% and 4%, respectively. We suggest reducing the impacts of the food people consume in these countries will often best be addressed by sustainably increasing yields and thus increasing production to meet rising demand without clearing remaining areas of natural habitat48,50. The United States also has a low proportion of import-driven impacts ( ~ 10%)—it produces the bulk of its food domestically, although it is nevertheless reliant on imports of commodities such as coffee and bananas—but yields in the United States are already relatively high (at least, for vegetal products), so conservation policies may be more effective here if directed at dietary shifts9, as we explore in the next section.
Dietary impact in the United States
Last, turning from consumption and provenance, we illustrate for the United States how our approach can be used to compare the impact of different diets. We modelled the extinction opportunity cost of baseline individual consumption in the United States using FAO data27 (Fig. 4). We then compare it to the hypothetical impact of three reference diets: first, that of the EAT–Lancet planetary health diet as consumed by an individual in the United States51; this is designed to be consistent with both health and planetary boundaries. Whereas the micronutrient profile of the EAT–Lancet diet as a globally suitable diet has seen some criticism52, we selected it as a reference diet with a theoretically healthy macronutrient profile that allowed for the consumption of some ruminant meat, where many other reference diets preclude ruminant meat in favour of other protein sources. We also constructed simple hypothetical diets that modify the relative consumption of food groups based on vegetarian and plant-based Eatwell guides53,54,55,56, shown in Table 1. These ‘diets’ are idealized and thus in theory contain sufficient macronutrient quantities for an average healthy adult. The total calorific contribution of the modified groups was scaled to meet the calorific value of the products that are replaced. In reality, vegetarian and plant-based consumers are likely to have lower total calorific intakes, so we probably underestimate the mitigation effects of shifting to such diets22. Each diet (including the baseline) also includes calories lost to food wasted at the consumer level; these calories are included in FAOSTAT consumption statistics, and the production impacts of food are blind to its ultimate usage. Stimulants and spices do not meaningfully contribute to calorific intake, so we elected to set them as constant. In each of these examples, food is assumed to be sourced from the same places that the United States currently sources food. This means, for example, that the impact of the vegetarian diet is specific to the United States: the vegetarian diet applied elsewhere might have different impacts. In these examples, in which we are considering the marginal impact of individual consumption patterns, changes in demand are sufficiently small that market price effects would not come into play.
Fig. 4: The extinction impacts of average daily per capita food consumption in the United States for consumption in 2021, the EAT–Lancet planetary health diet and hypothetical vegetarian and vegan diets.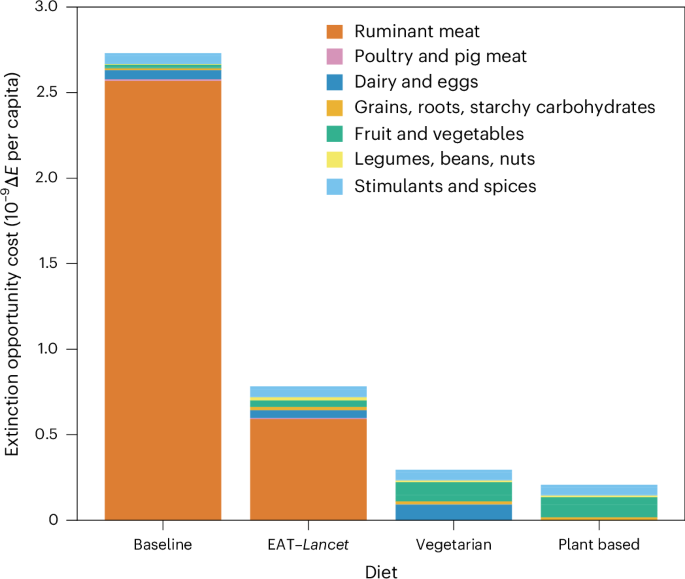
Table 1 provides a detailed breakdown of commodities in each diet. Baseline intake values are taken from FAO data27. The intake of spices, coffee, cocoa, tea and maté remains constant across diets. The EAT–Lancet diet is the ‘Planetary Health Diet’, designed to be consistent with health requirements and planetary boundaries51. The vegetarian and vegan diets are based on ‘Eatwell’ plates, with constituent commodities consumed in the same ratios that they currently are within each group53,54,55,56. Each reference diet is scaled to have the same number of calories as the baseline, which in theory accounts for food waste and overconsumption, probably overestimating their impacts.
Table 1 Contributions to total calories of different food groups in our baseline US and hypothetical diets as consumed in the United States
Our results underscore the greatly disproportionate extinction impacts of eating animal products, especially ruminant meat. Reducing the prevalence of ruminant meat from the baseline 4% of energy intake down to 1% in the EAT–Lancet diet reduces the total extinction opportunity cost by almost three-quarters, despite a necessary increase in the consumption of fruit, vegetables, legumes and nuts. The removal of ruminant meat in the vegetarian and vegan diets leads to a further reduction in extinction opportunity cost of more than half, despite these diets having crop impacts, which are higher than the baseline (by 50% and 10%, respectively) due to the approximately fourfold increase in the intake of fruits and vegetables. Given that land use is central to the extinction opportunity costs we have calculated here, it is important to note that not all land is necessarily suitable for the same purposes. Monogastric livestock rely almost entirely on feed produced on land that might otherwise be used to produce human-edible commodities. van Zanten et al.57 found that it was approximately twice as land efficient (per unit of human-edible protein) to produce crops for direct human consumption than feed for poultry and pigs. This effect is generally more pronounced for products from ruminant animals (including dairy products), whose feed conversion efficiency is much lower than that of monogastric animals and whose land use can include both grazing and feed-producing land. Of course in some systems, ruminant animals utilize land that is unsuitable for crop production, but even in these circumstances, grazing still imposes an opportunity cost to biodiversity (albeit typically less than arable farming). We thus see that there is considerable scope for reducing the harm to nature by changing US diet patterns, driven largely by the prominence of ruminant meat impacts. Mitigating impacts in a healthy way beyond reducing ruminant consumption is likely to be more complex and subject to both provenance and methods of production. We also conducted this analysis for the United Kingdom (Extended Data Fig. 4), finding that replacing animal-derived calories with entirely plant-based calories leads to just over 50% reduction in impact—notably a similar finding to that of Scarborough22, assuming that baseline consumption is comparable with the medium meat-eater group in that study.