
We used data from the most recent national health survey from low- and middle-income countries with available information on family planning. The surveys use standardized questionnaires to collect data from reproductive-aged women and young children selected using multi-stage sampling procedures. Generally, all women aged 15 to 49 are eligible to be interviewed in the survey, but some countries restrict the sampling to ever-married women. To include a larger number of countries and ensure comparability, only women married or in a union were included in our analysis.
We calculated four family planning indicators, including contraceptive prevalence by any methods (CPRany), contraceptive prevalence by modern methods (CPRm), DFPSany, and DFPSm. All the indicators share the same numerator – the number of partnered women 15–49 years using contraceptives (any or modern, depending on the indicator). The denominator for CPRany and CPRm is partnered women aged 15–49 years, while the denominator for DFPSany and DFPSm includes only those women in need of contraception. Fecund women who do not desire a child in the next two years or wish to delay pregnancy are considered in need. Women who are pregnant or in postpartum amenorrhea whose pregnancy was undesired are also considered in need of contraception. Infecund women (those who fall in any of the following situations: (i) never menstruated; (ii) are menopausal; (iii) do not have an under-five child and the last period was more than six months ago; (iv) are married and did not have a child while not using contraception in the past five years and; (v) declared that are unable to conceive) are not considered in need of contraception. More details on the indicator definitions are found elsewhere [10].
Modern contraceptive methods were defined according to Hubacher and Trussell’s [11]. Their definition of modern contraceptives includes condoms, sterilization (male and female), intrauterine devices, implants, oral contraceptives, injectables, emergency pills, patches, diaphragms, spermicidal agents, vaginal rings, and sponges.
We generated estimates for all four indicators at five levels (national, subnational, area of residence, wealth quintiles, and woman’s education) from all available surveys. These estimates were pooled into five separate datasets, one for each inequality dimension. Sampling weights and the clustered design of the surveys were accounted in the calculation of the estimates.
For each family planning indicator (DFPSany and DFPSm), we fitted separate linear regression models across each of the five inequality dimensions, resulting in a total of ten models. Within each of these ten, we tested multiple model specifications, exploring a combination of predictors and the use of fractional polynomials to account for non-linear relationships. In the end, all models yielded very similar results. Therefore, for each indicator, we selected and present a single model — the one based on subnational regions — as it comprised more units of analysis and better reflected diverse contexts.
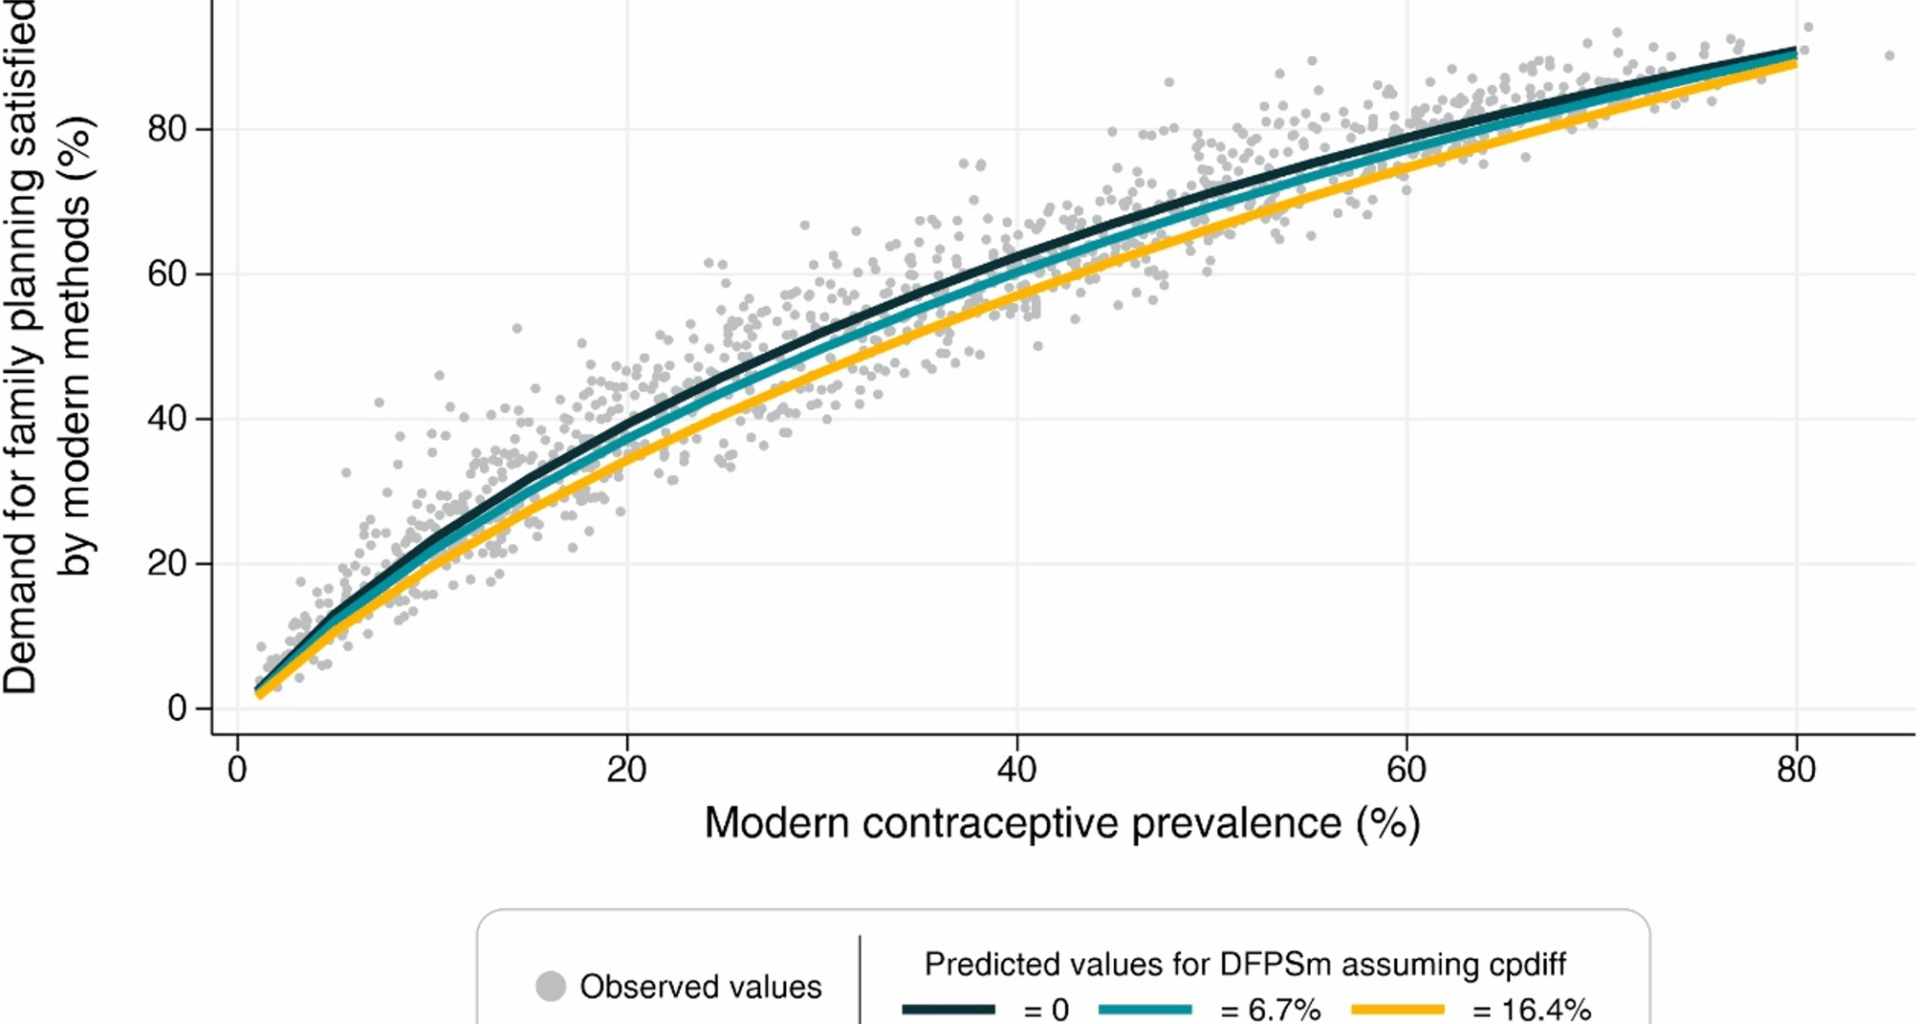
Prior to model fitting, we applied a logit transformation to the DFPS indicators to ensure predicted values remained within the [0–1] interval. The transformed values served as the outcome variable in linear regression models. The primary predictor was the contraceptive prevalence rate (for any or modern methods, accordingly), while other potential predictors considered included the difference between CPRany and CPRm, the ratio between CPRany and CPRm, and the total fertility rate. Fractional polynomials of up to the second order were tested to capture potential non-linear relationships. Contraceptive prevalence rates below 1% were excluded from the analysis to mitigate potential instability in the models. The hierarchy of subnational regions nested within each country was accounted when calculating the standard errors in the adjustment of the model at this level.
To evaluate the models’ predictive performance, we used a 5-fold cross-validation strategy which involves dividing the data into five subsets, training the models on four subsets, and evaluating their performance on the remaining subset. Subsets are cycled until all of them are used for training and validation. The out-of-sample accuracy of the predictions was quantified by computing bias, mean absolute error and correlation metrics. Predicted DFPS values were back-transformed to the original scale for interpretation purposes.
Finally, sensitivity analyses were tested by restricting the sample for contraceptive rates of 15% or above based on the slope of the regression in the original publication. All analyses were carried out using Stata version 17 [12].