
Study selection
The preliminary search obtained 2927 articles, among which 1024 duplicates were eliminated. 28 articles were retained after reading the titles and abstracts, and 15 articles were excluded after full-text screening (3 articles for pronounced differences in research methods and 12 articles for not providing sufficient data or indexes). Finally, 13 trials were enrolled. The screening process is displayed in Fig. 3.
Fig. 3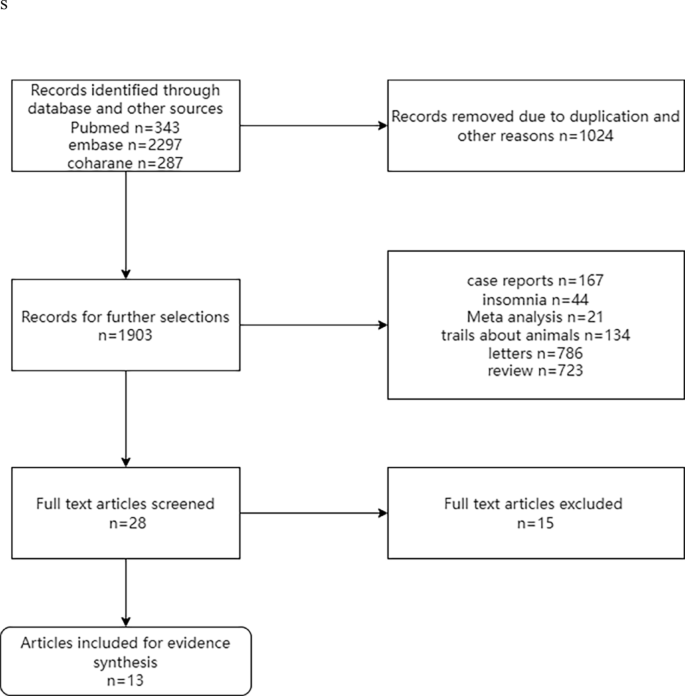
PRISMA flow diagram of the study
Meta-analysisESSLinks between interventions
Five trials [1, 3, 7, 9, 12] reported ESS scores, including placebo, modafinil, and three novel wake-promoting drugs. The trials reported only comparisons of novel wake-promoting drugs versus placebo, without comparisons between novel wake-promoting drugs. The direct comparison of solriamfetol versus placebo was the most studied, with no closed loop formed (Fig. 4).
Fig. 4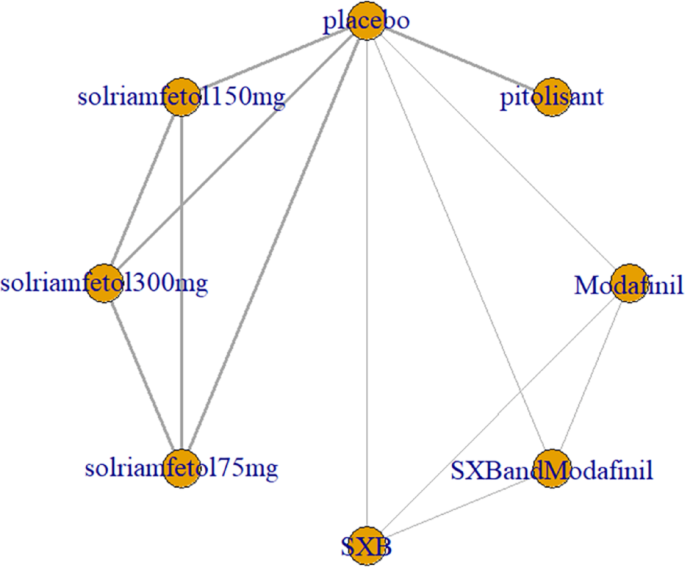
ESS as an outcome measure for the treatment of narcolepsy with arousal drugs. Notes: The thickness of the lines corresponds to the number of trials included for each comparison ESS = Epworth Sleepiness Scale
Synthesized results
NMA results evinced that all drugs except modafinil lowered ESS scores compared to placebo (p < 0.05), whereas solriamfetol 300 mg demonstrated significant efficacy compared to modafinil (MD = −4.74, 95%CI: −6.51, −2.97). The top three regimens ranked by SUCRA were solriamfetol 300 mg, SXB+modafinil, and solriamfetol 150 mg (Fig. 5). League table of the effects of pro-arousal drug therapy on ESS is shown in Table 1. The ranking of various medications in terms of their effectiveness in reducing ESS scores is detailed in the league table (Table 2).
Fig. 5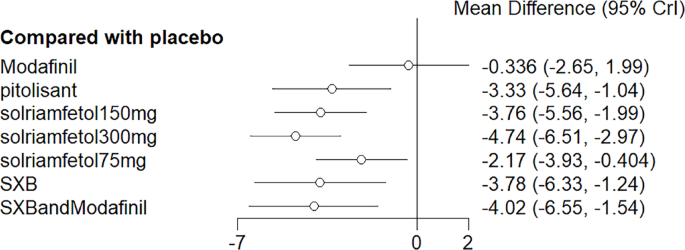
Meta-analysis forest plot of wakefulness-promoting drug treatment on ESS response compared with placebo. Notes: ESS = Epworth Sleepiness Scale
Table 1 League table of the effects of pro-arousal drug therapy on ESSTable 2 Ranking of the effects of arousal drug therapy on ESS treatmentMeta-regression
Meta-regression of dose and duration of treatment was not performed given the limited number of included trials (Table 3).
Table 3 Ranking of the effects of wakefulness-promoting drugs on MWTMWTLinks between interventions
Six trials [1, 5,6,7, 9, 12] reported MWT results of sleep latency. These included the traditional wake-promoting drug modafinil and four new drugs, namely pitolisant, solriamfetol (75 mg, 150 mg, and 300 mg), SXB, and SXB+modafinil. All trials had comparisons with placebo, pairwise comparisons between some drugs, and multiple comparisons between some drugs, with no complete closed loop formed (Fig. 6).
Fig. 6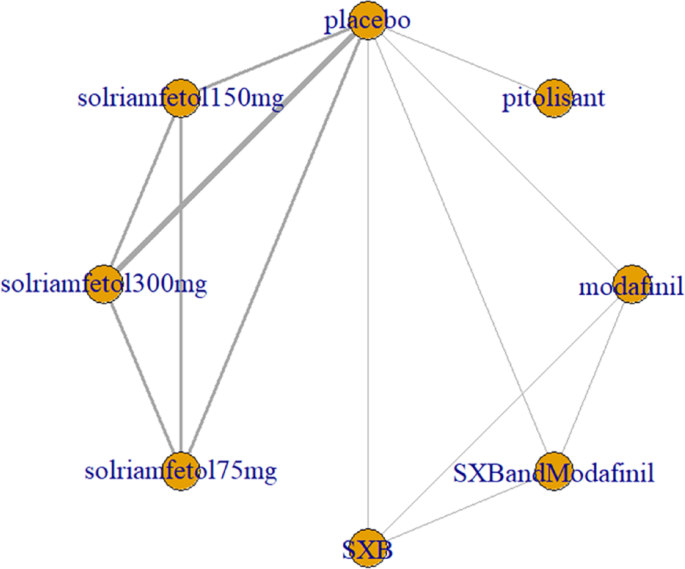
MWT was used as an outcome measure to measure the network relationship of pro-arousal drugs in the treatment of narcolepsy. Notes: The thickness of the lines corresponds to the number of trials included for each comparison MWT = Maintenance of Wakefulness Test
Synthesized results
NMA results noted that solriamfetol at all doses (75 mg, 150 mg, 300 mg) increased the mean sleep latency compared to placebo, and SXB+modafinil showed the same effect. Solriamfetol 300 mg also showed significant efficacy compared to pitolisant (MD = 10.82, 95%CI: 6.99, 14.31) (Fig. 7). The top three regimens in SUCRA were solriamfetol 300 mg, solriamfetol 150 mg, and SXB+modafinil. Detailed results are shown in Table 4. The ranking of various drugs in terms of their effect on increasing the mean sleep latency is detailed in the league table (Table 3).
Fig. 7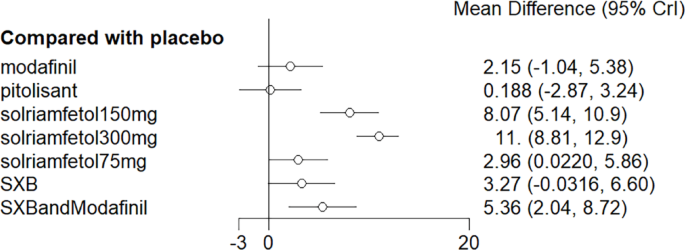
Meta-analysis forest plot of wakefulness-promoting drug treatment on MWT response compared with placebo. Notes: MWT = Maintenance of Wakefulness Test
Table 4 Effects of wakefulness-promoting drugs on MWTMeta-regression
Meta-regression of dose and duration of treatment was not performed given the limited trials.
CataplexyLinks between interventions
Two trials [9, 12] investigated the decrease in cataplexy frequency after drug application, including pitolisant and solriamfetol (75 mg, 150 mg, and 300 mg). All trials had comparisons with placebo and pairwise comparisons between some drugs, with no complete closed loop formed (Fig. 8).
Fig. 8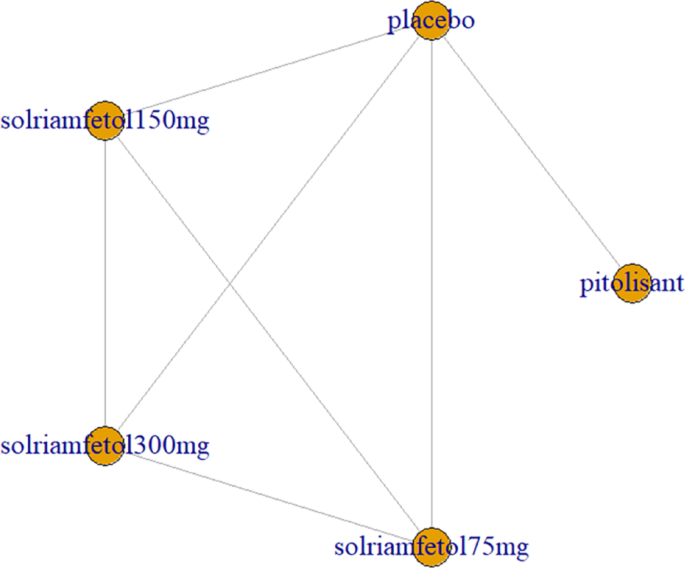
Cataplexy as an outcome indicator to measure the effects of wakefulness-promoting drugs on the treatment of narcolepsy. Notes: The thickness of the lines corresponds to the number of trials included for each comparison
Synthesized results
NMA results elicited no significant advantage for pitolisant and solriamfetol over placebo in reducing cataplexy frequency compared with placebo (Fig. 9).
Fig. 9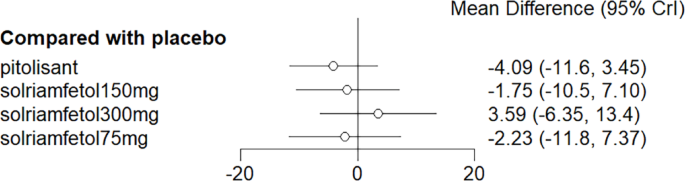
Meta-analysis forest plot of cataplexy response in wakefulness-promoting drug treatment compared with placebo
Meta-regression
Meta-regression of dose and duration of treatment was not performed given the limited trials.
Number of patients with ESS score < 10Links between interventions
Three trials [3, 9, 10] examined the decrease in ESS scores after drug application, including pitolisant and solriamfetol (75 mg, 150 mg, and 300 mg). All trials had comparisons with placebo, pairwise comparisons between some drugs, and multiple comparisons between some drugs, with no closed loop formed (Fig. 10).
Fig. 10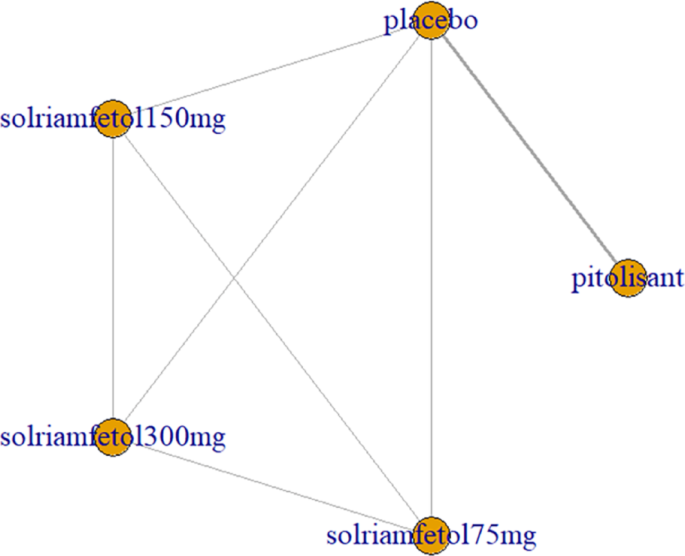
Network relationship diagram of wakefulness-promoting drugs in the treatment of narcolepsy using ESS < 10 as the outcome indicator. Notes: The thickness of the lines corresponds to the number of trials included for each comparison, ESS = Epworth Sleepiness Scale
Synthesized results
No considerable advantage was noted in the number of people with ESS scores < 10 with pitolisant and solriamfetol compared with placebo (Fig. 11).
Fig. 11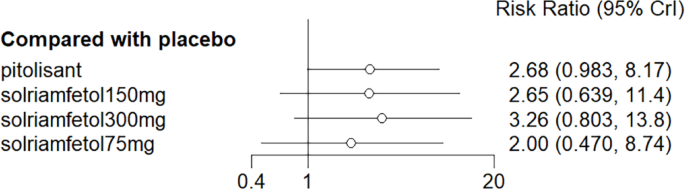
Meta-analysis forest plot of wakefulness-promoting drug treatment for ESS < 10 response compared with placebo. Notes: ESS = Epworth Sleepiness Scale
Meta-regression
Meta-regression of dose and duration of treatment was not performed given the limited trials.
SDLPLinks between interventions
SDLP (standard deviation of lateral position) is the core parameter of a standardized on-road driving test, which is primarily used to assess the effects of central nervous system medications on driving ability and is considered to be the “gold standard” for such research. This experiment required trained participants to maintain a steady lane position and constant speed on a 100-km public highway, using a roof camera and infrared light to measure the lateral position of the vehicle relative to the lane markings. Low SDLP indicated that the vehicle remained stable with good driving control. High SDLP indicated that the vehicle shifted frequently from side to side, reflecting reduced driver control due to medication, fatigue, and other factors.
SDLP was reported in 2 trials [15, 16], including modafinil and solriamfetol (2 h and 6 h after drug administration). The trials reported only drug versus placebo comparisons, without pairwise comparisons between drugs. There was only one trial for both drugs and the graph showed no closed loops (Fig. 12).
Fig. 12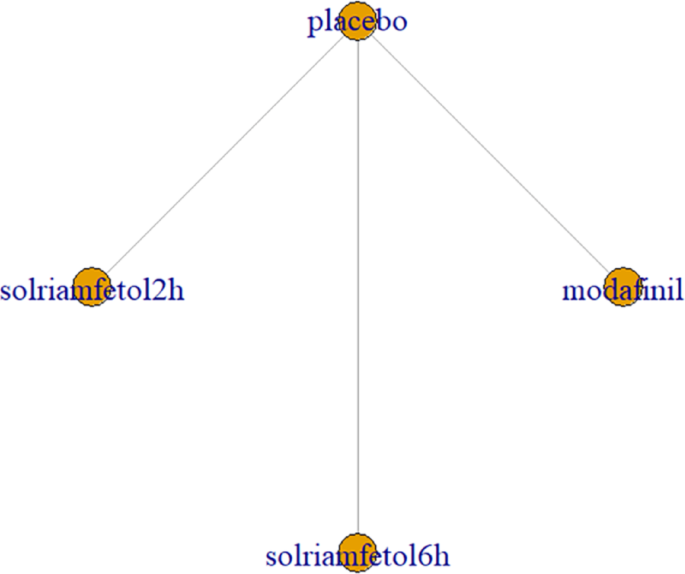
Network relationship diagram of using SDLP as the outcome indicator to measure the effects of wakefulness-promoting drugs in the treatment of narcolepsy. Notes: The thickness of the lines corresponds to the number of trials included for each comparison SDLP = Standard Deviation of Lateral Position
Synthesized results
No considerable advantage was observed for modafinil and solriamfetol in improving SDLP compared with placebo (Fig. 13).
Fig. 13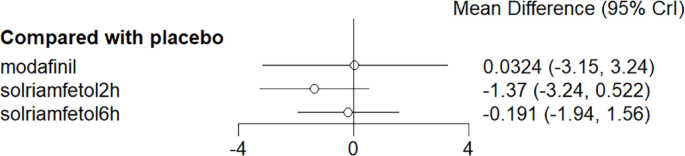
Meta-analysis forest plot of wakefulness-promoting drug treatment on SDLP response compared with placebo. Notes: SDLP = Standard Deviation of Lateral Position
Meta-regression
Meta-regression of dose and duration of treatment was not performed given the limited trials.
Adverse effects
All trials reported adverse effects, including anxiety, diarrhea, dizziness, headache, irritability, nasopharyngitis, nausea, somnolence, and vomiting. Of these, solriamfetol had the lowest risk of anxiety but the highest risk of headache. SXB had the highest risk of vomiting [29.5, (2.46,1.46e+03)] and diarrhea [8.53, (1.14,263)], and SXB+modafinil increased the risk of dizziness [7.67, (1.01,58.7)]. Pitolisant had the highest risk of nausea symptoms [4.22e+08, (4.09,1.26e+32)]. For other adverse effects, no differences were demonstrated between drugs and placebo. Specific comparative network diagrams can be found in Figs. 14, 15, 16, 17, 18, 19, 20, 21, 22, 23, 24, 25, 26, 27, 28, 29, 30 and 31 (Supplementary Material).
Fig. 14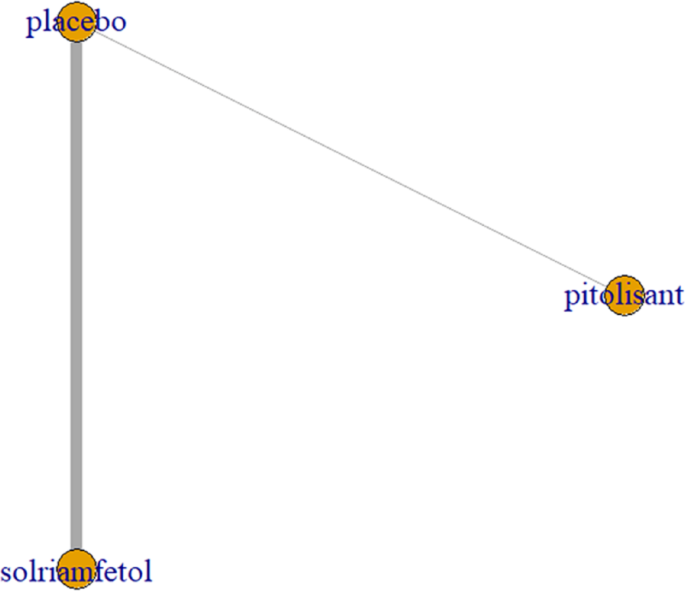
Network relationship diagram of using anxiety as the outcome indicator to measure the effects of wakefulness-promoting drugs in the treatment of narcolepsy. Notes: The thickness of the lines corresponds to the number of trials included for each comparison
Fig. 15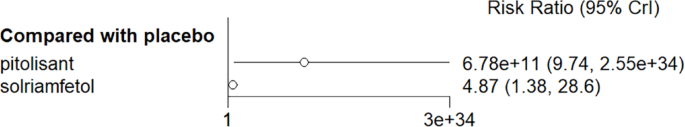
Meta-analysis forest plot of the effect of wakefulness-promoting drugs on anxiety response compared with placebo
Fig. 16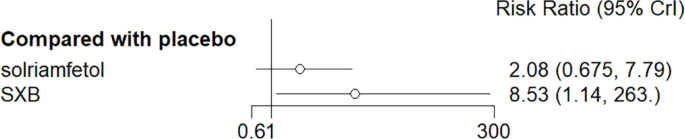
Diarrhea as the outcome indicator to measure the effect of wakefulness-promoting drugs in the treatment of narcolepsy. Notes: The thickness of the lines corresponds to the number of trials included for each comparison
Fig. 17![]()
Meta-analysis forest plot of wakefulness-promoting drug treatment for diabetic response compared with placebo
Fig. 18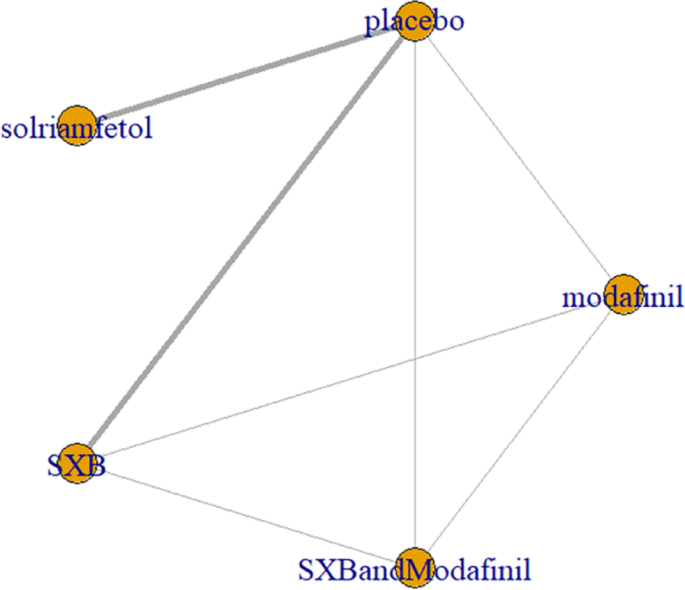
Network relationship diagram of using Dizziness as the outcome indicator to measure the effects of wakefulness-promoting drugs in the treatment of narcolepsy. Notes: The thickness of the lines corresponds to the number of trials included for each comparison
Fig. 19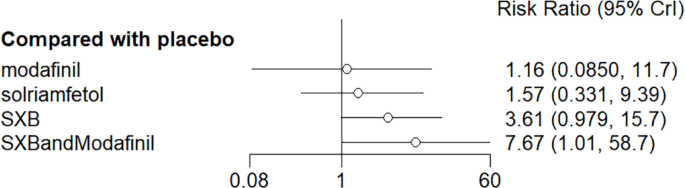
Meta-analysis forest plot of wakefulness-promoting drug treatment on dizziness response compared with placebo
Fig. 20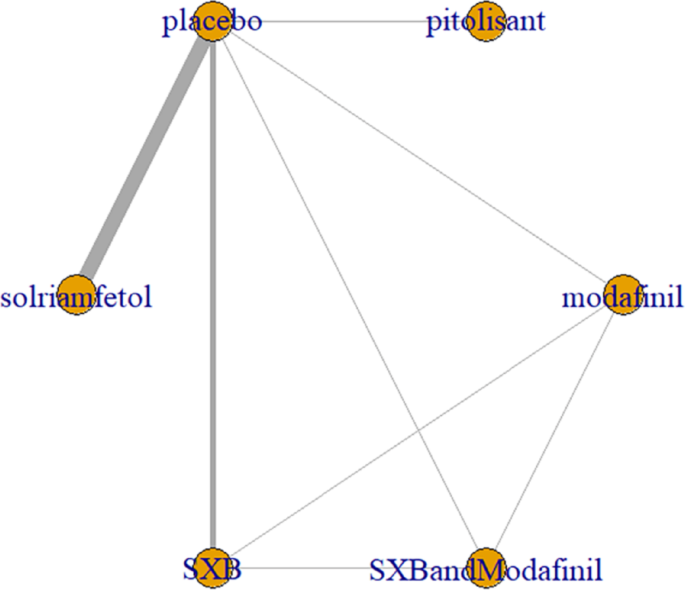
Network relationship diagram of using headache as the outcome indicator to measure the effects of wakefulness-promoting drugs in the treatment of narcolepsy. Notes: The thickness of the lines corresponds to the number of trials included for each comparison
Fig. 21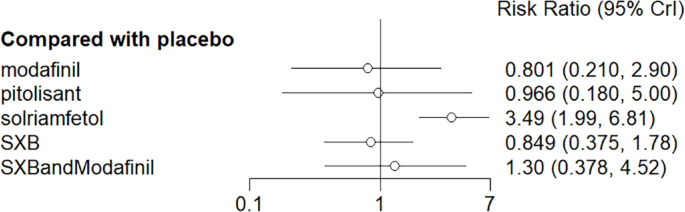
Meta-analysis forest plot of headache response between wakefulness-promoting drugs and placebo
Fig. 22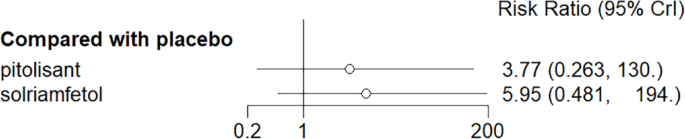
Network relationship diagram of using irritability as the outcome indicator to measure the effects of wakefulness-promoting drugs in the treatment of narcolepsy. Notes: The thickness of the lines corresponds to the number of trials included for each comparison
Fig. 23![]()
Meta-analysis forest plot of wakefulness-promoting drug treatment on irritability response compared with placebo
Fig. 24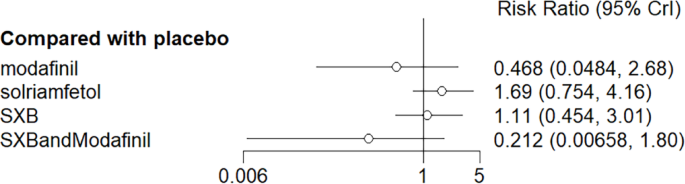
Nasopharyngitis as the outcome indicator to measure the effect of wakefulness-promoting drugs on the treatment of narcolepsy. Notes: The thickness of the lines corresponds to the number of trials included for each comparison
Fig. 25![]()
Meta-analysis forest plot of wakefulness-promoting drug treatment for nasopharyngitis response compared with placebo
Fig. 26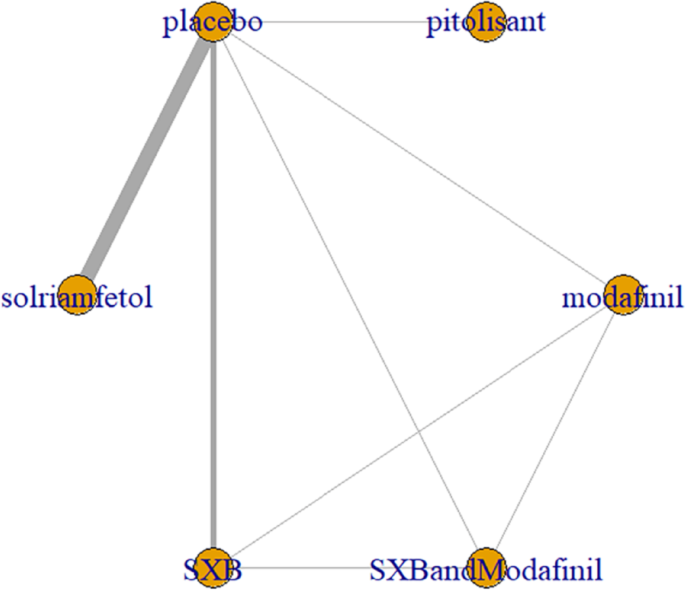
Network relationship diagram of using Nausea as the outcome indicator to measure the effects of wakefulness-promoting drugs in the treatment of narcolepsy. Notes: The thickness of the lines corresponds to the number of trials included for each comparison
Fig. 27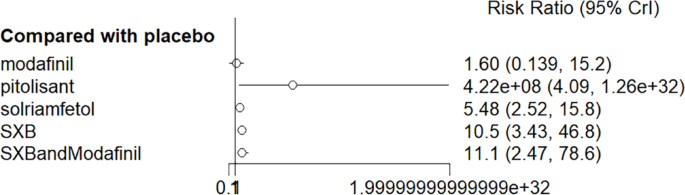
Meta-analysis forest plot of wakefulness-promoting drug treatment for nausea response compared with placebo
Fig. 28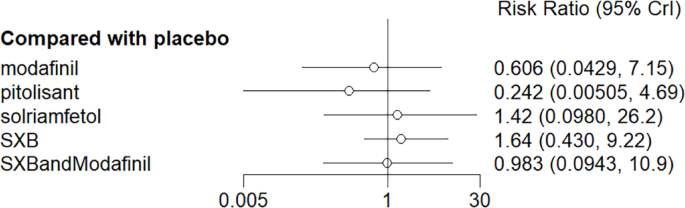
Network relationship diagram of using somnolence as the outcome index to measure the effects of wakefulness-promoting drugs in the treatment of narcolepsy. Notes: The thickness of the lines corresponds to the number of trials included for each comparison
Fig. 29![]()
Meta-analysis forest plot of somolence response of wakefulness-promoting drug treatment compared with placebo
Fig. 30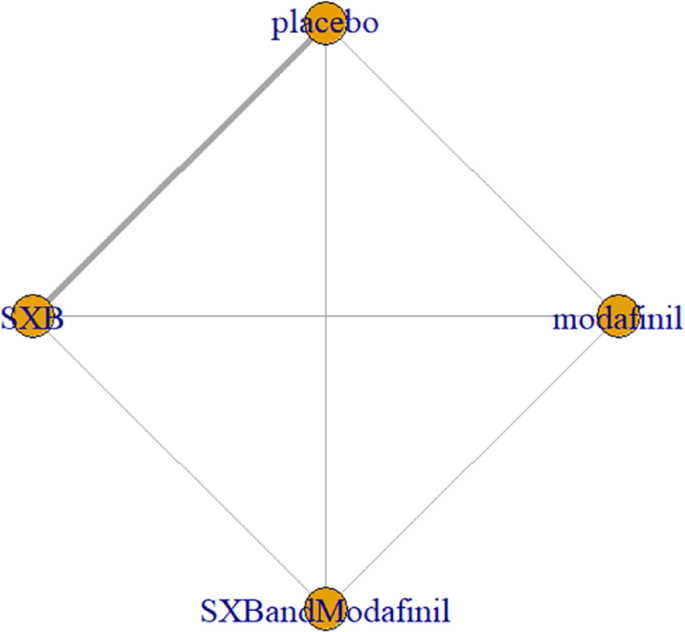
Network relationship diagram of using vomiting as the outcome indicator to measure the efficacy of wakefulness-promoting drugs in the treatment of narcolepsy. Notes: The thickness of the lines corresponds to the number of trials included for each comparison
Fig. 31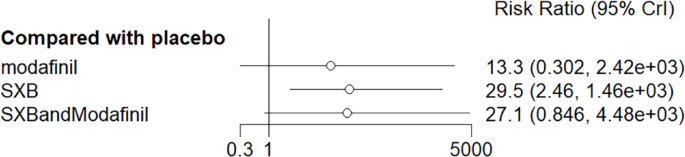
Meta-analysis forest plot of wakefulness-promoting drug treatment on vomiting response compared with placebo