
General condition of mice
For this study, 60 mice of both sexes at equal numbers were used. Details concerning the condition of animals such as changes in body weight have been reported in our recently published paper [3]. Experimental groups of mice were fed diets bearing from no histamine to high histamine contents. One cohort of 36 animals was supplied either with the Altromin control or with the high-histamine diet, another cohort of 24 animals with the Ssniff control or the high-histamine diet. After switching from standard control food to diets with high histamine, animals consumed less food for 1–3 days, but thereafter all animals gained weight at a similar rate, males more than females [3]. No abnormality in appearance, physical health or behavior was detected during the feeding periods in any of the animals of the low and high histamine diet groups.
CGRP levels in low and high histidine/histamine diet-fed mice
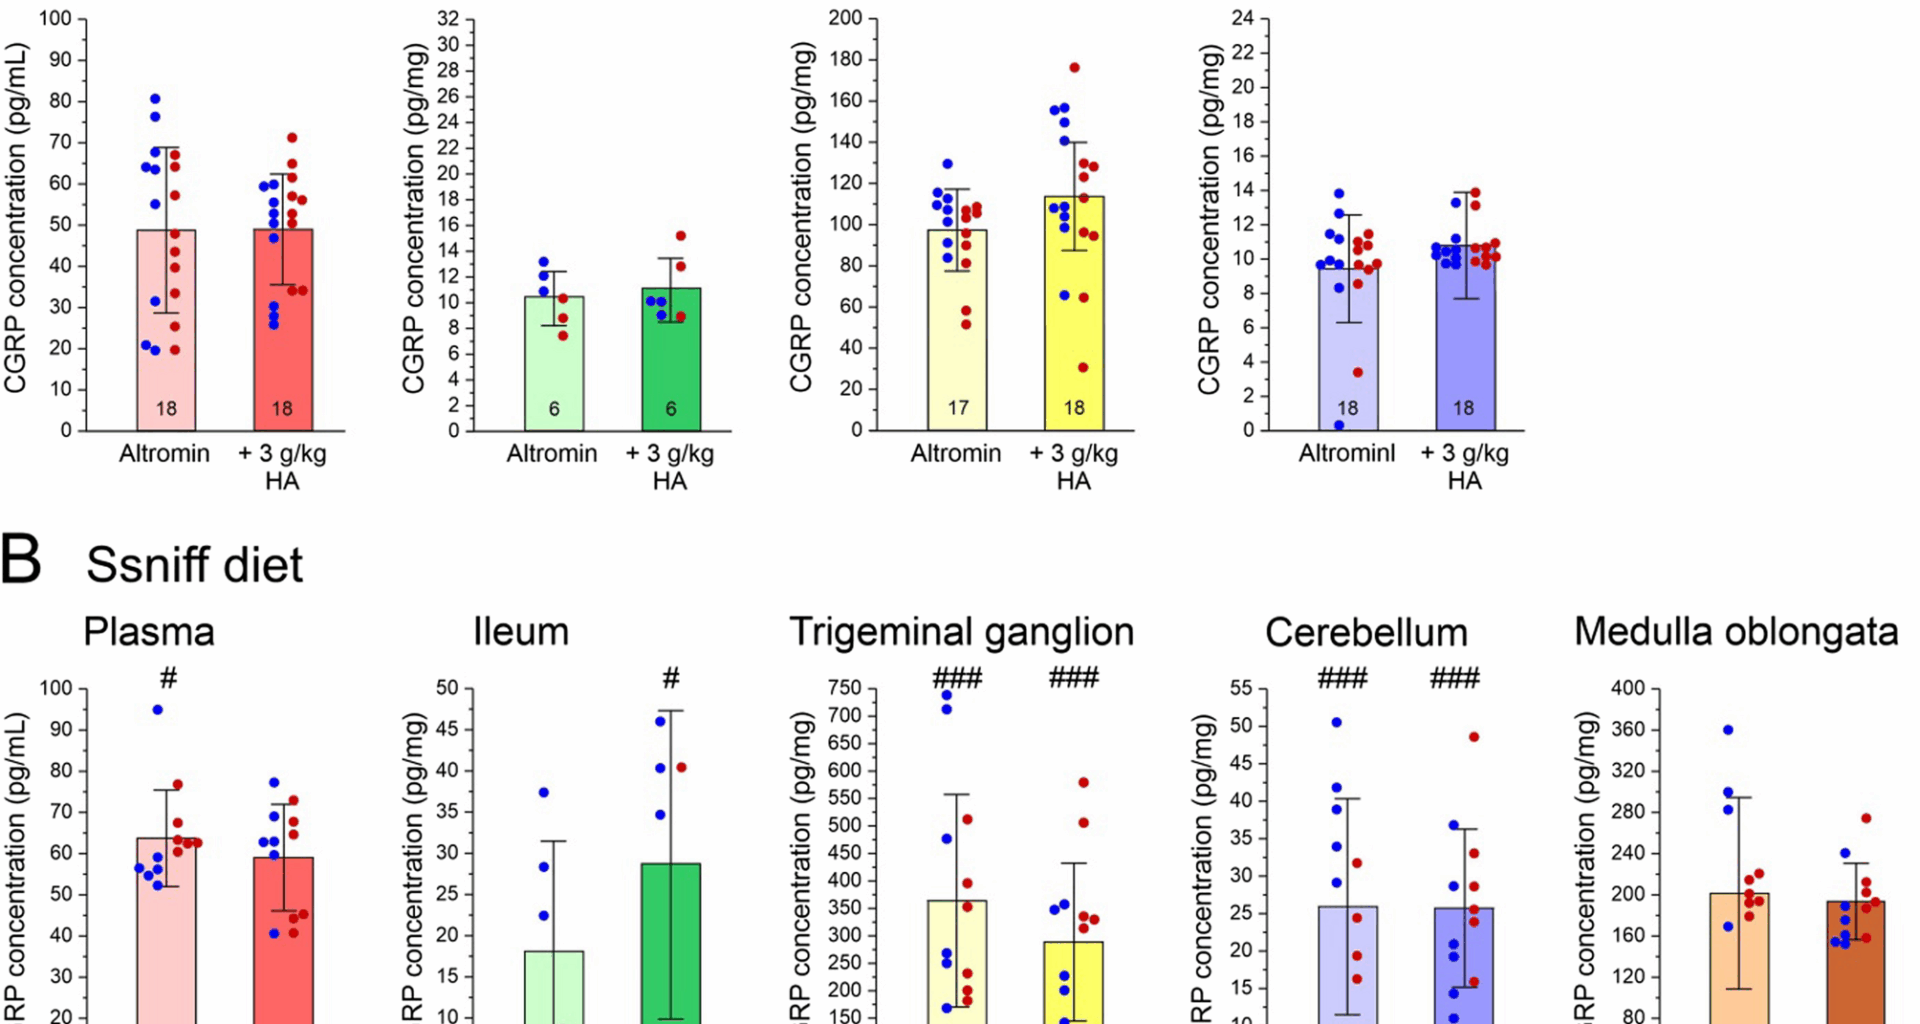
The CGRP concentration was determined in blood plasma, ileum and neural tissues (trigeminal ganglion, cerebellum and medulla oblongata) in mice of the control and the test groups. Generally, CGRP concentrations seemed to be higher in samples of Ssniff diet compared to Altromin diet fed mice. Factorial ANOVA with the factors “diet” (Altromin vs. Ssniff), “histamine” (control vs. test groups) and “sex” (males vs. females) indicated significant differences in the CGRP concentration between animals fed Altromin and animals fed Ssniff diet in plasma (F1,52 = 9.67, p < 0.005), trigeminal ganglion (F1,51 = 62.29, p < 0.0005), cerebellum (F1,52 = 65.65, p < 0.0005) and ileum (F1,16 = 14.45, p < 0.005), but there was no sex difference, apart from the ileum (F1,16 = 12.51, p < 0.005). In Fig. 1, data from animals supplied with Altromin and Ssniff are separately displayed. ANOVA extended by the Tukey HSD test showed no difference in the CGRP concentrations between corresponding control and high-histamine diets in any of the tissues. However, there are significant differences (p < 0.05) in the CGRP plasma levels between the control groups, CGRP concentrations in ileum between the high-histamine groups and highly significant differences (p < 0.0005) in neural tissues between Altromin and Ssniff fed mice. All significance values between specific groups are shown in Supplementary Table 1.
Fig. 1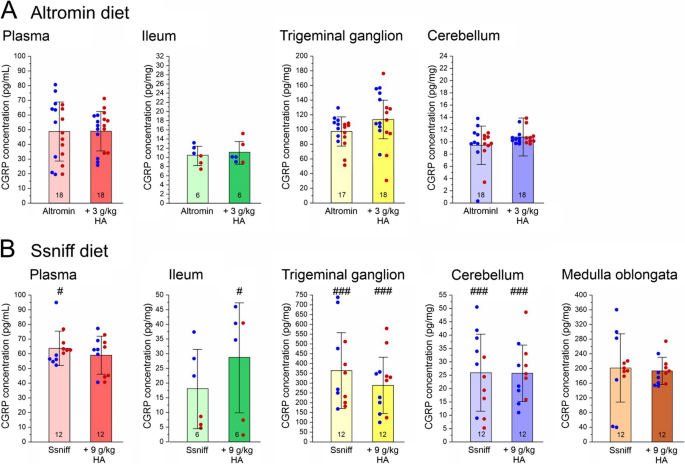
CGRP concentration in mouse plasma (pg/mL), homogenized ileum, trigeminal ganglion, cerebellum and medulla oblongata (pg/mg) in animals fed low or high histamine (HA) diets, i.e. Altromin with 3 g/kg histamine for 22–32 days A or Ssniff with 9 g/kg histamine for 19–22 days B. Since there was no significant sex difference, data of both sexes are pooled, but single values are shown as dots, blue for male and red for female animals. The CGRP concentration was significantly higher in tissues of animals fed Ssniff compared to Altromin (#, p < 0.05; ###, p < 0.0005), but there was no difference between corresponding control diets and high-histamine diets. Sample numbers are shown in the bars. All data are means ± SD
Correlation of CGRP and Histamine concentration in different tissues
Data from same experiments, in which CGRP content and histamine content was assessed, were subjected to correlation studies. There was a tendency towards a positive correlation between CGRP and histamine in plasma as well as in ileum and a tendency of a negative correlation in the trigeminal ganglia and the cerebellum, but not in the medulla (Table 2). Separating the data for sexes, values were similar except for the female medulla, in which a significant negative correlation was calculated (*, see Table 2). When separating the data for high histamine diet and control diet, the above tendencies were largely conserved (Table 2). Likewise, there was no clear difference when data were separated according to Altromin and Ssniff diet (not shown).
Table 2 Comparison of CGRP and Histamine concentrations in different tissues calculated by product moment correlation (n, number of samples; r, pearson’s product moment correlation coefficient; *, p < 0.05)Correlation of CGRP concentration in different tissues with plasma histamine levels
Assuming that plasma histamine levels may influence the CGRP concentration in neural and extraneural tissues, we compared the corresponding data from our previous histamine measurements with the current CGRP measurements [2]. There was a positive correlation between plasma histamine levels and CGRP concentration in the trigeminal ganglion, establishing a direct link between circulating histamine and CGRP production by trigeminal ganglion afferent neurons, as shown in Fig. 3. Separating the data for sexes, values were similar and significant either in males or females. A positive correlation existed also between plasma histamine level and CGRP concentration in the medulla oblongata but not in the ileum (Table 3). When separating the data for high-histamine diet and control diet (irrespective of Altromin or Ssniff diets), these results were conserved only in the samples of animals fed with the control diets (Table 3).
Table 3 Comparison of plasma Histamine levels and CGRP concentrations in different tissues calculated by product moment correlation (n, number of samples; r, pearson’s product moment correlation coefficient; *, p < 0.05)CGRP release from the dura mater
Figure 2 shows the results of the CGRP release experiments, including two basal release values followed by stimulated CGRP release. For clarity, the release data were separately displayed for Altromin and Ssniff diet (Fig. 3A, B) and subdivided according to control and high-histamine groups and sexes. Analysing all data with the factors “diet” (Altromin vs. Ssniff), “histamine” (control vs. test groups) and “sex” (males vs. females), repeated measures ANOVA indicated highly significant changes in CGRP release in the course of the experiment (F2,224 = 620.80, p < 5*10− 7), as expected, but also between animals fed Altromin and animals fed Ssniff (F1,112 = 26.01, p < 5*10− 6), as well as between the sexes (F1,112 = 21.01, p < 5*10− 5), but not between the control and high-histamine diets (F1,112 = 0.86, p = 0.36). Generally, stimulated CGRP release seemed to be higher in samples of mice supplied with Altromin diet compared to mice supplied with Ssniff diet; also in samples of male compared to female Altromin diet fed mice (Fig. 3A, B). Post-hoc analysis with the Tukey HSD test showed no significant differences in basal release values between any of the groups, while the increase in stimulated CGRP release compared to basal release values was highly significant in all groups, as expected (p < 5*10− 5). In addition, the stimulated release values were significantly different between sexes in the Altromin diet groups and between the male Altromin diet and the male Ssniff diet group (Fig. 3 and Supplementary Table 2).
Fig. 2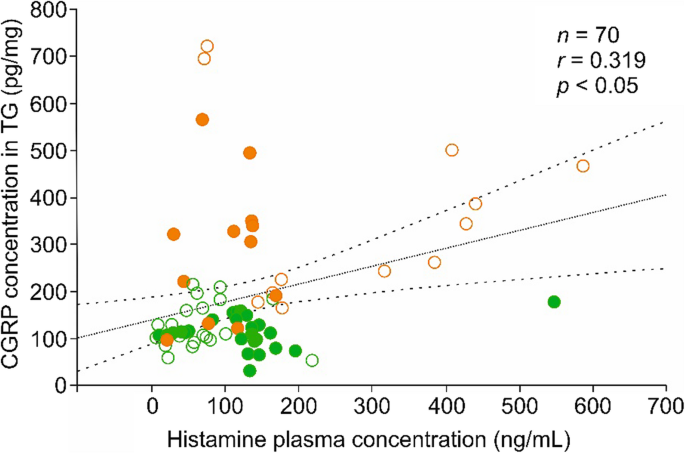
Linear correlation of the CGRP concentration in trigeminal ganglia (TG) with the histamine plasma concentration. Green symbols denote preparations from animals fed Altromin, orange symbols from animals fed Ssniff; open circles show preparations from control animals, filled circles from animals with high-histamine (3 g/kg or 9 g/kg) diets. Broken lines confine the 95% confidence interval
Fig. 3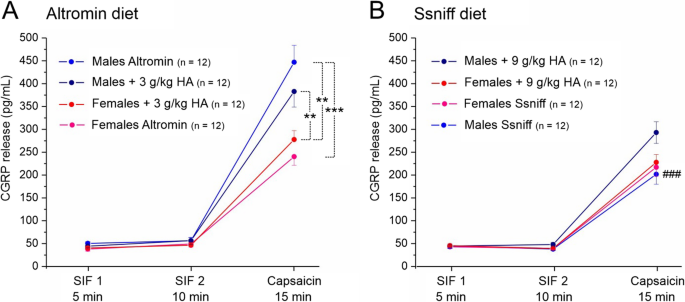
CGRP concentration in the superfusion solution of the hemisected skull preparations from animals fed Altromin control diet or Altromin plus 3 g/kg histamine A and Ssniff control diet or Ssniff plus 9 g/kg histamine B. Values are compared with repeated measures ANOVA followed by the Tukey post-hoc test and shown as means ± SEM; **, p < 0.005; ***, p < 0.0005; ###, p < 0.0005 compared between Altromin and Ssniff
Assuming that the sex difference may result from the different size of the animal’s heads and the dural surfaces, respectively, we also calculated the CGRP release relative to the individual body weight of the animals as a rough compensation for the different mass of the dura mater (Fig. 4A, B). Repeated measures ANOVA showed that the difference between Altromin and Ssniff diet was preserved (F1,112 = 23.97, p < 5*10− 6), while the sex difference was no longer significant (F1,112 = 0.46, p = 0.50), and there was a trend towards higher stimulated CGRP release values in high-histamine diet groups compared to control diet groups (F1,112 = 2.24, p = 0.14).
Fig. 4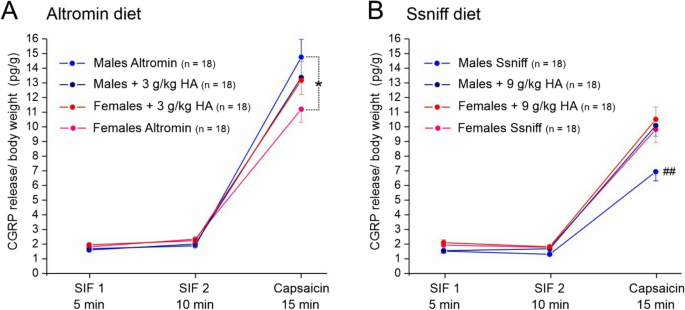
CGRP concentrations calculated relative to the body weight in hemisected skull preparations from animals fed with Altromin control diet or Altromin plus 3 g/kg histamine A and Ssniff control diet or Sniff plus 9 g/kg histamine B. Values are compared with repeated measures ANOVA followed by the Tukey post-hoc test and shown as means ± SEM; *, p < 0.05; ##, p < 0.005 compared between Altromin and Ssniff
Post-hoc analysis with the Tukey HSD test showed that stimulated release values were significantly different between sexes in mice supplied with Altromin control diet and between the Altromin control diet and the Ssniff control diet group in males, but there was no significant difference between any of the control and high-histamine groups (Fig. 4 and Supplementary Table 3).
Correlation of CGRP and Histamine release
In this post-hoc analysis, data from same experiments in 62 hemi-skulls from 31 animals supplied with Altromin control diet or Altromin plus 3 g/kg histamine (high histamine diet), in which CGRP release was followed by histamine release, were subjected to pairwise correlation analysis. There was no correlation of basal CGRP and histamine release without stimulation (n = 62, product-momentum correlation, r = 0.02 for SIF 1, r = 0.00 for SIF2) but a significant negative correlation between CGRP release stimulated by capsaicin and histamine release stimulated by compound 48/80 (r = −0.26, p < 0.05; Fig. 5). This negative correlation was entirely attributable to female animals (n = 26, r = −0.48, p < 0.05), while it was not seen in the male samples (n = 36, r = 0.02). When separating the data between low and high histamine diet (irrespective of Altromin or Ssniff), there was again no correlation in the basal release values, however, CGRP and histamine release was negatively correlated in the experiments of animals with control diet (n = 30, r = −0.45, p < 0.05) but not with high histamine diet (n = 32, r = −0.04).
Fig. 5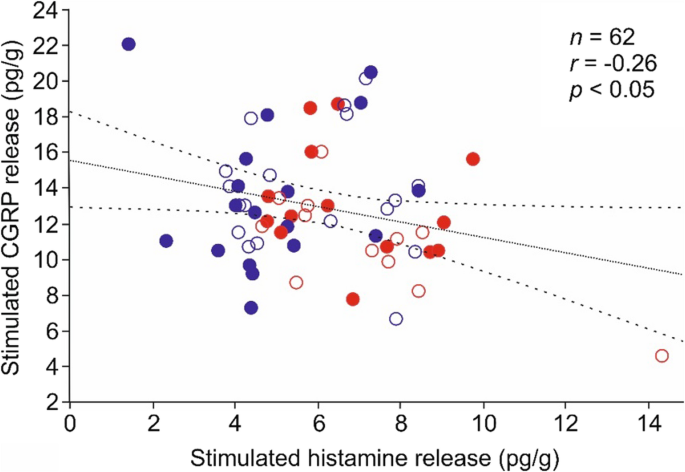
Linear correlation of CGRP release stimulated by capsaicin with histamine release stimulated by compound 48/80 in 62 hemi-skull preparations, normalized to the body weight of animals. Open circles denote preparations from animals fed Altromin control diet, filled circles Altromin plus 3 g/kg histamine. Blue circles denote preparations from male, red circles from female animals. Broken lines confine the 95% confidence interval