
Association between AIP and MACE
Over 1,642,106 person-years of follow-up, 19,140 MACE events occurred (incidence rate 11.66 per 1000 person-years; 95% CI: 11.49–11.82) (Supplementary Table S6 and Table S7). In the MACE analysis, the Kaplan-Meier curves (Fig. 2A) showed that the highest AIP quartile (Q4) consistently had a greater cumulative risk than lower AIP groups, indicating a close association between higher AIP and increased MACE risk, with a statistically significant difference (log-rank P < 0.001). In multivariable Cox models (Table 2), when modeled continuously, each 1 SD increase in AIP was associated with a 5% higher risk of MACE in Model 1, which adjusted for age and sex (HR = 1.05, 95% CI: 1.04–1.07, P < 0.001). In Model 2, which further adjusted for ethnicity, education, household income, employment status, and TDI, each 1 SD increase in AIP was associated with a 4% higher risk of MACE (1.04, 1.03–1.06, P < 0.001). In Model 3, which additionally adjusted for alcohol consumption, physical activity, sleep duration, LDL-C, SBP, and DBP, each 1 SD increase in AIP was associated with a 7% higher risk of MACE (1.07, 1.05–1.08, P < 0.001). In analyses by AIP quartiles, MACE risk rose with increasing AIP; in Model 3, Q3 vs. Q1 yielded HR = 1.09 (1.05–1.14, P < 0.001) and Q4 vs. Q1 yielded HR = 1.18 (1.13–1.23, P < 0.001). RCS analyses further demonstrated a significant nonlinear dose–response relationship between AIP and MACE risk (P overall < 0.001; P nonlinear = 0.002, k = 4), with an overall U-shaped pattern (Fig. 3A). Adding AIP to current 10-year CVD risk equations improved prediction and stratification (supplementary Table S8 and S9). In PREVENT, the C-index increased from 0.6592 to 0.6621 with a ΔC-index of 0.0029 (0.0022–0.0037), the continuous NRI was 0.0874 (0.0720–0.1020), the IDI was 0.0009 (0.0008–0.0010), and the categorical NRI improved at 5% and 10% thresholds with estimates of 0.0021 (0.001–0.003) and 0.0039 (0.0001–0.0070). In SCORE2, the C-index increased from 0.6514 to 0.6545 with a ΔC-index of 0.0031 (0.0023–0.0040), the continuous NRI was 0.0890 (0.0740–0.1041), the IDI was 0.0009 (0.0008–0.0010), and the categorical NRI improved at 5% and 10% with estimates of 0.0031 (0.0020–0.0042) and 0.0068 (0.0029–0.0107).
Fig. 2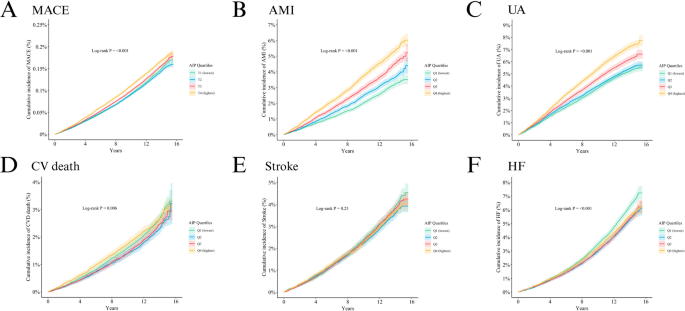
Kaplan–Meier curves depict the cumulative incidence of events: A MACE; B AMI; C UA; D CV death; E Stroke; F HF. MACE: major adverse cardiovascular events; AMI: acute myocardial infarction; UA: unstable angina; CV death: cardiovascular death; HF: heart failure.
Fig. 3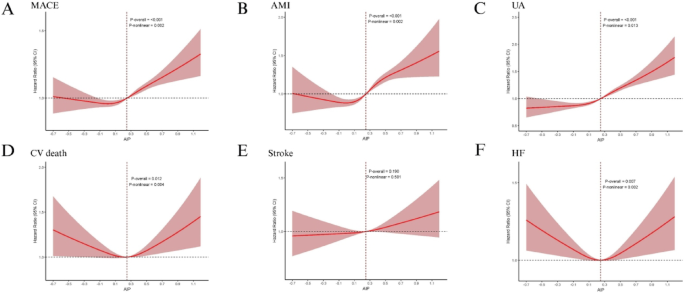
Restricted cubic spline models illustrate the dose–response relationships between AIP and MACE, as well as five secondary outcomes, in the MetS population: A MACE; B AMI; C UA; D CV death; E Stroke; F HF. AIP: atherogenic index of plasma; MetS: metabolic syndrome; MACE: major adverse cardiovascular events; AMI: acute myocardial infarction; UA: unstable angina; CV death: cardiovascular death; HF: heart failure
Association between AIP and AMI
Kaplan-Meier (K-M) analysis (Fig. 2B) showed that the cumulative risk of AMI in Q4 was consistently higher than in the other groups throughout follow-up (log-rank P < 0.001). Cox regression (Table 2) indicated a close association between higher AIP and increased AMI risk; per 1 SD increase in AIP, AMI risk rose by 16% (1.16, 1.12–1.19, P < 0.001). By quartiles, risk increased with AIP: Q2 (1.13, 1.03–1.23, P = 0.009), Q3 (1.29, 1.18–1.41, P < 0.001), and Q4 (1.48, 1.35–1.61, P < 0.001). RCS analysis (Fig. 3B) showed a nonlinear relationship between AIP and AMI risk (P overall < 0.001; P nonlinear = 0.002; k = 4), with an overall U-shaped curve.
Table 1 Baseline characteristics of participantsTable 2 Association between AIP and MACEAssociation between AIP and UA
KM curves (Fig. 2C) showed that the cumulative risk of UA in Q4 was significantly higher than in Q1 throughout follow-up (log-rank P < 0.001). As shown in Table 2, Cox regression indicated that each 1 SD increase in AIP was associated with a 16% higher risk of UA (1.16, 1.13–1.19, P < 0.001). In analyses by quartile, risk rose stepwise with higher AIP: Q2 vs. Q1 (1.10, 1.03–1.18, P = 0.007), Q3 (1.25, 1.16–1.34, P < 0.001), and Q4 (1.45, 1.36–1.56, P < 0.001) had higher risks. RCS analysis further revealed a J-shaped nonlinear association between AIP and UA risk (P overall < 0.001; P nonlinear = 0.013; k = 4; Fig. 3C).
Association between AIP and CV death
In the CV death analysis, KM curves showed that the cumulative risk in Q4 was higher than in Q1 (4.0% vs. 1.5%, log-rank P = 0.006; Fig. 2D). Cox regression (Table 2) indicated that no significant increase in risk was observed whether AIP was modeled as a continuous variable (per 1 SD: 1.01, 0.97–1.05, P = 0.540) or by quartiles. Compared with Q1, the HRs for Q2, Q3, and Q4 were 0.96 (0.86–1.07, P = 0.430), 0.97 (0.87–1.08, P = 0.560), and 1.06 (0.95–1.18, P = 0.280), respectively, none of which reached statistical significance. RCS analysis showed that both the overall and nonlinear terms were significant (P overall = 0.012; P nonlinear = 0.004; k = 3; Fig. 3D), but the curve displayed a U-shaped pattern.
Association between AIP and stroke
K–MKM analysis (Fig. 2E) showed no association between AIP and stroke risk (log-rank P = 0.250). As reported in Table 2, Cox analysis indicated that AIP was not significantly associated with stroke whether modeled continuously or by quartiles (per 1 SD: 1.03, 1.00–1.06; P = 0.089); in quartile analyses, the HRs for Q2, Q3, and Q4 vs. Q1 were 1.00 (0.91–1.09; P = 0.919), 1.06 (0.97–1.15; P = 0.196), and 1.05 (0.96–1.14; P = 0.337), respectively. RCS analysis likewise found no significant linear or nonlinear association (P overall = 0.190; P nonlinear = 0.501; k = 3; Fig. 3E), further supporting the absence of a significant relationship between AIP and stroke risk.
Association between AIP and HF
Risk analysis for HF showed a trend opposite to the other outcomes: KM curve analysis revealed that the lowest AIP quartile (Q1) had the highest cumulative risk, while the highest quartile (Q4) had the lowest. (log-rank P < 0.001; Fig. 2F). Cox regression indicated no significant association between AIP modeled continuously and HF risk (per 1 SD: 1.01, 0.98–1.03, P = 0.590), whereas in quartile analyses the Q2, Q3, and Q4 groups had HRs of 0.96 (0.90–1.03, P = 0.260), 0.96 (0.89–1.03, P = 0.250), and 1.02 (0.95–1.10, P = 0.510). RCS analysis demonstrated a significant U-shaped association between AIP and HF risk (P overall = 0.007; P nonlinear = 0.002; k = 3; Fig. 3F).
Subgroup and sensitivity analyses
Figure 4 presents effect modification of the associations between AIP and each outcome across subgroups. Overall, AIP was positively associated with MACE, AMI, and UA across most strata. Significant heterogeneity was observed for MACE by physical activity (P for interaction = 0.009), with progressively stronger associations from low to high activity (1.13 [1.02–1.25], 1.24 [1.15–1.35], and 1.31 [1.03–1.67]). For AMI, income modified the association (P for interaction = 0.049): HRs were 1.49 (1.22–1.82) in the low-income group, 1.93 (1.63–2.30) in the middle-income group, and 1.60 (1.16–2.20) in the high-income group. For stroke, heterogeneity was detected by the number of MetS components (P for interaction = 0.017) and by employment status (P for interaction = 0.013); the association was inverse in those with three components (0.77, 0.63–0.93) and null in those with four or five components, and point estimates were higher among the unemployed/retired than the employed, although subgroup-specific confidence intervals crossed 1 For HF, the association was significantly modified by MetS component count (P for interaction < 0.001), with inverse associations in those with three components (0.59,0.50–0.70) and four components (0.57, 0.47–0.70) but not in those with five components (1.28, 0.95–1.73). No other interactions reached statistical significance.
Fig. 4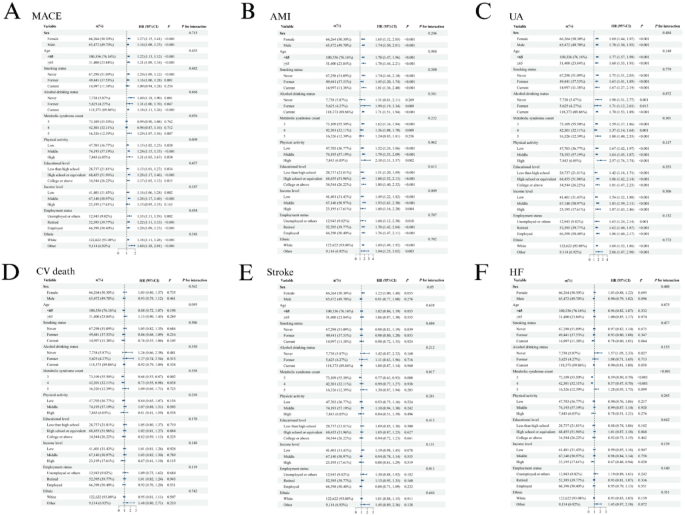
Forest plots of subgroup analyses for the association between AIP and MACE in MetS: A MACE; B AMI; C UA; D CV death; E Stroke; F HF. AIP: atherogenic index of plasma; MetS: metabolic syndrome; MACE: major adverse cardiovascular events; AMI: acute myocardial infarction; UA: unstable angina; CV death: cardiovascular death; HF: heart failure
The sensitivity analyses yielded results consistent with the primary analysis, confirming the robustness of our conclusions. After multiple imputation (m = 10), AIP remained positively and consistently associated with the outcome: the HR per 1 SD was 1.04,1.07, and per quantile increase (linear trend) was 1.04–1.07 (all P < 0.001; Supplementary Table S10). In quartile analyses, Q4 vs. Q1 was consistently significant (1.12–1.19, P < 0.001), Q3 vs. Q1 was significant in the fully adjusted model (1.09, P < 0.001; borderline in Models 1–2), and Q2 vs. Q1 was not significant (Supplementary Table S11). After excluding all individuals with missing covariate data, the results were likewise stable; after adjustment for covariates, the direction, magnitude, and significance of the associations between AIP and MACE were consistent with the primary analysis (supplementary Table S12). After excluding participants who developed MACE within the first two years of follow-up, the main results remained stable, with HRs and 95% CIs highly concordant and statistical preserved (P < 0.05; supplementary Table S13). In Fine–Gray models with death as the competing event, AIP remained positively associated with the subdistribution risk of MACE, AMI, and UA (sHR = 1.12 (1.06–1.18), 1.55 (1.37–1.75), and 1.25 (1.17–1.34), all P < 0.001), whereas associations with HF (0.95 (0.87–1.05), P = 0.350), CV death (0.88 (0.75–1.03), P = 0.116), and stroke (1.01 (0.88–1.15), P = 0.923) were not significant; the overall pattern was consistent with the primary analysis (Supplementary Table S14). At the hyperglycemia component level, agreement between HbA1c ≥ 39 mmol/mol and FPG ≥ 5.6/6.1 mmol/L was 80.3%/83.3% with κ = 0.294/0.284 (Supplementary Table S15). When the remaining components were integrated to form the full MetS diagnosis, agreement rose to 94.4%/95.3% with \(\:\kappa\:\) = 0.872/0.892 (Supplementary Table S16). With identical covariate adjustment, the association of MetS with 5-year MACE was essentially unchanged across definitions (HR 1.49–1.50, all P < 0.001; Supplementary Table S17), supporting robustness. After excluding participants who experienced MACE within the first 2 years of follow-up, the nonlinear association between AIP and MACE remained significant (Model 3 χ²=8.24, df = 3, P = 0.0413). (Supplementary Table. S18–20) Excluding all users of lipid-lowering, antihypertensive, and insulin therapies yielded similar results (χ²=6.55, df = 2, P = 0.038). Results were consistent under alternative exposure parameterizations: when modeled as a standardized continuous variable, each 1 SD increase in AIP was associated with 1.06 (1.04–1.08; P < 0.001); quartile analyses and median-of-quartile trend tests were significant; and in the full model the spline fit was superior to a linear term (χ²=8.24, df = 3, P = 0.041). Overall, the U or J-shaped association was robust to removing early events, excluding medication users, and varying exposure specification; moreover, after excluding medication users and early events the curve was U-shaped (Fig. S2 and S3). After additionally adjusting for statin use and chronic kidney disease on top of the fully adjusted Model 3, AIP showed no independent association with incident heart failure, consistent with the primary analysis (Supplementary Table. S21).