
Slow light-induced linewidth narrowing
The maximum achievable Q-factor (Q = ωc/κ) of resonators is primarily constrained by intrinsic loss mechanisms (κ > κi), which includes both the material absorption rate and imperfect mode confinement, resulting in coupling to undesired radiation modes. We overcome this limitation by adding a highly dispersive medium within the resonator, which leads to a significant reduction in the group velocity of light (vg). When introduced into a microcavity, this reduction increases the round-trip time of circulating light, effectively extending the cavity lifetime and enhancing the Q-factor. One might initially guess that such a slowdown would actually increase the coupling to lossy modes, as photons would interact with the absorptive medium and radiative decay channels for a longer time. However, Soljačić et al.36, demonstrated that dispersion not only reduces the group velocity but also slows down the coupling rates to lossy modes, thereby increasing the Q-factor, which scales as \(Q=\frac{c}{n{v}_{g}}(\frac{{\omega }_{c}}{\kappa })\), where n is the group index without a tranperancy window, and ωc is the cavity center in angular frequency.
In our system, we first investigate the bare cavity resonance of the microring resonators away from the Er absorption band (≈1534.5 nm). Two bus waveguides are used to evanescently couple light in and out of the ring cavity (Fig. 1a, b) with a rate of κext = 2π × 324 MHz each (Supplementary Note 2E), while the intrinsic loss rate was extracted to be κi = 2π × 471 MHz, resulting in the total κ = 2π × 1.12 GHz or a Q-factor of 1.8 × 10⁵ (Fig. 1d). We further measured similar κi for identically fabricated devices with no Er, validating that the loss rates are mainly limited by the sidewall roughness of waveguides (Supplementary Note 2E). The 300 μm diameter of our resonators means we are guaranteed at least 2 resonances within the ~158 GHz wide Er absorption band on the I15/2 − I13/2 transition centered at 1531.6 nm. The large inhomogeneous linewidth is due to charge compensation and disorder created when Er substitutes for lithium, as well as the intrinsic disorder in congruent lithium niobate. We use devices with heavy erbium doping (0.5%) to achieve high optical depth. The resulting Er absorption introduces an additional loss rate of κEr = 2π × 16 GHz (Supplementary Note 2E), which dominates both intrinsic and coupling losses, leading to significantly broadened and undercoupled resonances within the erbium absorption bandwidth. We next perform SHB at the center of the cavity resonance by optically pumping a spectrally narrow subset Er ions (see Supplementary Fig. 1 for experimental setup details).
Fig. 1: Slow light induced linewidth narrowing.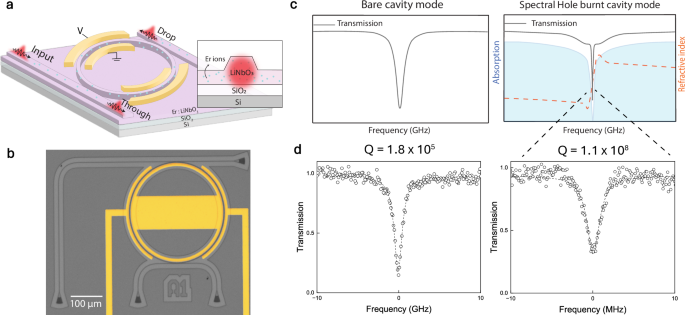
a Schematic of an Er:TFLN ring resonator cavity coupled to through and drop ports with electro-optic tuning. Inset: schematic cross-sectional view of the waveguide. b Optical image of the fabricated microring resonator, which was loaded onto a stage at a temperature of ~2 K and with an estimated magnetic field B = 0.1–0.2 T aligned along the c-axis of the TFLN. The gold colored regions show the electrodes utilized in the EO tuning. Light was coupled in and out using grating couplers and an additional drop port at the top is used for the slow light measurements. c Schematics of a bare cavity mode with no absorption (left) and ultra high-Q resonator mode (right) formed in a narrow transparency window in a region of high absorption that creates a highly dispersive medium with ultra-low group velocity. d Measured transmission through a resonance tuned away from the Er absorption (left) and a narrowed resonance (right) showing narrowing by nearly three orders of magnitude due to preparing a spectral hole in a region of high absorption.
This results in a narrow transparent window, or spectral hole, in the absorption profile at the frequency of the burn pulse. The width of the spectral hole is fundamentally limited to be larger than twice the measured homogeneous linewidth, Δhole/2π ≥ 490 kHz (Supplementary Note 2C). However, due to power broadening the holes are much broader, estimated to be between 30 and 100 MHz for the range of optical powers used here (Supplementary Note 2F), which is still much narrower than the resonator κ even away from the Er absorption. The narrow transparency window is accompanied by strong dispersion, resulting in a dramatically reduced group velocity and a longer time for the photons to finish each round trip, described by the expression nvg/c = Δhole/κEr. Consequently, this results in a narrowed resonance mode at the frequency of the spectral hole. Since the decay rate of the spectral hole is slow compared to all other frequency scales (<10 kHz), we can ignore any hole dynamics beyond the approximately flat spontaneous emission background we observe during our measurements. We note that moving to lower temperatures and/or higher magnetic fields would extend the lifetime of our spectral holes beyond the Er optical lifetime37,38 and enable operation without this spontaneous emission background. We measure the transmission as a function of detuning by sending a weak probe pulse 4 μs after the burn pulse and detecting at the through port of the device. We observe a sharp Lorentzian dip at the burn frequency with a width of 1.9 MHz, corresponding to a Q-factor of 1.1 × 10⁸ (Fig. 2a). Furthermore, we measured the output at the drop port and observed a corresponding peak, consistent with the microring resonator model.
Fig. 2: Extending cavity lifetime.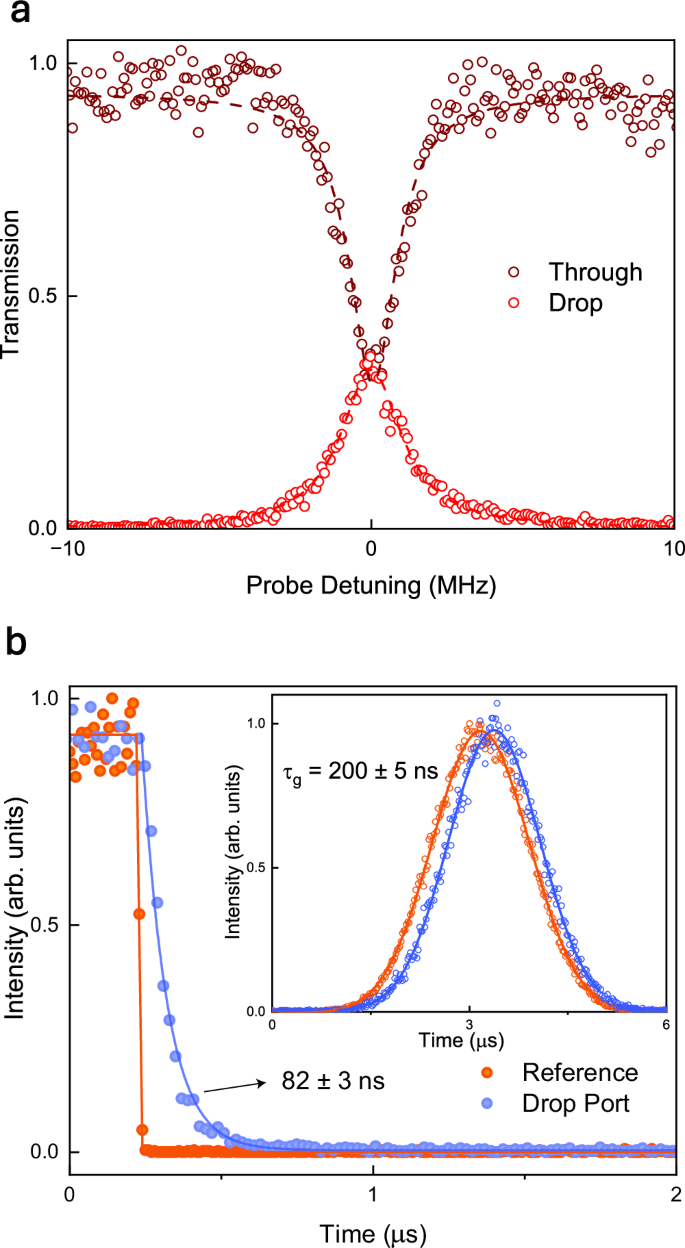
a The narrowed resonance measured at the through port (brown) and the drop port (red). b The extended ring down time of the cavity measured through the drop port (blue), showcasing a significantly longer time when compared with the bare cavity mode (red) measured at a resonance off the absorption. Inset: delay of a narrowband Gaussian pulse measured through the drop port.
To verify that the Q-factor extends the cavity lifetime, we perform time-domain measurements to measure the ringdown time. Specifically, we send an optical square pulse and measure the decaying tail at the falling edge at the drop port (“Methods”). Our measurements reveal that the narrowed cavity mode exhibits a lifetime of 82 ns, whereas the bare cavity (in the absence of absorption) has an expected lifetime of 0.14 ns, below the resolution of our detection scheme (Fig. 2b). This significant increase further validates the formation of a high-Q resonance mode and confirms the extended cavity lifetime.
To further investigate the slow light effect, we measure the resonant group delay experienced by a Gaussian pulse. We send a narrowband, 1.5 μs Gaussian pulse through the resonance and observe a 200 ns delay compared to the bare cavity mode case (Fig. 2b inset). This corresponds to a group velocity reduced to nearly 2 × 10⁵ m/s in the ring waveguide, ~700× slower than the speed of light in the LN waveguide. This result aligns closely with our theoretical estimates (Eq. S41) as well as the scaling of the Q-factor compared to the bare cavity Q. The delay could be further extended by employing a coupled resonator optical waveguide architecture, which can provide a linear scaling of pulse delay with the number of coupled rings39. The current delays represent some of the longest optical pulse delays achievable on an integrated chip, offering promising opportunities for scalable quantum memory and quantum information applications.
Electro-optic tuning
We can think of our slow-light resonances as arising from the interference of a spectrally narrow resonant mode (the spectral hole) and a broader continuum (the damped resonator mode). Such a system is described by a Fano profile40, which is apparent from the rigorous theoretical description of our system in the Supplementary Note 1C. A Fano profile will shift and become asymmetric as the detuning increases between the narrow and broad resonances. In our case, we can identify the Fano asymmetry parameter as a function of the detuning between the burn laser frequency (ωl) and the bare cavity mode (ωc):
$$q=\frac{{\omega }_{c}-{\omega }_{l}}{\frac{\kappa }{2}+\frac{{\kappa }_{{{\rm{Er}}}}}{2}}.$$
(1)
In Fig. 3a we see a clear shift of the experimentally measured resonance as we detune the burn laser from the center of the bare cavity mode. The center of the slow light mode matches our theory predictions, though the shape deviates due to the uncertainties in the extracted parameters and the effects of residual absorption in the bus waveguide. We see clear Fano shapes when the optical depth is lower and this residual absorption is smaller (see Supplementary Note 2H).
Fig. 3: Fano lineshape and EO tuning.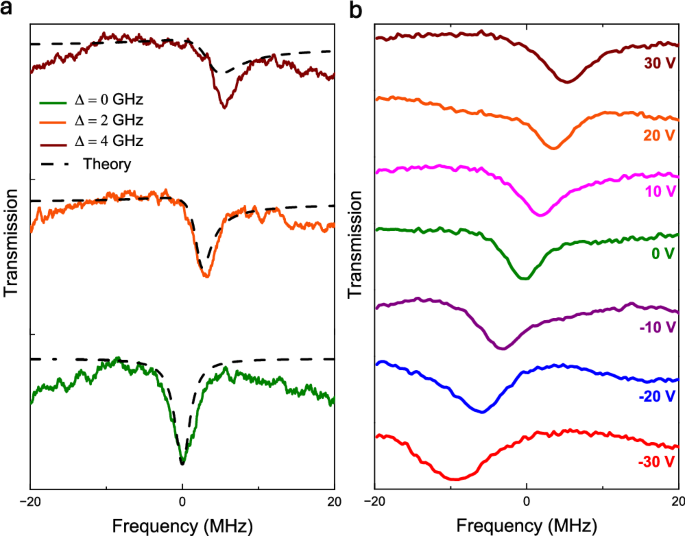
a Experimental data and theoretical model showing the slow-light resonance at different burn laser detunings with respect to the bare cavity resonance. b The bare cavity resonance is tuned electro-optically while keeping the burn frequency constant, demonstrating dynamic spectral tunability of the narrow resonance.
In addition to tuning the burn laser frequency, we can alternatively manipulate the bare cavity mode itself to shift the resonance. The high χ(2) nonlinearity of lithium niobate (LN) provides an effective mechanism for this control. By applying a DC voltage across the resonator, we electro-optically shift the bare cavity resonance frequency by a rate of 0.12 GHz V−1 (Supplementary Note 2G), thereby tuning the slow-light mode. As shown in Fig. 3b, we observe a voltage-induced tuning range of ≈15 MHz, limited by our electro-optic setup. We also note that the system exhibits a broader spectral response at higher applied voltages, a characteristic feature of the Fano lineshape under increased detuning.
These high-Q resonator modes exhibit some of the narrowest filter responses demonstrated in an integrated photonic platform. Combined with the fast electro-optic tunability of LN (>GHz), this approach enables a wide range of applications in dynamically reconfigurable filtering, high-speed photonic switching, and adaptive on-chip laser stabilization.
Modified Bloch equation model
We next examine the dependence of resonance linewidth on input pump power (Pin), as illustrated in Fig. 4. To provide deeper insight, our model diverges from heuristic group velocity approach used earlier and instead considers a more fundamental approach of analyzing a cavity coupled to an atomic ensemble (Supplementary Note 1)41. One might expect the standard optical Bloch equations, incorporating experimentally extracted system parameters including the spontaneous decay rate (γs), decoherence rate (γ), cavity loss rates (κi, κext, κEr), and the single-photon coupling rate (g) to explain the resonance width (see Supplementary Note 2A for details). In this model the slow light induced narrowed resonance loss rate (κSL) would be expected to follow the form:
$${\kappa }_{{{\rm{SL}}}}=\left(\frac{{\Delta }_{{{\rm{hole}}}}}{{\kappa }_{{{\rm{Er}}}}}\right)\kappa$$
(2)
where the spectral hole can be expressed as \({\Delta }_{{{\rm{hole}}}}=2\Omega \sqrt{\frac{\gamma }{{\gamma }_{s}}}\), including the Rabi frequency given by \(\Omega=\frac{2g\sqrt{{\kappa }_{{{\rm{ext}}}}}}{\kappa /2}\sqrt{\frac{{P}_{{{\rm{in}}}}}{\hslash {\omega }_{c}}}\). Since, the group velocity can be expressed as nvg/c = Δhole/κEr, the theory naturally reveals the scaling of the cavity linewidth (κ) with the group velocity.
Fig. 4: Modified Bloch Equation model.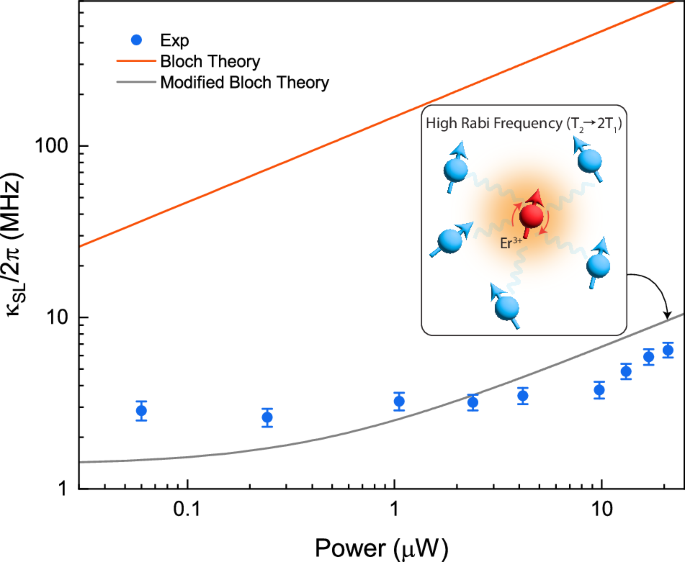
The power (Pin)-dependent linewidth of the resonator at zero detuning from the bare cavity resonance. The data (blue points) showcases a stark deviation from the standard Bloch theory (red line). The modified Bloch theory (gray line) matches the data much better, indicating a lower decoherence rate at higher power. Error bars represent the standard errors associated with the fits. The inset illustrates the physical mechanism behind the approach, where the emitter is decoupled from the spin bath due to the large Rabi frequencies in the cavity.
The simple Bloch model exhibits a striking discrepancy with the experimentally observed linewidths (Fig. 4), which are up to two orders of magnitude narrower than the theoretical prediction. This deviation cannot be attributed solely to experimental uncertainties in parameter extraction (see Supplementary Note 2A) and, furthermore, the observed linewidths do not follow the square root dependence on optical power predicted by the Bloch model.
The failure of the conventional Bloch equations stems from the underlying assumption that the Lindbladian describing the dephasing and decoherence is independent of the optical field strength. However, prior investigations of rare-earth-doped solids such as Pr3+: LaF3 have demonstrated that the dephasing induced by a dynamic bath is effectively suppressed when the Rabi oscillation frequency at high intensity exceeds the correlation time τc of the bath42.
In our system, the erbium ions couple to a dense nuclear spin bath composed of lithium and niobium nuclear spins as well electron spins of other erbium ions, a phonon bath, and an electronic bath consisting of charge traps and charged two level systems. Irrespective of the microscopic details of the bath, it can modeled as stochastic process with a correlation time τc. The bath and, consequently, the corresponding stochastic process, can be assumed to be Markovian when the condition \(\sqrt{\gamma {\tau }_{c}} < 1\) is satisfied. At an intuitive level, fast Rabi flopping results in time averaging of the dephasing, similar to continuous dynamical decoupling.
Reaching the requisite Rabi frequencies to observe this effect in bulk rare-earth-doped materials is difficult, as the optical intensity required is typically out of reach. However, in a nanophotonic waveguide with sub-micron mode area (Amode = 0.78 μm2), the local intensity is greatly enhanced. Additionally, in a ring resonator configuration, the circulating optical power is further amplified. For instance, an input power Pin = 21 μW in the bus waveguide leads to a Rabi Frequency Ω = 2π × 106 MHz in the ring resonator. To account for this phenomenon, we introduce a dephasing rate described by the modified Bloch equation formalism (γm)43,44,45, given by:
$${\gamma }_{{{\rm{m}}}}=\frac{\gamma }{1+{(\Omega {\tau }_{c})}^{2}}+\frac{{\gamma }_{s}}{2}$$
(3)
At sufficiently high optical power (Ω ≫ 1/τc) the dephasing rate asymptotically approaches the spontaneous emission limit (γm → γs/2), thereby eliminating spin-bath-induced broadening. By incorporating γm and fitting the experimental data, we extract a correlation time of τc ≈ 1 μs. This value lies well within the range of typical correlation times previously observed in Er:LN systems37 and satisfies the Markovianity condition \(\sqrt{\gamma {\tau }_{c}} < 1\). With this correction, the theoretical prediction aligns closely with the experimental data, effectively resolving the discrepancy encountered with the conventional model. It is also important to note that the experimental data also aligns qualitatively with the trend predicted by the modified theory, deviating from the standard saturable absorber power broadening \({\kappa }_{SL}\propto \sqrt{{P}_{{{\rm{in}}}}}\) dependence expected from the Bloch model. The modification accounts for the significant decoherence narrowing at higher input power, suppressing the linewidth increase from the power-broadening term. This finding is consistent with prior studies42,44 demonstrating that optical linewidths in impurity-ion solids can exhibit a field-dependent narrowing due to suppression of local environmental fluctuations, but goes beyond past demonstrations that could not reach such high Rabi rates. This modified model is vital for understanding the limits on (and possibilities for) atomic frequency comb storage in nanophotonic devices, as it dramatically changes the optical power required to prepare a high-resolution comb in the presence of a dephasing spin bath.