
We employed differential photometry to minimize the effects of atmospheric extinction on magnitude measurements. Due to variations in rocket body attitude and position during observations, the apparent magnitudes cannot be directly compared and must be normalized to a standardized brightness. The standardization process involves two main corrections applied to the raw photometric data. The first is the slant range correction, which adjusts all measured brightness values to a fixed slant range of 10,000 km, thereby eliminating the brightness attenuation caused by variations in the observer-target distance. Second, an attitude correction standardizes the brightness to a fixed viewing geometry, specifically with both the solar incidence angle and emergence angle set to 45°. This correction does not model the physical reflectance of the surface but provides a common geometric reference to ensure comparability among different observations. The attitude correction requires knowledge of the target’s maximum brightness within its light curve cycle. Therefore, it is essential to capture at least one complete light curve during observations to enable accurate correction.
Observation
Observations were conducted in target tracking mode. This mode elongates the images of background stars (Fig. 3), thereby reducing the photometric accuracy of reference stars. So we ceased tracking immediately after acquiring the target’s light curve and subsequently captured standard photometric stars within the same or nearby fields using identical exposure settings. To minimize photometric errors caused by significant positional shifts, we preferentially observed near apogee, where their apparent motion is minimal. This strategy is particularly important because capturing a complete light curve in GTO often requires extended observation times, sometimes up to several tens of minutes. No filters were used during observations to maximize photon throughput and enhance the Signal-to-Noise Ratio (SNR), as the primary focus of this study was on overall brightness variations rather than spectral characteristics.
Image reduction
We first performed basic astronomical image reduction for all captured images. During observations, camera cooling was enabled, with the cooling temperature set to -20 °C. The dark current of the QHY600 at -20°C is low, at 0.0022 e-/pixel/sec15, and the exposure time is 4 s, so the effect of dark current on the images was not considered. The QHY600 camera is configured with an overscan region. Bias correction was applied to all images using the column-averaged value of the overscan area as the background value. By taking twilight flats, we performed flat-field correction on the images of all targets and standard stars to improve photometric accuracy.
Fig. 3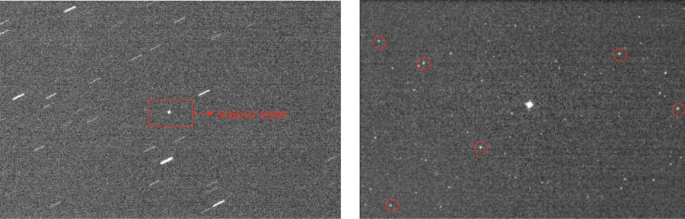
Typical observational images of the rocket body. Left: Target image acquired in tracking mode, where the rocket body appears as a point source while background stars are elongated. Right: Image of reference stars captured in sidereal tracking mode at nearby sky field after tracking the object, with selected reference stars indicated by red circles.
Photometry
After completing the image reduction, we used SExtractor16 to extract the positions and fluxes of all sources, including both the targets and the standard stars. Because the observations were conducted in target-tracking mode, the rocket bodies appear as point sources in the images, while background stars are elongated into trails (Fig. 7). By analyzing parameters such as SNR and ellipticity, the rocket bodies can be effectively distinguished from the star trails. Astrometric calibration and source cross-matching were performed on the reference star images. Several high-SNR stars were selected to calculate the photometric zero point and subsequently determine the apparent magnitudes of the targets. Given that the quantum efficiency curve of the QHY600 camera15 closely matches that of the Gaia \(G_{bp}\) bandpass17, we adopted the \(G_{bp}\) magnitudes as the reference standard. Figure 4 presents the light curves of all targets listed in Table 1. For subsequent photometric normalization, we used the peak brightness value within each light curve.
Fig. 4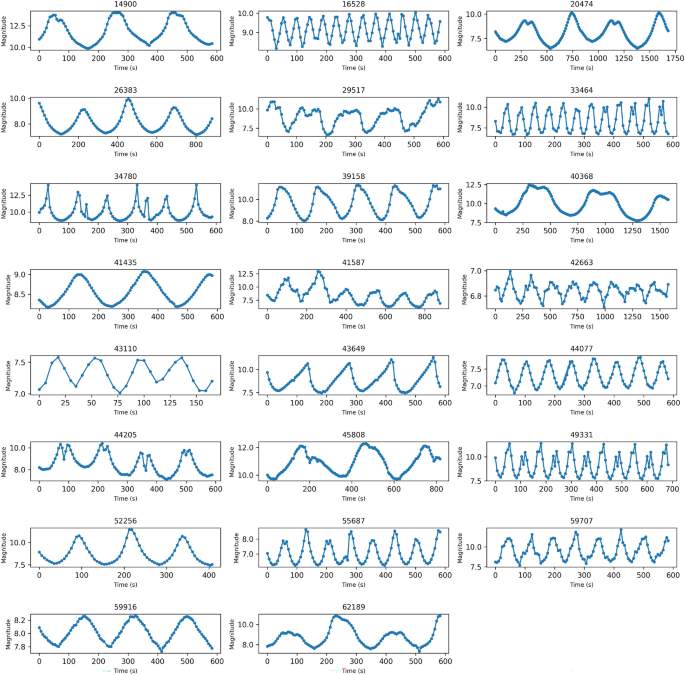
Light curves of all 23 targets, showing that all observations cover sufficient periods with good photometric precision.
Brightness calibration
During the observations, the targets were at different sun-satellite-observer phase angles, and their slant distances and attitudes varied. To accurately represent the variation in brightness of the CZ-3 series R/B with respect to their time in orbit, the target brightness obtained under different observation conditions must be standardized. This involves calibrating the brightness to a standard slant ranges of 10,000 km, with both the incident and exit angles set to 45°. According to the Lambertian plane model, the apparent magnitude of the reflected light observed from the rocket body can be expressed using the following formula (1)18:
$$\begin{aligned} \left\{ \begin{aligned}&F(\theta _i, \theta _r) = \frac{I(\theta _i, \theta _r)}{r_o^2} = F_0 \frac{\rho A}{\pi r_o^2} \cos (\theta _i) \cos (\theta _r) \\&m = -26.74 – 2.5 \log _{10} \left[ \frac{\rho A}{\pi r_o^2} \cos (\theta _i) \cos (\theta _r) \right] \end{aligned} \right. \end{aligned}$$
(1)
Where F is reflected luminous flux, I is incident light intensity, \(\rho\) is panel reflectance, \(F_0\) is incident luminous flux, \(\theta _i\)is incident angle, \(\theta _r\) is emergence angle, A is surface area, \(r_o\) is the distance between the target and the observation station, m is the apparent magnitude of the target.
Since the slant range to the targets during observations is generally greater than 10,000 km, the effect of ground-reflected light on the brightness is neglected in this study. The CZ-3 series R/Bs have the same shapes and sizes. After standardizing the calibration for distance, incident angle, and emergence angle, the brightness variations mainly reflect changes in surface reflectivity. Calculating the incidence angle and emergence angle of the target requires obtaining its attitude information. In light-curve-based rotation analysis of space debris, it is generally assumed that in each tumbling cycle there exists a moment when the incident and reflection angles are equal, leading to specular reflection and the peak observed brightness19,20,21. Therefore, in the light curves of the CZ-3 series R/B, the maximum brightness typically corresponds to the moment when the reflective surface faces the largest side of the cylindrical rocket body. At this point, light reflection is predominantly specular, with the incidence angle equal to the emergence angle, as shown in Fig. 5:
Fig. 5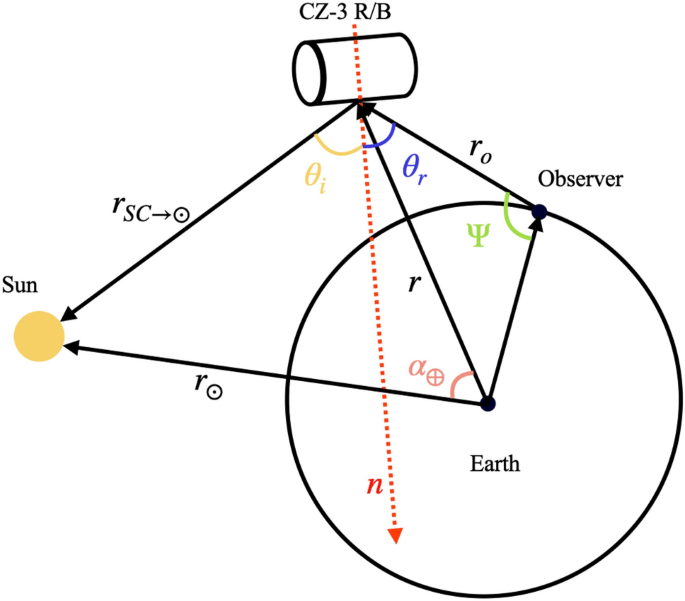
Schematic diagram of the sun-target-observation station geometry at the maximum brightness of the rocket body, where \(\theta _i\) = \(\theta _r\).
In this case, as described in Eq. (2), the calculation of the incidence and exit angles can be simplified by calculating the target-sun vector and the target-observer vector, thereby streamlining the computational process.
$$\begin{aligned} \theta _i = \theta _r, \quad \cos (2\theta _i) = \frac{{\bf r}_{SC \rightarrow \odot } \cdot {\bf r}_o}{|{\bf r}_{SC \rightarrow \odot }| |{\bf r}_o|} = 2\cos ^2(\theta _i) – 1 \end{aligned}$$
(2)
Since different targets were observed at varying phase angles, their brightness measurements cannot be directly compared. To eliminate the influence of observational geometry, we adopted the assumption defined in Equation (2)—that the condition of equal incidence and emergence angles is satisfied at the moment of maximum brightness—to normalize all brightness values to a reference geometry with both angles set to 45°. Based on the first expression of Eq. (1), and assuming identical target distance, surface area, and reflectance, only the angular dependence of brightness is considered. By combining this with the fundamental assumption that the incidence angle equals the emergence angle during specular reflection, the corresponding angular normalization factor can be derived as follows:
$$\begin{aligned} f_{\text {PA}} =F(\frac{\pi }{4},\frac{\pi }{4})/F(\theta _i, \theta _r)= F(\frac{\pi }{4},\frac{\pi }{4})/F(\theta _i, \theta _i) = \left[ 2\cos ^2\left( \theta _i \right) \right] ^{-1} \end{aligned}$$
(3)
To correct the brightness of all targets to a range of 10,000 kilometers, the range correction factor \(f_{\text {SD}}\) is defined as:
$$\begin{aligned} f_{\text {SD}} = \left( \frac{\Vert {\bf r}_o \Vert }{10000} \right) ^2 \end{aligned}$$
(4)
Subsequently, using Eq. (5), the brightness of all targets was normalized to a comparable reference condition, corresponding to an incidence angle and emergence angle of 45° and a slant distance of 10,000 km. Under these standardized conditions, since the rocket bodies of the same series share identical structural configurations,the brightness variations among different targets thus reflect changes in their overall albedo, thereby indicating the temporal evolution of their brightness.
$$\begin{aligned} F_{\text {cal}} = 10^{\frac{-2x}{5}} \cdot f_{_{\text {PA}}} \cdot f_{_{\text {SD}}}, \quad x \in \{m\} \end{aligned}$$
(5)
Finally, the brightness of the oldest target within each rocket series was used as the unit brightness. Using Equation (6), the brightness of all targets was converted into relative brightness, providing a more direct representation of the magnitude of brightness variation.
$$\begin{aligned} F_{\text {std}} = \frac{F_{\text {cal}}}{F_{14900}} \end{aligned}$$
(6)
Where \(F_{\text {cal}}\) is the calibrated brightness, \(F_{\text {std}}\) is the standardized brightness of all targets, \(F_{14900}\) is the calibrated brightness of the oldest target (NORAD ID :14900), and \(\{m\}\) is the set of target apparent magnitudes.