
Identification of AP2/ERF family in perennial ryegrass
Firstly, we obtained 189 candidate genes of the AP2/ERF family through the perennial ryegrass genomic database. All protein sequences of these putative LpAP2/ERF genes were further confirmed using the SMART and NCBI-CDD web servers to verify the presence of the AP2/ERF domain. Ultimately, 172 putative LpAP2/ERF genes were identified as encoding proteins with complete AP2/ERF domain(s) (Table S1). Gene characteristics, including coding sequence (CDS) length, protein molecular weight (MW), isoelectric point (pI), and conserved domain, were analyzed (Table S1). Analysis of CDS lengths showed that LpAP2/ERF106 encoded the largest protein, with 4320 bp (1439 amino acids), while LpAP2/ERF061 encoded the smallest protein, with 312 bp (103 amino acids). The isoelectric point (pI) of these proteins ranged from 4.50 (LpAP2/ERF109) to 10.61 (LpAP2/ERF027), and the molecular weight (MW) ranged from 11,658.09 kDa (LpAP2/ERF061) to 16,0497.00 kDa (LpAP2/ERF106). Additionally, predicted subcellular localization analysis indicated that the majority of LpAP2/ERF TFs (137 genes) were localized to the nucleus, while 12 genes were localized to chloroplasts. The remaining genes were predicted to be localized to cytoplasm (21) and extracellular space (2).
Phylogenetic relationship, conserved motif, and gene structure analysis
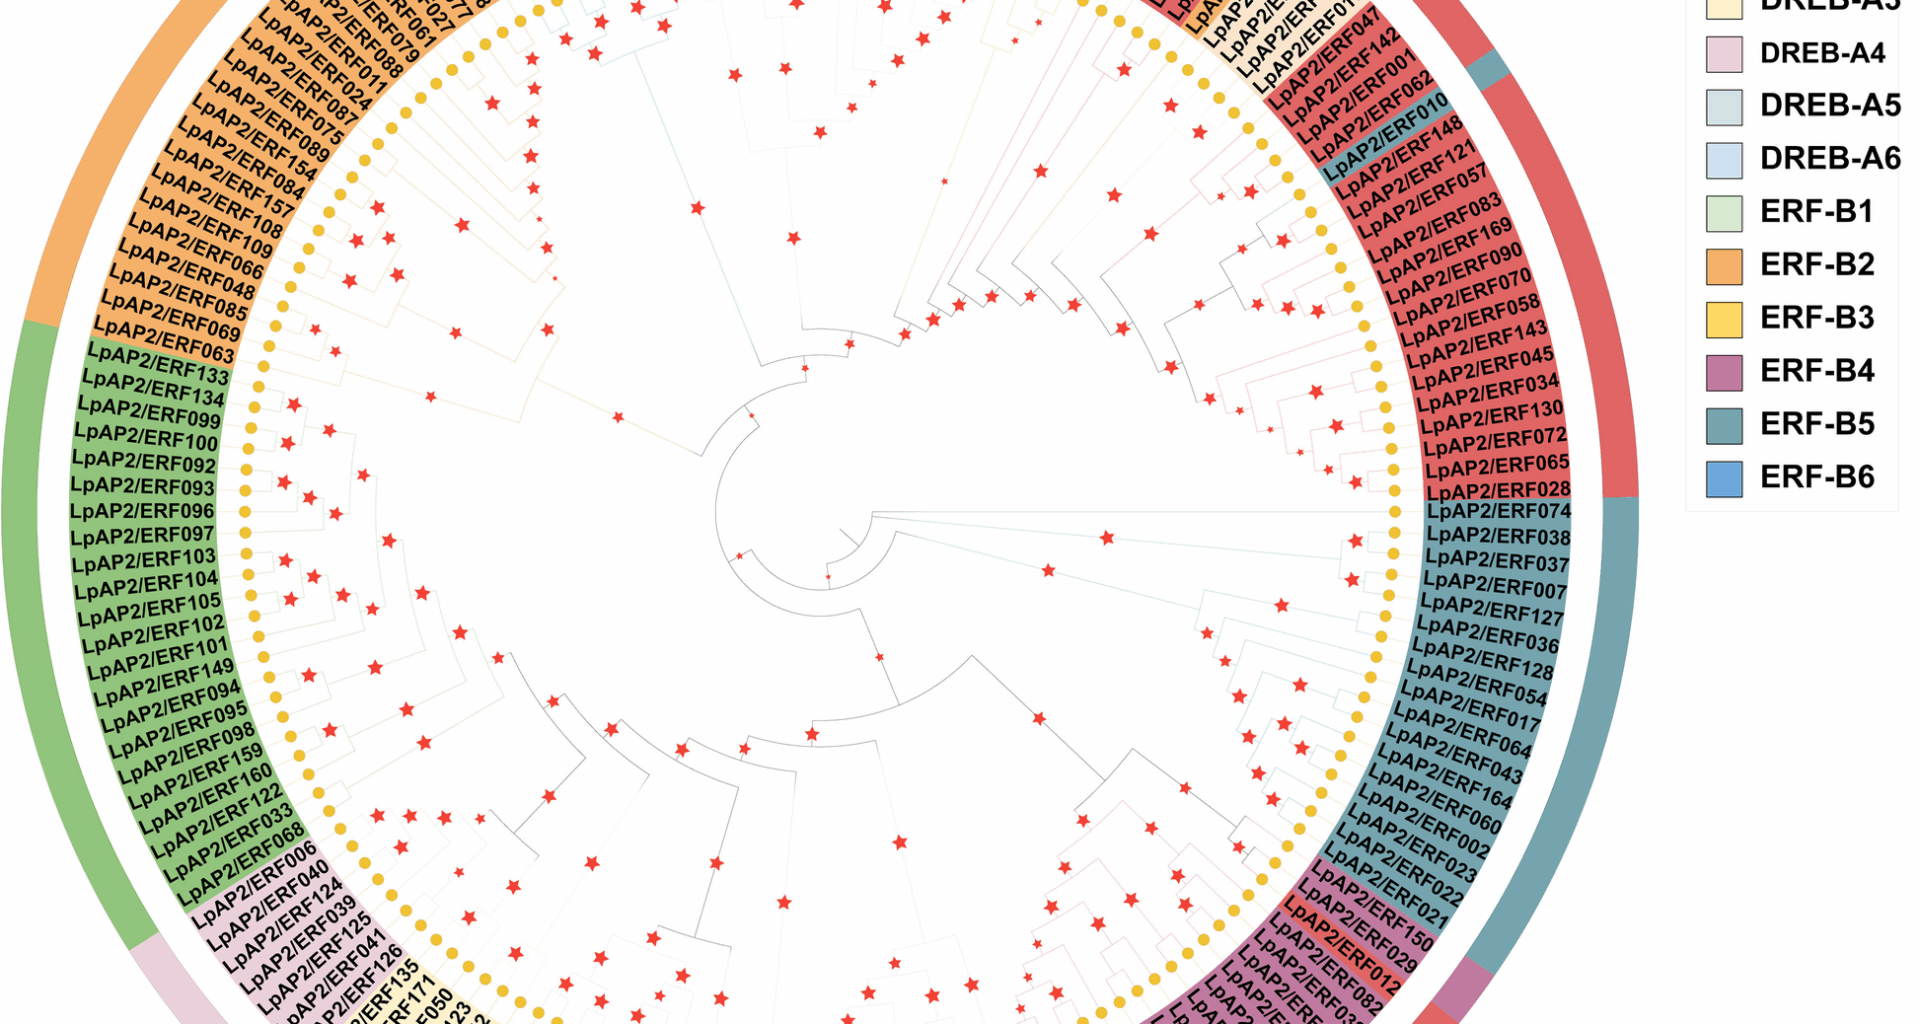
To explore the phylogenetic relationships of perennial ryegrass AP2/ERF proteins, the multiple sequence alignment results of 172 perennial ryegrass AP2/ERF proteins and 161 rice AP2/ERF proteins were used to construct a phylogenetic tree using the maximum likelihood (ML) method (Supplementary Fig. 1). Subsequently, based on the number of AP2/ERF domains and the similarity of amino acid sequences, all 172 putative LpAP2/ERF proteins were categorized into three distinct subfamilies: the AP2 subfamily (25), the ERF subfamily (143) and the RAV subfamily (4) (Fig. 1; Table S1). A total of 160 LpAP2/ERF genes were mapped to the chromosomes and renamed from LpAP2/ERF001 to LpAP2/ERF160 based on their chromosomal locations. 12 LpAP2/ERF genes (KYUSt_contig_319.1654, KYUSt_contig_554.44, KYUSt_contig_686-1.1257, KYUSt_contig_686-1.1355, KYUSt_contig_915.335, KYUSt_contig_915.370, KYUSt_contig_1181.17, KYUSt_contig_1181.746, KYUSt_contig_1181.1360, KYUSt_contig_1253.55, KYUSt_contig_2437.54 and KYUSt_scaffold_1700.180), which could not be conclusively mapped to any linkage group were renamed LpAP2/ERF161- LpAP2/ERF172, respectively (Table S1). Among them, 25 genes were identified to encode proteins with two or more AP2/ERF domains in perennial ryegrass and were classified into the AP2 subfamily. Interestingly, six genes (LpAP2/ERF012, LpAP2/ERF137, LpAP2/ERF138, LpAP2/ERF139, LpAP2/ERF140, and LpAP2/ERF141) belonged to the AP2 subfamily members but showed high similarity to the ERF subfamily. Similarly, 143 genes were assigned to the ERF subfamily, which contains a single AP2 domain. These genes were further subdivided into two groups: DREB [A1 (22), A2 (6), A3 (6), A4 (7), A5(10), A6 (8)] and ERF [B1 (15), B2 (23), B3 (4), B4 (16), B5 (18), B6 (8)]. Interestingly, LpAP2/ERF010 also encoded an AP2/ERF domain that was distinct from the ERF subfamily and instead showed high similarity to AP2 subfamily members. The RAV subfamily contained only four putative genes, predicted to encode proteins with one AP2/ERF domain and one B3 domain.
Fig. 1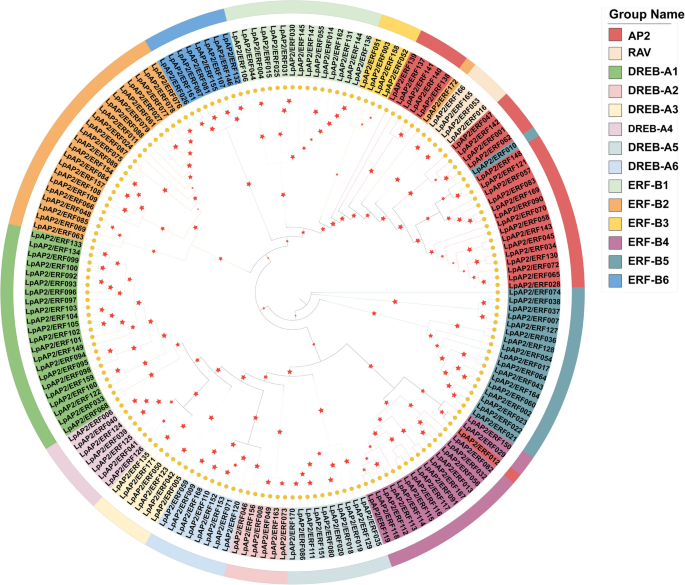
The phylogenetic tree of 172 LpAP2/ERF genes from perennial ryegrass. Different color represents different groups. Red pentacles indicate bootstrap values
To further understand the gene structural composition, the intron and exon structures of LpAP2/ERF genes were analyzed by comparing their genomic DNA sequences (Fig. 2A, B). Most members of the ERF subfamily contained no or very few introns, except for LpAP2/ERF074, LpAP2/ERF157, LpAP2/ERF106 and LpAP2/ERF010, which contained 6, 18, 7 and 7 introns, respectively. Additionally, the RAV subfamily contained either no introns or a single intron. Compared with the ERF and RAV subfamilies, the CDSs of most AP2 subfamily genes were disrupted by introns, with the majority of AP2 subfamily members containing five or more introns. Among AP2 subfamily genes, LpAP2/ERF062 contained the highest number of introns (10). Interestingly, 5 genes LpAP2/ERF137, LpAP2/ERF138, LpAP2/ERF139, LpAP2/ERF140, and LpAP2/ERF141, shared high similarity with ERF subfamily genes but contained no intron. The highly diverse gene structures indicate extensive differentiation during the formation and evolution of the perennial ryegrass genome.
Fig. 2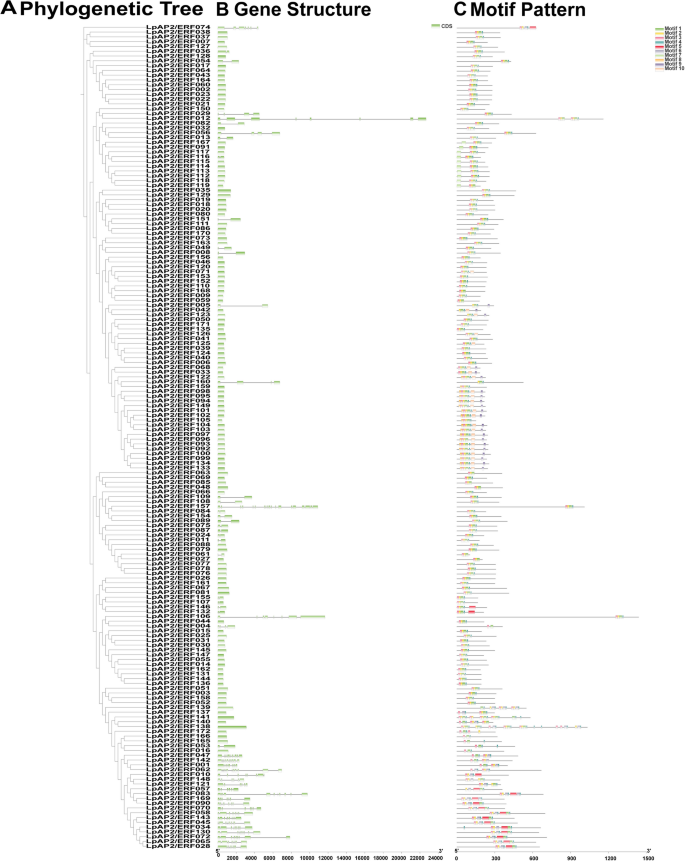
Phylogenetic relationships, gene structure, and architecture of conserved protein motifs in LpAP2/ERF genes. a Phylogenetic tree based on the full‑length sequences of LpAP2/ERF proteins created using iqtree software. b Exon‑intron structure of LpAP2/ERF genes. Green boxes indicate exons, and gray lines indicate introns. c Motif composition of LpAP2/ERF proteins. The motifs, numbered 1‑10, are displayed in different colored boxes. The sequence information for each motif is provided in Supplemental Table S2
In addition to the AP2/ERF domain, the LpAP2/ERF proteins also contain group-specific conserved motifs, which may play important roles in protein–protein interactions, nuclear localization, and transcriptional activities. To further characterize these regions, the conserved motifs of 172 LpAP2/ERF proteins were analyzed using the MEME web tool. A total of 10 conserved motifs were identified and designated as Motif 1–10 (Table S2). The analysis revealed the presence of these 10 conserved motifs (Fig. 2A, C). Within the ERF subfamily, the following distribution was observed: motif 1 (141genes), motif 2 (142 genes), motif 3 (139 genes), motif 4 (135 genes), motif 5 (5 genes), motif 6 (7 genes), motif 7 (11 genes), motif 8 (23 genes), motif 9 (29 genes), and motif 10 (36 genes). Notably, motif 2 was detected in most genes, while motif 5 was found in the fewest. In the AP2 subfamily members, motif 1 (24 genes), motif 2 (25 genes), motif 3 (25 genes), motif 4 (25 genes), motif 5 (14 genes), motif 6 (23 genes), motif 8 (2 genes), motif 9 (1 genes), and motif 10 (4 genes) were identified. Among these, motif 8 was detected only in LpAP2/ERF139 and LpAP2/ERF065, motif 9 was found only in LpAP2/ERF062 and motif 10 was detected exclusively in LpAP2/ERF012, LpAP2/ERF057, LpAP2/ERF121, and LpAP2/ERF138. In the RAV subfamily, motif 1, 3, and 4 were the shared motifs. Generally, many conserved motifs identified in these LpAP2/ERF proteins may be involved in the regulation of gene expression through potential DNA-binding sites, which can be further examined. The similar composition of gene structures and conserved motifs within a specific subfamily further validates the reliability of the phylogenetic tree and clustering.
Most LpAP2/ERF members exhibit two fully conserved elements, AA and WLG, a few genes of the AP2, DREB, and ERF subfamilies show variation in the fully conserved WLG, such as transformations from WLG to YLG/WVG (Supplementary Fig. 2A-D). Additionally, only genes in the ERF subfamily display variations in the fully conserved AA motif (Supplementary Fig. 2B). Certain members also show mutations in highly conserved elements like RAYD and YRG. For example, RAYD is mutated to RT/KTYD, and YRG is mutated to YKG/FRG. Interestingly, four genes, LpAP2/ERF138 to LpAP2/ERF141, have more than two AP2 domains (Supplementary Fig. 2A). The RAV subfamily is distinct in having the longest conserved range, characterized by two conserved structural domains. Four genes from the RAV subfamily were found to contain both AP2 and B3 structural domains, displaying fully conserved WLG, AA, and RAYD motifs (Supplementary Fig. 2C). Similar to the ERF subfamily in other species, the ERF subfamily gene contain conserved elements such as YRG, AEIR, WLG, AA, and RAYD. However, variations were observed, including AEIR being mutated to SEIR and RAYD being mutated to L/HAYD (Supplementary Fig. 2B). As in other plant DREB sequences, the AA element remains completely conserved in these sequences. Furthermore, YRG, RAYD, and WLG elements are highly conserved (Supplementary Fig. 2D).
Analyses of chromosomal location, gene duplication, and genome synteny
To generate the graphical representation of chromosomal positions of LpAP2/ERF genes, the physical locations of these genes were analyzed based on their genomic distribution across chromosomes. The results revealed that 160 LpAP2/ERF genes were distributed across all 7 chromosomes of perennial ryegrass, while 12 genes could not be assigned to any specific chromosome (Fig. 3). More specifically, chromosome 6 had the highest number of LpAP2/ERF genes, with 35 genes located on it; chromosomes 1, 2, 4, 5 and 7 contained 20, 27, 20, 26 and 19 genes, respectively. In contrast, chromosome 3 had the fewest number of LpAP2/ERF TFs, with only 13 genes. The high number of AP2/ERF sequences on chromosome 6 was primarily attributed to the increased number of genes in the DREB (12 genes) and ERF (16 genes) subfamilies. Both AP2 and ERF subfamilies were present on all chromosomes; chromosome 6 contained the most genes from both the AP2 (7 genes) and the ERF (28 genes) subfamily.
Fig. 3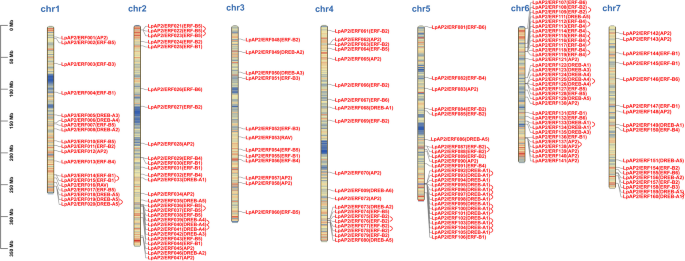
Chromosomal localization of LpAP2/ERF genes. The chromosome number is indicated to the top of each chromosome. The gene names on each chromosome correspond to the approximate locations of the LpAP2/ERF genes. Red lines indicate duplicated AP2/ERF gene pairs. 12 genes located on scaffolds and contigs (LpAP2/ERF161, LpAP2/ERF162, LpAP2/ERF163, LpAP2/ERF164, LpAP2/ERF165, LpAP2/ERF166, LpAP2/ERF167, LpAP2/ERF168, LpAP2/ERF169, LpAP2/ERF170, LpAP2/ERF171, and LpAP2/ERF172) could not be anchored to a specific chromosome. The scale is in megabases (Mb)
Interestingly, the results identified conserved sequences and physical clustering of repetitive transcription factors belonging to the same group within the same chromosomal regions, as follows: LpAP2/ERF018 to LpAP2/ERF020 (DREB-A5) was located on chromosome 1; LpAP2/ERF021 to LpAP2/ERF023 (ERF-B5), LpAP2/ERF036 to LpAP2/ERF038 (ERF-B5)and LpAP2/ERF039 to LpAP2/ERF041 (DREB-A4) were located on chromosome 2; LpAP2/ERF075 to LpAP2/ERF079 (ERF-B2) were located on chromosome 4; LpAP2/ERF087 to LpAP2/ERF089(ERF-B2) and LpAP2/ERF092 to LpAP2/ERF105 (DREB-A1) were located on chromosome 5; LpAP2/ERF112 to LpAP2/ERF119 (ERF-B4), LpAP2/ERF124 to LpAP2/ERF126 (DREB-A4)and LpAP2/ERF137 to LpAP2/ERF141 (AP2) were located on chromosome 6. Additionally, the RAV subfamily members were distributed across chromosomes 1 and 3, while the remaining two genes were not assigned to any chromosome. Furthermore, due to their significant impact on functional differentiation and gene expansion, gene duplication events among LpAP2/ERF genes in the perennial ryegrass genome were investigated. Based on previous studies, chromosomal regions within a 200 Kb range containing two or more genes were classified as tandem duplications. A total of 42 pairs of tandem duplicated genes were identified, distributed across chromosomes 1, 2, 4, 5, 6, and 7 (Fig. 3). Notably, chromosome 5 contained the highest number of tandem-duplicated gene pairs (10 pairs), while one tandem-duplicated gene was not assigned to any chromosome.
Apart from tandem duplication events, we also identified numerous pairs of segmental duplications in the perennial ryegrass chromosomes (Fig. 4A). The analysis of homologous genes is crucial for exploring evolutionary relationships. A total of 21 putative segmentally duplicated gene pairs were identified on different perennial ryegrass chromosomes, further confirming that the LpAP2/ERF gene family is highly conserved. Based on these findings, some LpAP2/ERF genes may have originated through gene replication events, which could represent a primary evolutionary driving force for the LpAP2/ERF gene family. To further investigate the phylogeny of the perennial ryegrass AP2/ERF family, we constructed comparative syntenic maps of perennial ryegrass in association with rice (Fig. 4B; Table S3). The results revealed that the LpAP2/ERF genes have 96 homologous genes in rice, with 129 syntenic gene pairs located on chr1-chr7. Certain LpAP2/ERF genes were associated with at least three syntenic gene pairs, including LpAP2/ERF013, LpAP2/ERF082, LpAP2/ERF091, LpAP2/ERF112, and LpAP2/ERF154. This indicates that these genes may play a significant role in the evolution of the AP2/ERF family.
Fig. 4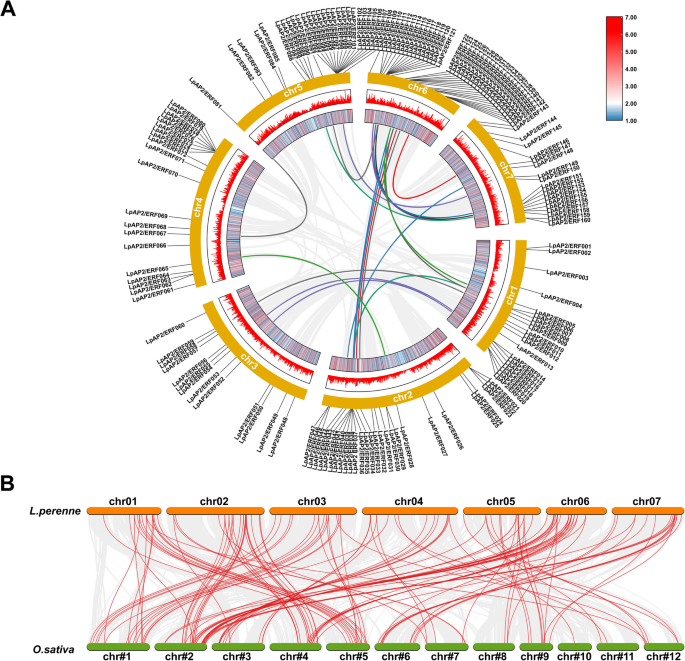
Distribution of segmentally duplicated AP2/ERF genes on perennial ryegrass chromosomes and synteny analysis in two species. A Grey lines indicate collinear blocks across the whole perennial ryegrass genome, and colored lines represent collinear gene pairs in the AP2/ERF gene family. B Gray lines in the background indicate collinear blocks between perennial ryegrass and rice genomes, while red lines highlight syntenic AP2/ERF gene pairs
Cis‑elements in the promoters of perennial ryegrass AP2/ERF genes
To investigate the potential regulatory functions of LpAP2/ERF genes in response to abiotic and biotic stresses, the 2 Kb promoter sequences of these genes were analyzed to identify cis-regulatory elements (CREs) (Fig. 5; Table S4). A total of 69 cis-acting elements with potential regulatory activity were identified and characterized. The hormone-response elements included ABRE (abscisic acid responsiveness); GARE-motif, P-box, and TATC-box (gibberellin responsiveness); TCA-element and SARE (salicylic acid responsiveness); CGTCA-motif and TGACG-motif (MeJA-responsiveness); and TGA-box, AuxRR-core and TGA-element (auxin responsiveness). Abiotic stress-responsive elements included MBS (drought-inducibility), LTR (low-temperature responsiveness), WUN-motif (wound-responsive element), TC-rich repeats (defense and stress responsiveness), DRE (dehydration, low temperature, and salt stress responsiveness), and GC-motif (anoxic-specific inducibility). Light-responsive elements included TCCC-motif, GATA-motif, chs-CMA1a, G-box, MRE, Box 4, Gap-box, TCT-motif, GA-motif, AE-box, LAMP-element, Box II, ATCT-motif, chs-CMA2a, I-box, AT1-motif, ATC-motif, ACE, chs-Unit 1 m1, chs-CMA2b, L-box, GTGGC-motif, GT1-motif, 3-AF1 binding site, Sp1, AAAC-motif, GATT-motif, Pc-CMA2a, C-box, Pc-CMA2c, GGA-motif, chs-CMA2c and LS7. Other response elements included GCN4-motif (endosperm expression), ARE (anaerobic induction), circadian (circadian control), AT-rich sequence (maximal elicitor-mediated activation), MSA-like (cell cycle), MBSI (flavonoid biosynthetic genes regulation), CAT-box and NON-box (meristem expression), motif I (root specific regulation), O2-site(zein metabolism regulation), HD-Zip 1(palisade mesophyll cells element differentiation), CCAAT-box(MYBHv1 binding site), Box III(protein binding site), Box II -like sequence and A-box (cis-acting regulatory element), AT-rich element(ATBP-1), AACA-motif(endosperm-specific negative expression), 3-AF3 binding site (CMA3), and RY-element (seed-specific regulation). The G-box (170), ABRE (165), TGACG-motif (154), CGTCA-motif (154), ARE (137), and CAT-box (109) were more abundant in most LpAP2/ERF genes. DRE, which is associated with dehydration, low-temperature, and salt stresses, was uniquely found in LpAP2/ERF053. The auxin-responsive element TGA-box was only found in LpAP2/ERF008, LpAP2/ERF081, LpAP2/ERF095, LpAP2/ERF112, and LpAP2/ERF131. The salicylic acid-responsive cis-acting element SARE was only found in LpAP2/ERF079, LpAP2/ERF080, and LpAP2/ERF082. Motif I, a cis-element for root-specific regulation, was found in LpAP2/ERF007, LpAP2/ERF063, LpAP2/ERF135, LpAP2/ERF160, and LpAP2/ERF170. MBSI, a cis-element for flavonoid biosynthetic gene regulation, was identified in LpAP2/ERF001, LpAP2/ERF012, LpAP2/ERF048, LpAP2/ERF093, LpAP2/ERF121, and LpAP2/ERF147.
Fig. 5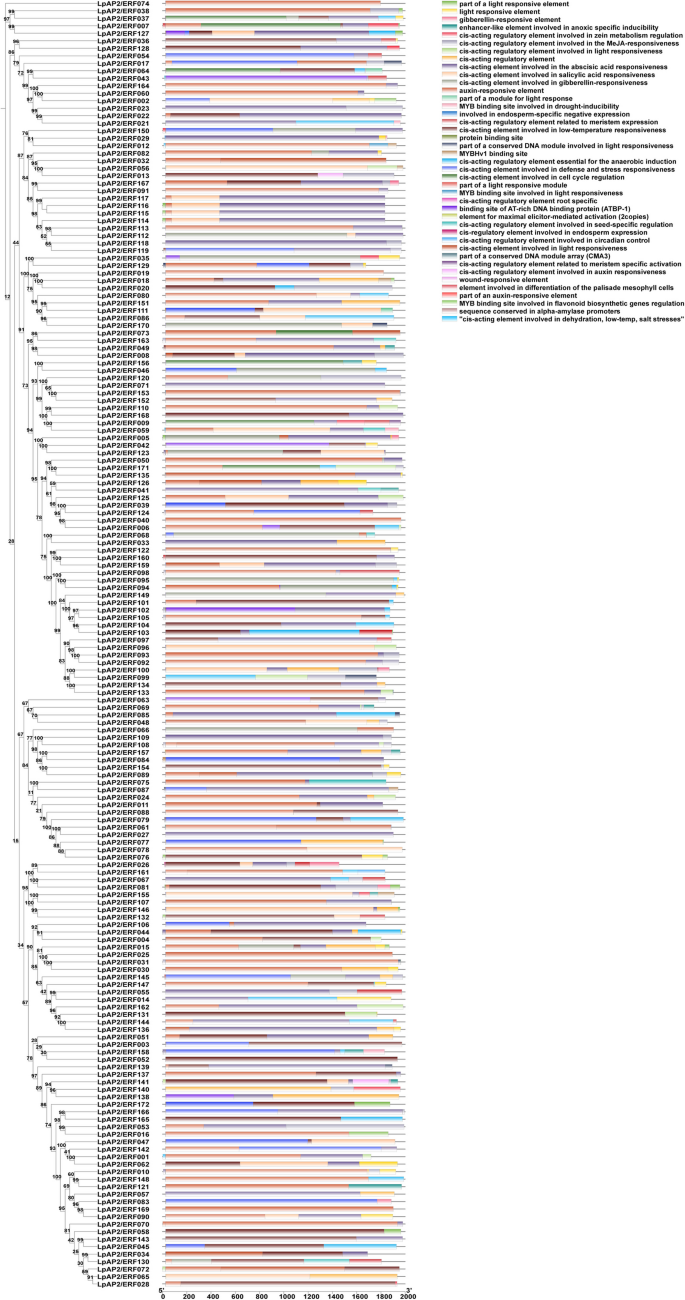
Cis-acting elements of LpP2/ERF promoters. The phylogenetic tree is shown on the left, and the cis-acting elements of the LpAP2/ERF promoters are shown on the right. Different colors represent different types of cis-acting elements
Analysis of plant phenotype and physiological indicators
Under the CK condition, there was no significant difference in aboveground fresh weight, aboveground dry weight, and chlorophyll content between EF and EI perennial ryegrass. However, the relative plant height of EI perennial ryegrass was significantly higher than that of EF (P < 0.05), and the electrical conductivity of EI perennial ryegrass was significantly lower than that of EF (P < 0.05). Under the LN condition, aboveground fresh weight, aboveground dry weight, relative plant height, and chlorophyll content of both EF and EI perennial ryegrass significantly decreased (P < 0.001) compared with CK, while electrical conductivity significantly increased (P < 0.001) compared with CK. In addition, under the LN condition, the aboveground fresh and dry weight (P < 0.05), relative plant height (P < 0.01), and chlorophyll content (P < 0.01) of EI perennial ryegrass were significantly higher than those of EF, while the electrical conductivity of EI perennial ryegrass was significantly lower than that of EF (P < 0.001) (Fig. 6A, B).
Fig. 6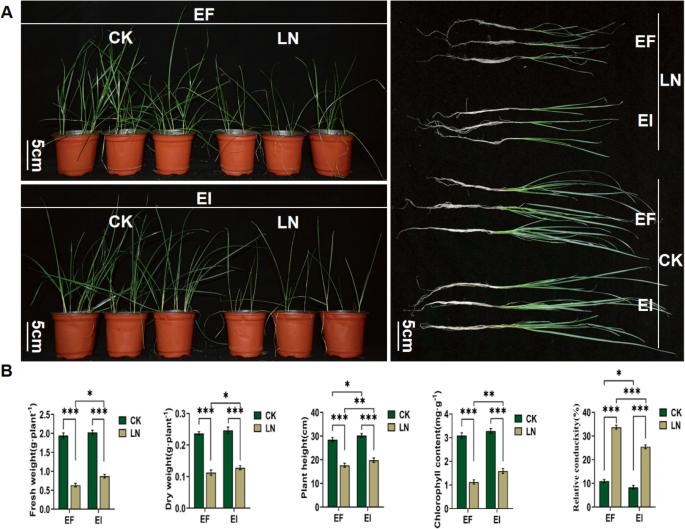
Analysis of phenotypic and physiological characteristics of Lolium perenne– Epichloë endophyte symbionts in response to low-nitrogen stress. A EI and EF perennial ryegrass under CK and LN treatments for one month; B changes in aboveground fresh weight, aboveground dry weight, relative plant height, chlorophyll content, and electrical conductivity of EI and EF perennial ryegrass under CK and LN treatments. CK: 1 mM N; LN: 0.01 mM N; EI: Endophyte-infected; EF: Endophyte-free; * indicates P < 0.05; ** indicates P < 0.01; *** indicates P < 0.001 (Same applies below)
Transcriptome sample quality and sequencing results analysis
After quality control of the sequencing data from 48 perennial ryegrass samples that passed detection, 305.29 Gb of data was obtained, with a Q30 value of 93.73% or above, indicating good data quality and suitability for subsequent analysis (Table S5). The clean reads from the 48 samples were aligned to the reference genome of perennial ryegrass, and the results showed that the alignment rate ranged from 78.49% and 81.75%, which is acceptable for further data analysis (Table S6).
Expression profiles of LpAP2/ERF genes in perennial ryegrass-endophytic fungi symbionts
To gain insight into the regulatory role of endophytic fungi in the expression profiles of LpAP2/ERF genes, we analyzed the expression levels of AP2/ERF genes in endophyte-infected perennial ryegrass compared with endophyte-free perennial ryegrass under normal and low nitrogen conditions.
Under normal nitrogen conditions, a total of 11 differentially expressed AP2/ERF genes were identified in endophyte-infected perennial ryegrass compared with endophyte-free perennial ryegrass, including 1 DREB, 7 ERF, and 3 RAV genes (Fig. 7A; Table S7). The expression of LpAP2/ERF016 was significantly down-regulated in root and leaf tissues, while LpAP2/ERF165 was significantly down-regulated in stem and leaf tissues. Additionally, the expression patterns of three genes were significantly up-regulated only in roots (LpAP2/ERF002 and LpAP2/ERF164) and leaves (LpAP2/ERF089). The expression patterns of six important genes were significantly down-regulated only in roots (LpAP2/ERF029, LpAP2/ERF056, and LpAP2/ERF166), stems (LpAP2/ERF151), and leaves (LpAP2/ERF075 and LpAP2/ERF087).
Fig. 7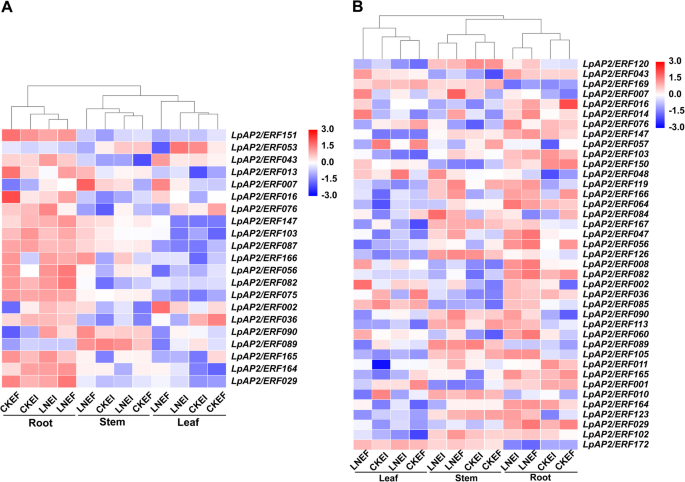
Heatmap of expression profiles of LpAP2/ERF genes. A Heatmap of expression profiles of LpAP2/ERF genes in perennial ryegrass-endophytic fungi symbiont. B Heatmap of expression profiles of LpAP2/ERF genes under low nitrogen conditions. FPKM values were used to create the heatmap with clustering. The scale represents the relative signal intensity of FPKM values
Under low nitrogen conditions, a total of 11 differentially expressed AP2/ERF genes were identified in endophyte-infected perennial ryegrass compared with endophyte-free perennial ryegrass, including 1 AP2, 1 DREB, 8 ERF, and 1 RAV genes (Fig. 7A; Table S7). The expression of LpAP2/ERF076 was significantly up-regulated in root and leaf tissues, while LpAP2/ERF053 was significantly up-regulated in stem and leaf tissues. Additionally, the expression patterns of two genes were significantly up-regulated only in leaves (LpAP2/ERF089 and LpAP2/ERF090). The expression patterns of several important genes were significantly down-regulated only in roots (LpAP2/ERF013 and LpAP2/ERF082) and leaves (LpAP2/ERF007, LpAP2/ERF036, LpAP2/ERF043, LpAP2/ERF103, and LpAP2/ERF147).
Expression profile of LpAP2/ERF gene under low nitrogen conditions
To uncover the roles of LpAP2/ERF genes underlying low nitrogen adaptation, we analyzed the expression levels of AP2/ERF genes under low nitrogen compared with normal nitrogen in endophyte-infected and endophyte-free perennial ryegrass, respectively.
In endophyte-infected perennial ryegrass, a total of 20 differentially expressed AP2/ERF genes were detected under low nitrogen compared with normal nitrogen, including 3 AP2, 4 DREB, 10 ERF, and 3 RAV genes (Fig. 7B; Table S7). The expression of LpAP2/ERF048 was significantly up-regulated in all tissues. Additionally, some important genes showed significant or specific up-regulation only in root (LpAP2/ERF008, LpAP2/ERF047, LpAP2/ERF056, LpAP2/ERF064, LpAP2/ERF082, LpAP2/ERF090, LpAP2/ERF105, LpAP2/ERF113, LpAP2/ERF123, and LpAP2/ERF167), stems (LpAP2/ERF165 and LpAP2/ERF166), and leaves (LpAP2/ERF016, LpAP2/ERF029, and LpAP2/ERF172). Conversely, significant or specific down-regulation was observed in roots (LpAP2/ERF011), stems (LpAP2/ERF120), and leaves (LpAP2/ERF010 and LpAP2/ERF036).
In endophyte-free perennial ryegrass, a total of 28 differentially expressed AP2/ERF genes were detected under low nitrogen compared with normal nitrogen, including 5 AP2, 6 DREB, and 17 ERF genes (Fig. 7B; Table S7). The expression of LpAP2/ERF002 and LpAP2/ERF047 was significantly up-regulated in all tissues. The expression of LpAP2/ERF008 was significantly up-regulated in roots and leaves, while LpAP2/ERF007 was significantly up-regulated in stems and leaves. In contrast, the expression of LpAP2/ERF001 and LpAP2/ERF169 was significantly down-regulated in stems and leaves. Under low nitrogen conditions, some important genes were significantly up-regulated only in roots (LpAP2/ERF060, LpAP2/ERF085, LpAP2/ERF090, LpAP2/ERF105, LpAP2/ERF119, LpAP2/ERF120, LpAP2/ERF164, and LpAP2/ERF167), stems (LpAP2/ERF126), and leaves (LpAP2/ERF014, LpAP2/ERF029, LpAP2/ERF043, LpAP2/ERF102, LpAP2/ERF103, and LpAP2/ERF147). Conversely, significant down-regulation was observed only in roots (LpAP2/ERF084 and LpAP2/ERF150) and leaves (LpAP2/ERF036, LpAP2/ERF056, LpAP2/ERF057, LpAP2/ERF076, and LpAP2/ERF089).
GO and KEGG enrichment analysis of differentially expressed genes in the LpAP2/ERF family
To further investigate the biological functions of these 44 LpAP2/ERF genes, GO and KEGG analysis was performed using transcriptome data (Fig. 8). The results of GO annotation revealed that the predominant biological processes were associated with biological regulation. Within the cellular component classification, the primary subgroups encompassed cellular anatomical entity and intracellular. The key subcategories of molecular function included binding, catalytic activity, and transcription regulator activity. 5 classes of GO terms were significantly enriched by all 44 member genes, which were involved in biological regulation, cellular anatomical entity, intracellular, binding and transcription regulator activity. In addition, only the LpAP2/ERF056 gene was enriched in catalytic activity (Fig. 8A). Moreover, the KEGG enrichment analysis demonstrated that 7 AP2/ERF genes were involved in metabolic pathway, among which LpAP2/ERF002, LpAP2/ERF043, LpAP2/ERF060, LpAP2/ERF064, and LpAP2/ERF164 were involved in the MAPK signaling pathway- plant and Plant hormone signal transduction. In addition, LpAP2/ERF029 and LpAP2/ERF056 genes were involved in the Spliceosome (Fig. 8B).
Fig. 8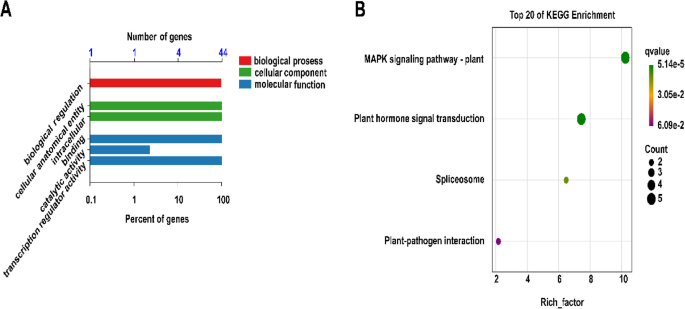
GO and KEGG enrichment analysis of differentially expressed genes in the LpAP2/ERF family. A: GO analysis, B: KEGG analysis. The vertical coordinate represents the KEGG term or pathway, and the horizontal axis represents the q-value, where a smaller value indicates greater significance. Only enriched KEGG terms (p-value < 0.05) are displayed
The protein–protein interaction network analyses
To analyze the synergistic effects of 44 differentially expressed LpAP2/ERF transcription factors in the regulatory process, an interaction network was constructed using 15 rice homologous proteins identified in the STRING database. The results showed that the top three proteins were LpAP2/ERF064 (ERF-B5), LpAP2/ERF047 (AP2), and LpAP2/ERF164 (ERF-B5), with LpAP2/ERF064 interacting with the largest number of proteins (Fig. 9).
Fig. 9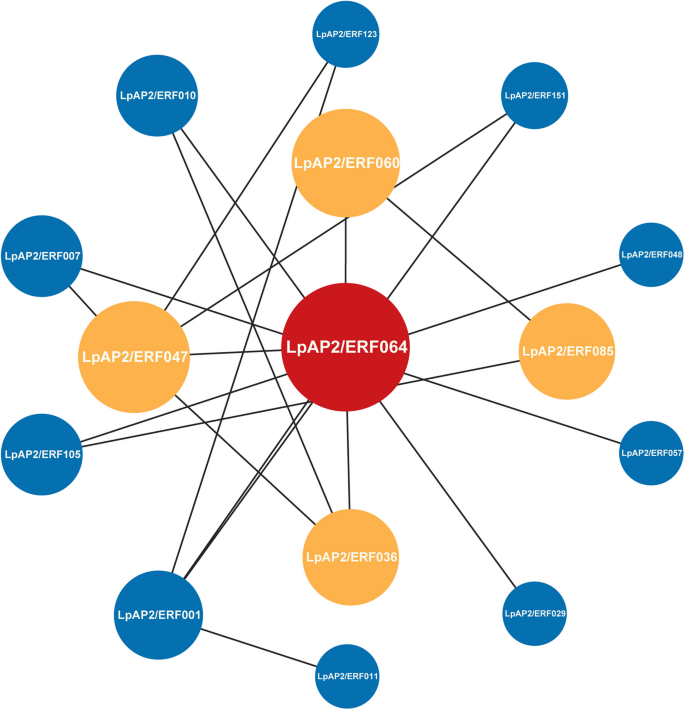
The interaction network of AP2/ERF in perennial ryegrass based on orthologs in rice. Node size and color intensity reflect the importance of the corresponding protein
Validation of RNA sequencing data by quantitative real-time PCR
We also examined the expression of nine randomly selected genes and validated them by quantitative real-time PCR (qRT-PCR) to confirm the reliability of our sequencing data (Fig. 10; Table S8). These included LpAP2/ERF013, LpAP2/ERF036, LpAP2/ERF056, LpAP2/ERF082, LpAP2/ERF084, LpAP2/ERF102, LpAP2/ERF103, LpAP2/ERF105 and LpAP2/ERF147. Overall, the results showed that the expression of these genes measured by qRT-PCR was in good agreement with the RNA-seq results (Table S7). Consequently, the RNA-seq data we obtained were trustworthy.
Fig. 10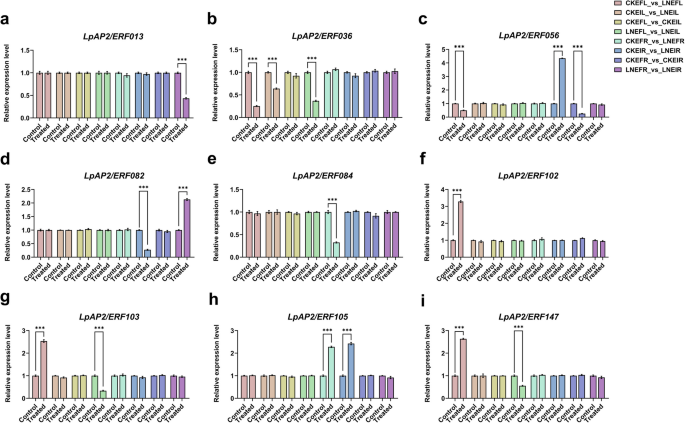
The relative gene expression of nine randomly selected genes examined by qRT-PCR analysis. Different color legends represent different difference groups. “R” represents root and “L” represents leaf