
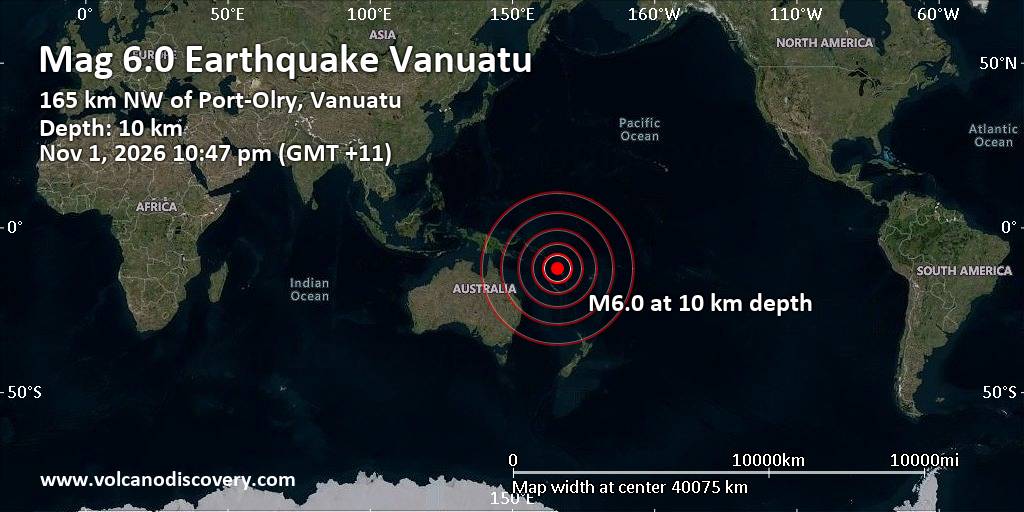
Very strong magnitude 6.0 earthquake at unknown depth
1 Nov 11:53 UTC: First to report: GFZ after 7 minutes.
1 Nov 11:53: Now using data updates from EMSC
… [show all] …1 Nov 11:54: Epicenter location corrected by 2.7 km (1.7 mi) towards WSW.
1 Nov 11:58: Hypocenter depth recalculated from 10.00 to 1.00 km (from 6.2 to 0.6 mi). Epicenter location corrected by 9.7 km (6 mi) towards NW.
1 Nov 12:00: Hypocenter depth recalculated from 1.00 to 35.00 km (from 0.6 to 22 mi). Epicenter location corrected by 4.8 km (3 mi) towards SSE.
1 Nov 12:02: Magnitude recalculated from 6.1 to 6.0. Hypocenter depth recalculated from 35.00 to 10.00 km (from 22 to 6.2 mi). Epicenter location corrected by 7.1 km (4.4 mi) towards SW.
1 Nov 12:02: Now using data updates from USGS
I didn’t feel it
I felt this quake
Earthquake details
Date & timeNov 1, 2026 11:47:03 UTC –
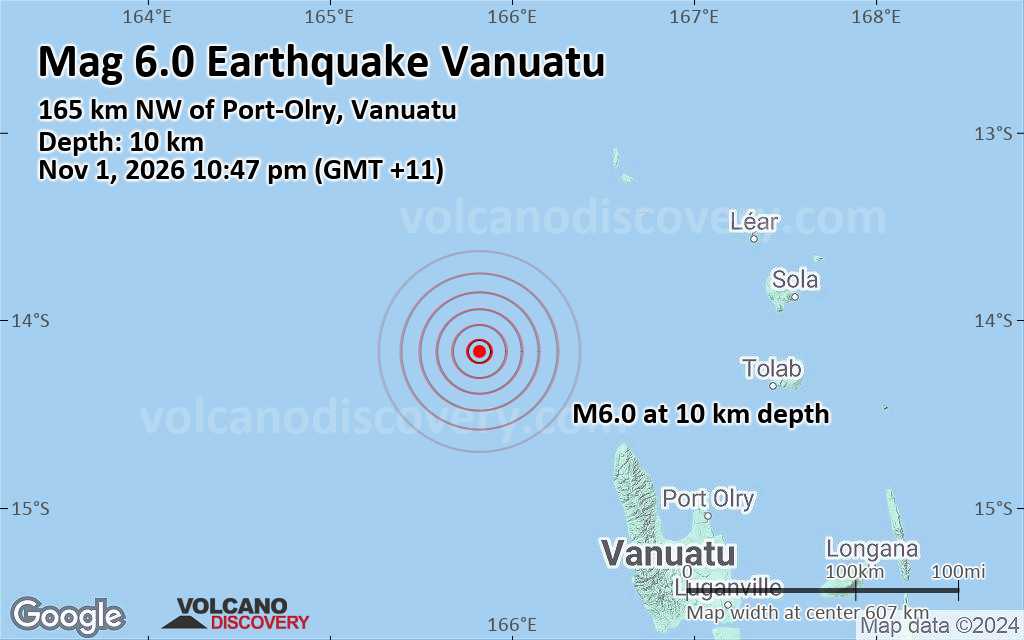
Local time at epicenterSunday, Nov 1, 2026, at 10:47 pm (GMT +11)
Statusconfirmed (manually revised)
Magnitude6.00
Depth10 km
Epicenter latitude / longitude14.1689°S / 165.8242°E Vanuatu
Seismic antipode14.1689°N / 14.176°W Senegal
Quality65 seismic stations
Shaking intensityVI Strong shaking near epicenter
Felt0 reports
Primary data sourceUSGS (United States Geological Survey)
Nearest volcanoSuretamatai (182 km / 113 mi)
Weather at epicenter at time of quakeFew Clouds  26.1°C (79 F), humidity: 79%, wind: 8 m/s (16 kts) from ESE
Estimated seismic energy released6.3 x 1013 joules (17.5 gigawatt hours, equivalent to 15080 tons of TNT or 0.9 atomic bombs!) | equivalent to ONE quake of magnitude 6.0 | about seismic energy
[show map]
[smaller] [bigger]
Quake possibly felt by 4,590 people
According to preliminary estimates from the US Geological Survey (USGS), the quake might have been felt by over 4,590 people across Vanuatu. Approx. 3,740 people were in areas with light shaking (intensity IV), the highest intensity this quake likely produced over inhabited areas.
MMI Level
Shaking
 (4,594 in total)
Possible damageI Not feltNoneII Very weakNoneIII WeakProbably noneIV LightNone or minor onlyV ModerateMinorVI StrongMinor to ModerateVII Very strongModerateVIII SevereSignificantIX ViolentHeavyX ExtremeCatastrophic
Estimated number of people exposed to shaking from the earthquake by intensity (data coverage corresponding to attached map)
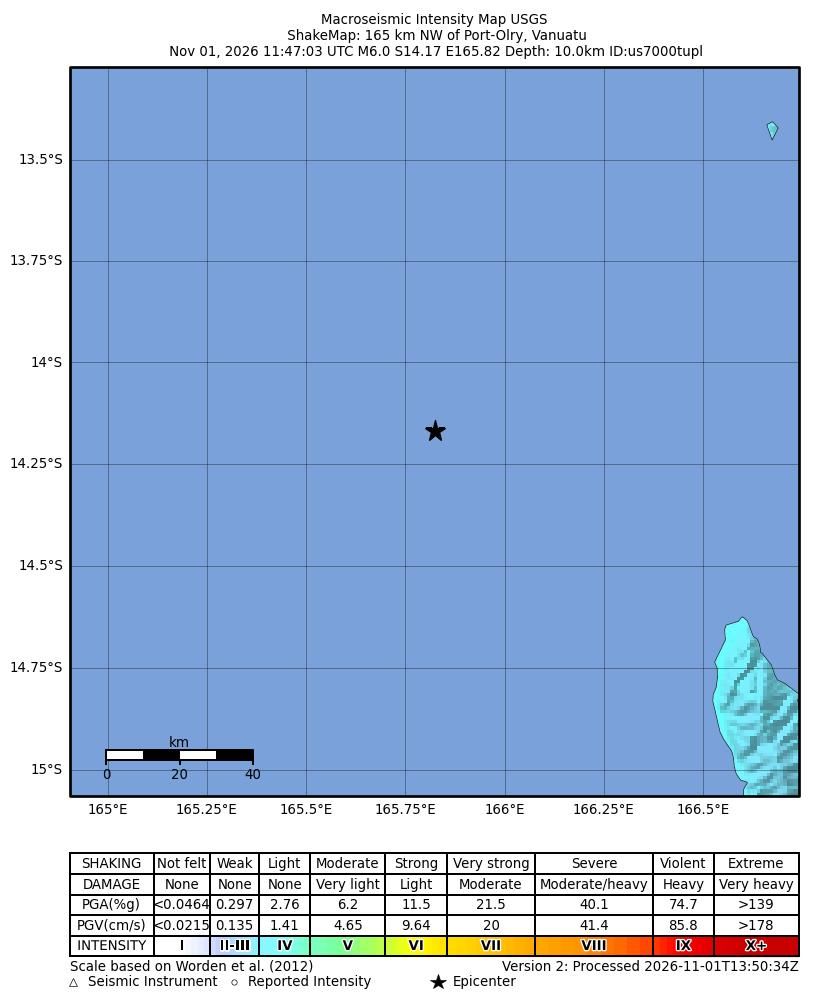
Map of expected ground shaking intensity according to the MMI scale (shakemap, source: USGS)
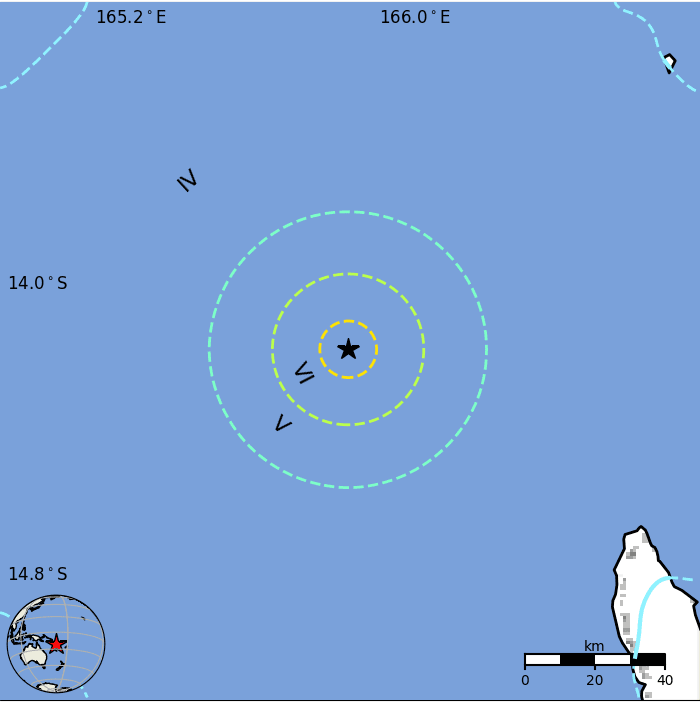
Map with population density (from white to black) in the area around the quake’s epicenter (source: USGS)
Alert level for this earthquake: Level GREEN
Based on seismic and statistical models, USGS estimates that the risk of fatalities and damage from this earthquake is low. The main factors that contribute to this evaluation are:
The maximum expected ground shaking from this quake was unlikely to reach dangerous levels over populated areas; it should not have surpassed intensity IV (Light) on the MMI scale significantly.
The quake appears to have occurred far from densely populated areas (far as in relation to its magnitude).
CommentOverall, the population in this region resides in structures that are highly vulnerable to earthquake shaking, though some resistant structures exist. The predominant vulnerable building types are unknown/miscellaneous types and wood construction.
A magnitude 7.4 earthquake 363 km ne of this event struck this region on November 26, 1999 (UTC), with estimated population exposures of 32,000 at intensity VII and 5,000 at intensity VIII, resulting in a reported 10 fatalities.
Recent earthquakes in this area have caused secondary hazards such as landslides that might have contributed to losses.
Source: USGS
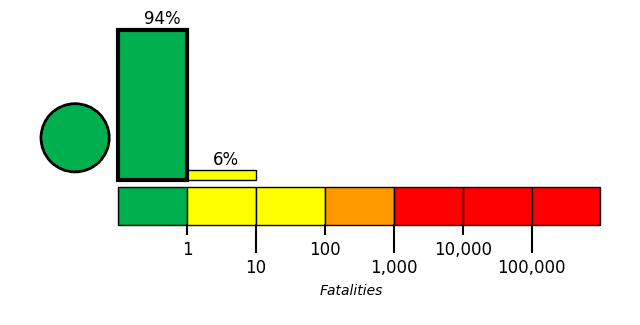
Green alert for shaking-related fatalities and economic losses. There is a low likelihood of casualties and damage.
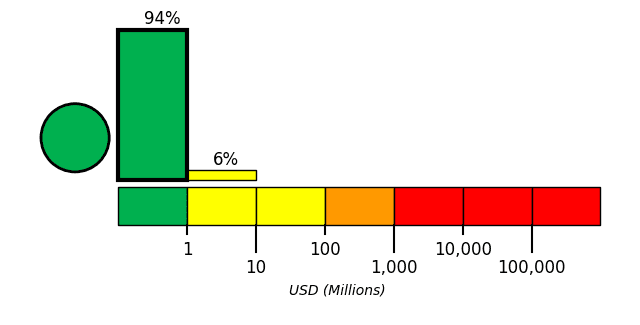
Expected fatalities
The risk of fatalities from this quake is considered low and classified as Level GREEN, the lowest on a color scale from Green (low) to Red (very high).
USGS estimates that there is a 90.4% chance that there are no direct fatalities as effect of shaking and a 9.1% chance that between 1 and 10 fatalities occurred. The likelihood that there are more than 10 fatalities is less than 1%.
Expected economic damage
The economic impact of this earthquake is expected to be minimal or small (Level GREEN). Only light damage if any should have occurred.
USGS calculates an 90.4% chance of total economic loss in the range of 0-1 million US Dollars and a 9.1% risk of losses between 1 and 10 million US Dollars. Total economic loss from this quake is not likely to surpass 1 million US Dollars (less than 1% chance).
Ground shaking from this quake
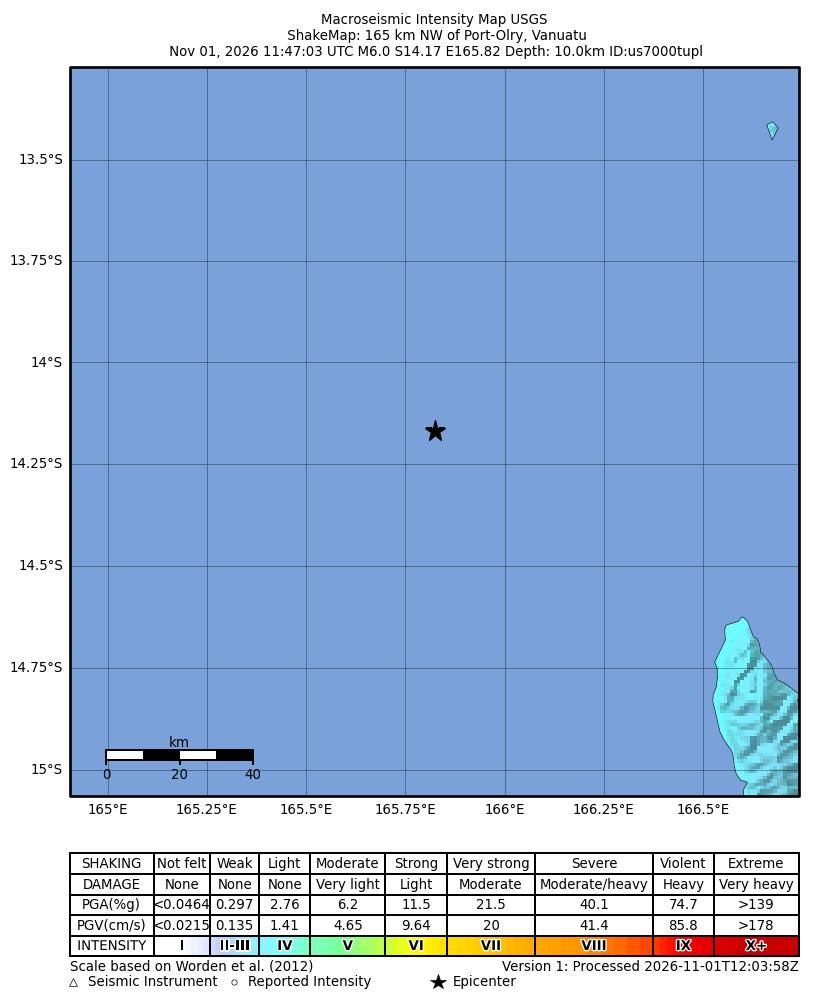
Map of estimated ground shaking (source:USGS)
Ground accelleration map for this quake
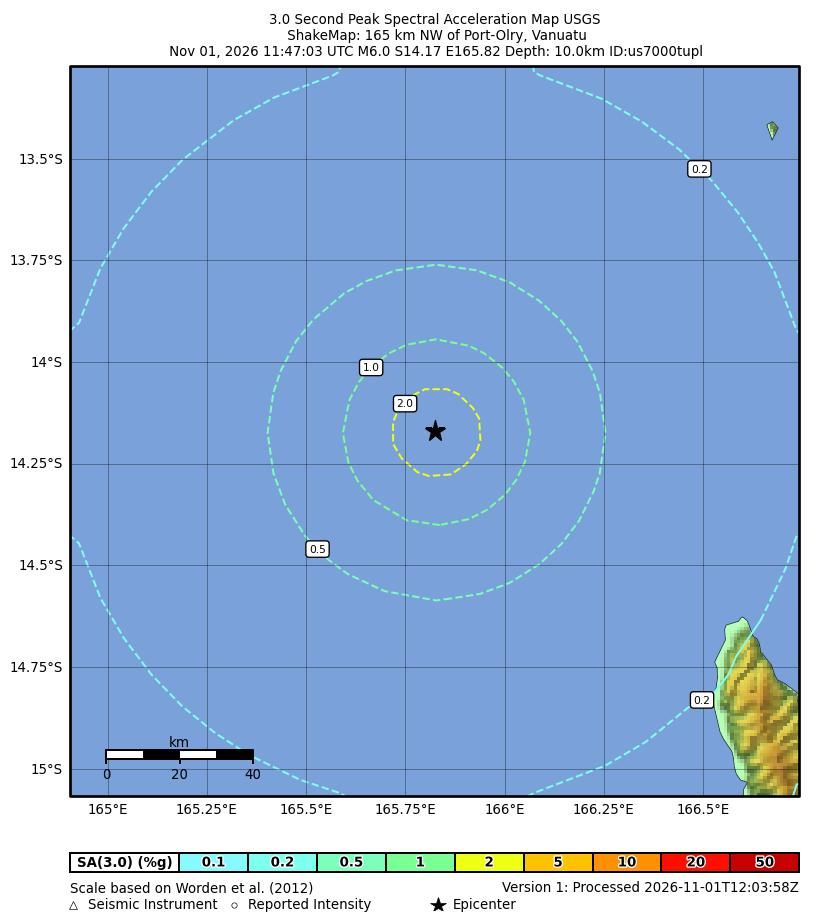
Map of estimated ground accelleration (source:USGS)
Nearby places
The closest larger town where the quake might have been felt is Port-Olry, a town with 1,300 inhabitants in Vanuatu, in 166 km (103 mi) distance southeast of the epicenter. People likely experienced light shaking there. In the capital of Vanuatu, Port Vila, 478 km (297 mi) away from the epicenter, the earthquake was probably felt as weak shaking.
The following table shows some of the places that might have been affected (or not) by the shaking.
Distance
Place
Max. shaking intensity(*)
Region
Country
166 km (103 mi)
SE of epicenter
(pop: 1,300)
IV: Light
174 km (108 mi)
SE of epicenter
(pop: 1000)
IV: Light
189 km (118 mi)
E of epicenter
(pop: 1,170)
IV: Light
208 km (129 mi)
SE of epicenter
(pop: 13,400)
IV: Light
270 km (168 mi)
SE of epicenter
(pop: 3,000)
III: Weak
383 km (238 mi)
N of epicenter
(pop: 553)
III: Weak
Luva Station, Temotu Province
478 km (297 mi)
SE of epicenter
(pop: 35,900)
III: Weak
592 km (368 mi)
NW of epicenter
(pop: 2,110)
III: Weak
Bauro Central, Makira-Ulawa Province
702 km (436 mi)
SE of epicenter
(pop: 1,440)
II: Very weak
820 km (510 mi)
NW of epicenter
(pop: 7,020)
II: Very weak
Notes:
(*) Shaking intensity according to the Modified Mercalli Intensity Scale (MMI) and estimated using seismic models.
User-reports for this quake
There are no user reports for this quake yet.
If you felt it, be the first to report it!
Contribute:
Leave a comment if you find a particular report interesting or want to add to it.
Flag as inappropriate.
Mark as helpful or interesting.
Send your own user report!
Get the Android app
I didn’t feel it
I felt this quake
If you were near the epicenter and felt it, please share your experience and submit a short “I felt it” report! Other users would love to hear about it!
If you did NOT feel the quake although you were in the area, please report it as well! Your contribution is valuable to earthquake science and seismic hazard analysis.
Compare Quake DataData for the same earthquake as reported by different agencies
The more agencies report about the same quake and post similar data, the more confidence you can have in the data. It takes normally up to a few hours until earthquake parameters are calculated with near-optimum precision.
Mag
Depth
Time GMT
2026-11-1
Epicenter
Agency
6.0
10 km
6.2 mi
(*)
±1.9 km
11:47:03.778
165 km NW of Port-Olry, Vanuatu
Epicenter uncertainty: ± 9.4 km
USGS (United States Geological Survey)
6.0
10 km
6.2 mi
(*)
11:47:04.47
Vanuatu Islands
1.4 km (0.9 mi) epicenter difference with USGS
GFZ (German Research Centre for Geosciences)
6.1
10 km
6.2 mi
(*)
11:47:04
Vanuatu Islands
5.1 km (3.2 mi) epicenter difference with USGS
RaspberryShake (RaspberryShake)
6.2
10 km
6.2 mi
(*)
11:47:03.953
Vanuatu Islands
13 km (8.1 mi) epicenter difference with USGS
BMKG (Meteorological, Climatological, and Geophysical Agency of Indonesia)
6.0
1.1 km
0.7 mi
11:47:03.44
±0.31s
VANUATU
1.6 km (1 mi) epicenter difference with USGS
Epicenter uncertainty: ± 4.2 km
EMSC (European-Mediterranean Seismological Centre)
6.2
8.6 km
5.3 mi
11:47:04.176
Vanuatu Islands [Sea: Vanuatu]
4.8 km (3 mi) epicenter difference with USGS
Epicenter uncertainty: ± 11 km
INGV (Istituto Nazionale di Geofisica e Vulcanologia)
5.9
29 km
18 mi
±5.2 km
11:47:07.427
±0.69s
Offshore Vanuatu
2.8 km (1.7 mi) epicenter difference with USGS
Epicenter uncertainty: ± 3 km
GeoAu (Geoscience Australia )
6.0
10 km
6.2 mi
(*)
11:47:03.8
165 km NW of Port-Olry, Vanuatu
0 km (0 mi) epicenter difference with USGS
NNSN (Norwegian National Seismic Network)
Notes:
(*) A depth given as 10 km often means that the the depth of the quake could be not determined with sufficient accuracy.
SeismogramsSeismic station: Honiara, Solomon Islands (HNR/IU network) | Distance from quake: 828 km / 514 mi | Show on map | Station Info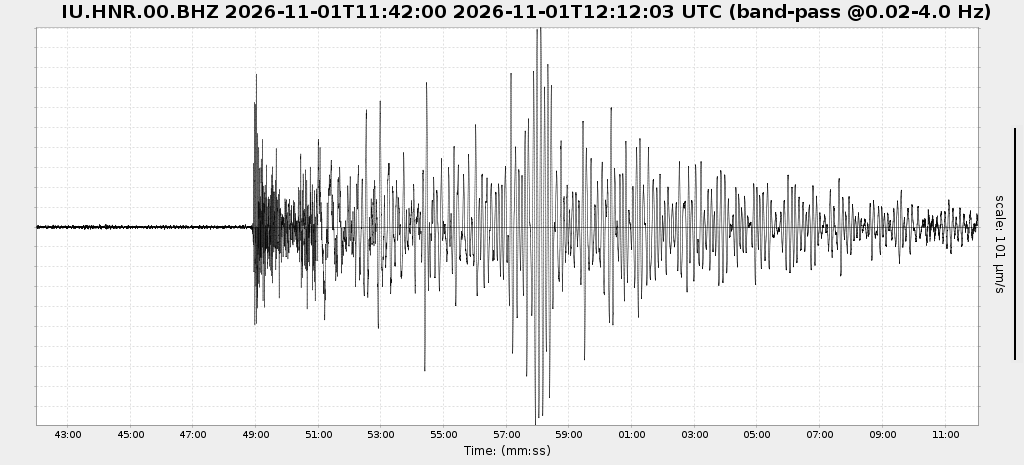 Seismogram (vertical component) around time of quake. Thin dotted red line indicates time of quake. Seismic waves arrive some time later, depending on distance. Bandpass filter applied: 0.02-4.0 Hz. Source: NSF SAGE Facility IRISWS timeseriesplot Web ServiceSeismic station: Monasavu, Fiji (MSVF/II network) | Distance from quake: 1366 km / 849 mi | Show on map | Station Info
Show more
Show less
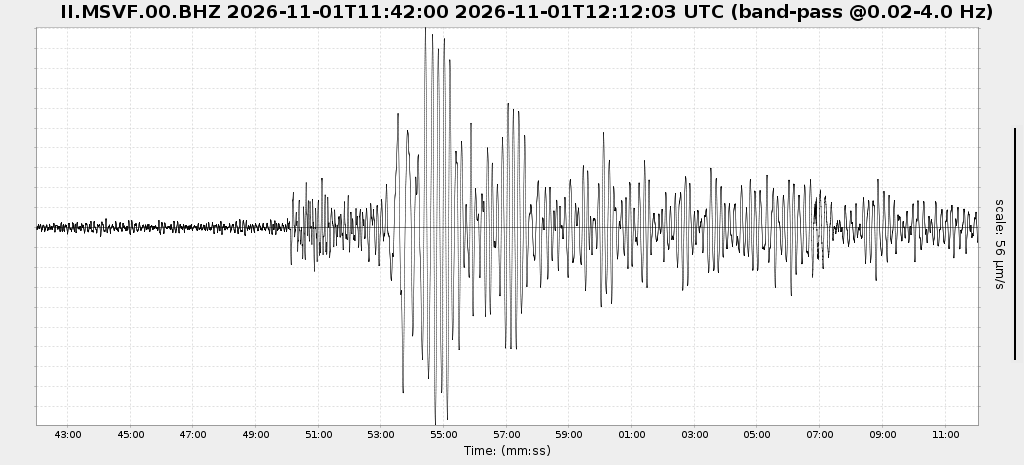 Seismogram (vertical component) around time of quake. Thin dotted red line indicates time of quake. Seismic waves arrive some time later, depending on distance. Bandpass filter applied: 0.02-4.0 Hz. Source: NSF SAGE Facility IRISWS timeseriesplot Web ServiceSeismic station: Tarawa Island, Republic of Kiribati (TARA/IU network) | Distance from quake: 1895 km / 1177 mi | Show on map | Station Info
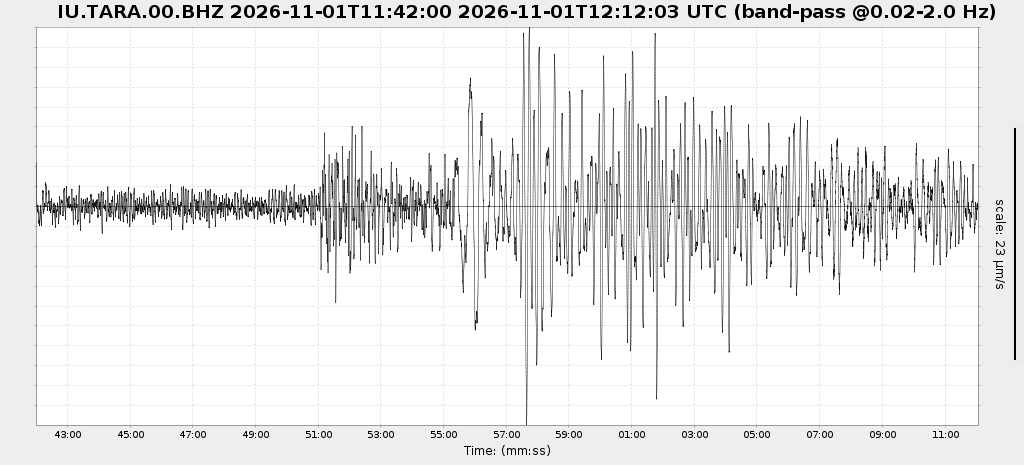 Seismogram (vertical component) around time of quake. Thin dotted red line indicates time of quake. Seismic waves arrive some time later, depending on distance. Bandpass filter applied: 0.02-2.0 Hz. Source: NSF SAGE Facility IRISWS timeseriesplot Web ServiceSeismic station: Port Moresby, New Guinea (PMG/IU network) | Distance from quake: 2099 km / 1304 mi | Show on map | Station Info
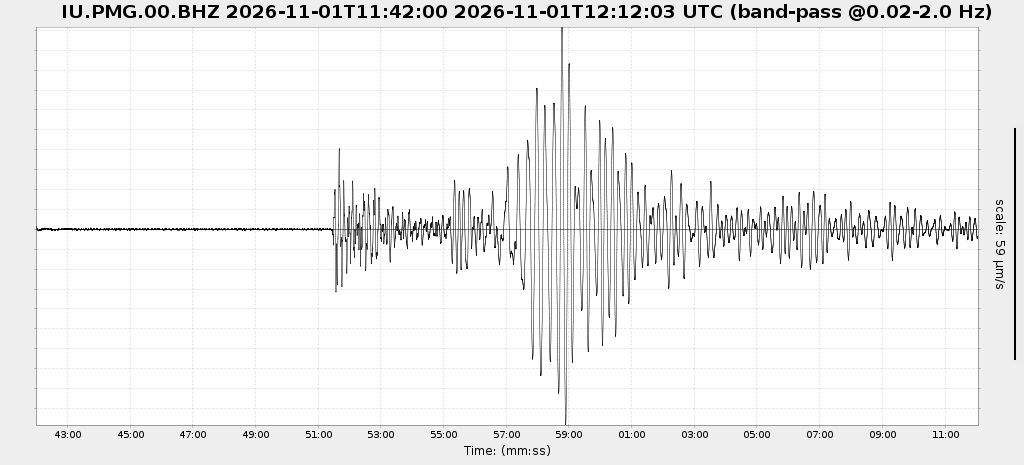 Seismogram (vertical component) around time of quake. Thin dotted red line indicates time of quake. Seismic waves arrive some time later, depending on distance. Bandpass filter applied: 0.02-2.0 Hz. Source: NSF SAGE Facility IRISWS timeseriesplot Web ServiceSeismic station: Charters Towers, Australia (CTAO/IU network) | Distance from quake: 2180 km / 1354 mi | Show on map | Station Info
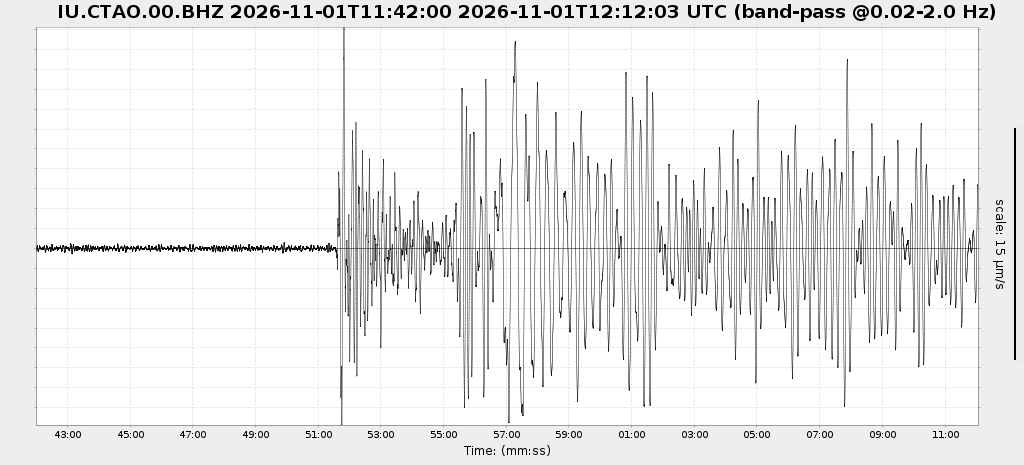 Seismogram (vertical component) around time of quake. Thin dotted red line indicates time of quake. Seismic waves arrive some time later, depending on distance. Bandpass filter applied: 0.02-2.0 Hz. Source: NSF SAGE Facility IRISWS timeseriesplot Web ServiceSeismic station: South Karori, New Zealand (SNZO/IU network) | Distance from quake: 3138 km / 1950 mi | Show on map | Station Info
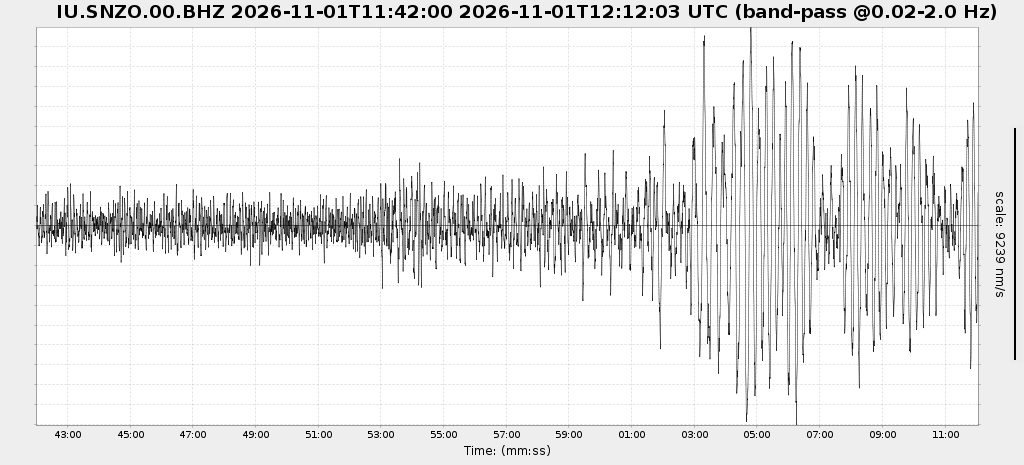 Seismogram (vertical component) around time of quake. Thin dotted red line indicates time of quake. Seismic waves arrive some time later, depending on distance. Bandpass filter applied: 0.02-2.0 Hz. Source: NSF SAGE Facility IRISWS timeseriesplot Web ServiceSeismic station: Tennant Creek, NT, Australia (WRAB/II network) | Distance from quake: 3400 km / 2113 mi | Show on map | Station Info
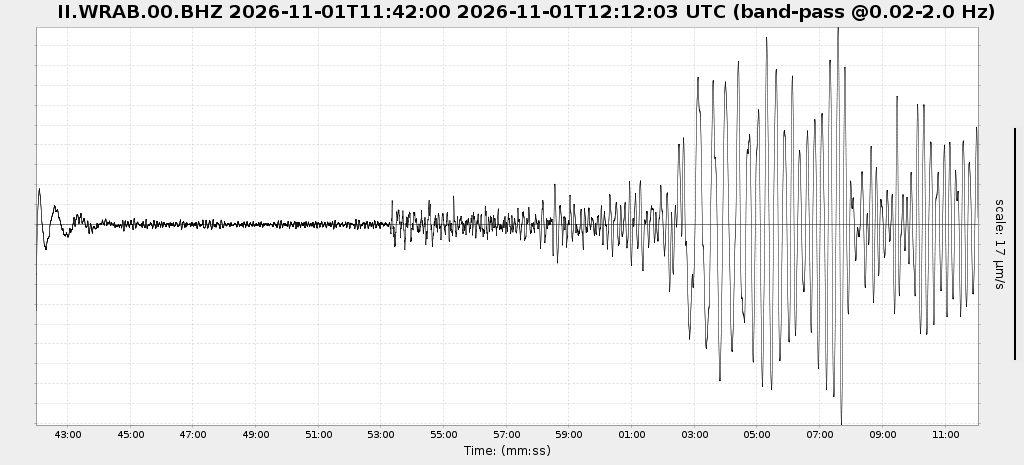 Seismogram (vertical component) around time of quake. Thin dotted red line indicates time of quake. Seismic waves arrive some time later, depending on distance. Bandpass filter applied: 0.02-2.0 Hz. Source: NSF SAGE Facility IRISWS timeseriesplot Web Service
Earthquake statisticsAverage number of earthquakes
Based on data from the past 26 years and our earthquake archive back to 1900, there are about 14 quakes on average per year in the area near the epicenter of this quake (within 100 km/61 mi):
Mag. 7 or higher: 0.04 quakes per year (or 1 quake every 25.6 years)Mag. 6 or higher: 0.25 quakes per year (or 1 quake every 4 years)Mag. 5 or higher: 3.8 quakes per yearMag. 4 or higher: 11.3 quakes per yearMag. 3 or higher: 22.1 quakes per yearMag. 2 or higher: 28.9 quakes per yearMag. 1 or higher: 31.9 quakes per year (or 2.7 quakes per month)
The area where this quake occurred has a very high level of seismic activity. It has had at least 5 quakes above magnitude 7 since 1900, which suggests that larger earthquakes of this size occur infrequently, probably on average approximately every 25 to 30 years.
Number of quakes per year
Previous quakes in the same area of this earthquake
Max results10
2050100
All
Magnitude
All2+
3+4+5+
6+7+8+
Time before
48 hours
1 week
30 days
1 year
5 years
30 years
Any age
Date and Time Mag
DepthDistanceLocationDetailsMap
Map of earlier quakes in the area of this quake
Max results10
2050100
All
Magnitude
All2+
3+4+5+
6+7+8+
Time before
48 hours
1 week
30 days
1 year
5 years
30 years
Any age
Oldest quakes are shown in yellow, most recent in red.
[quakes -] [quakes +] [smaller] [bigger]