
Data sources and study population
This study adhered to the Strengthening the Reporting of Observational Studies in Epidemiology (STROBE) guidelines for observational research reporting. Data were obtained from the National Health and Nutrition Examination Survey (NHANES) managed by the U.S. Centers for Disease Control and Prevention (CDC) and the National Center for Health Statistics (NCHS). The procedures complied with ethical standards established by the NCHS Research Ethics Review Board, which granted approval for this study. Written informed consent was obtained from all participants. We downloaded data spanning 1999–2020 from the NHANES website (https://wwwn.cdc.gov/nchs/nhanes), encompassing 107,622 participants across 10 survey cycles. The dataset includes demographic information, laboratory data, and questionnaire responses.
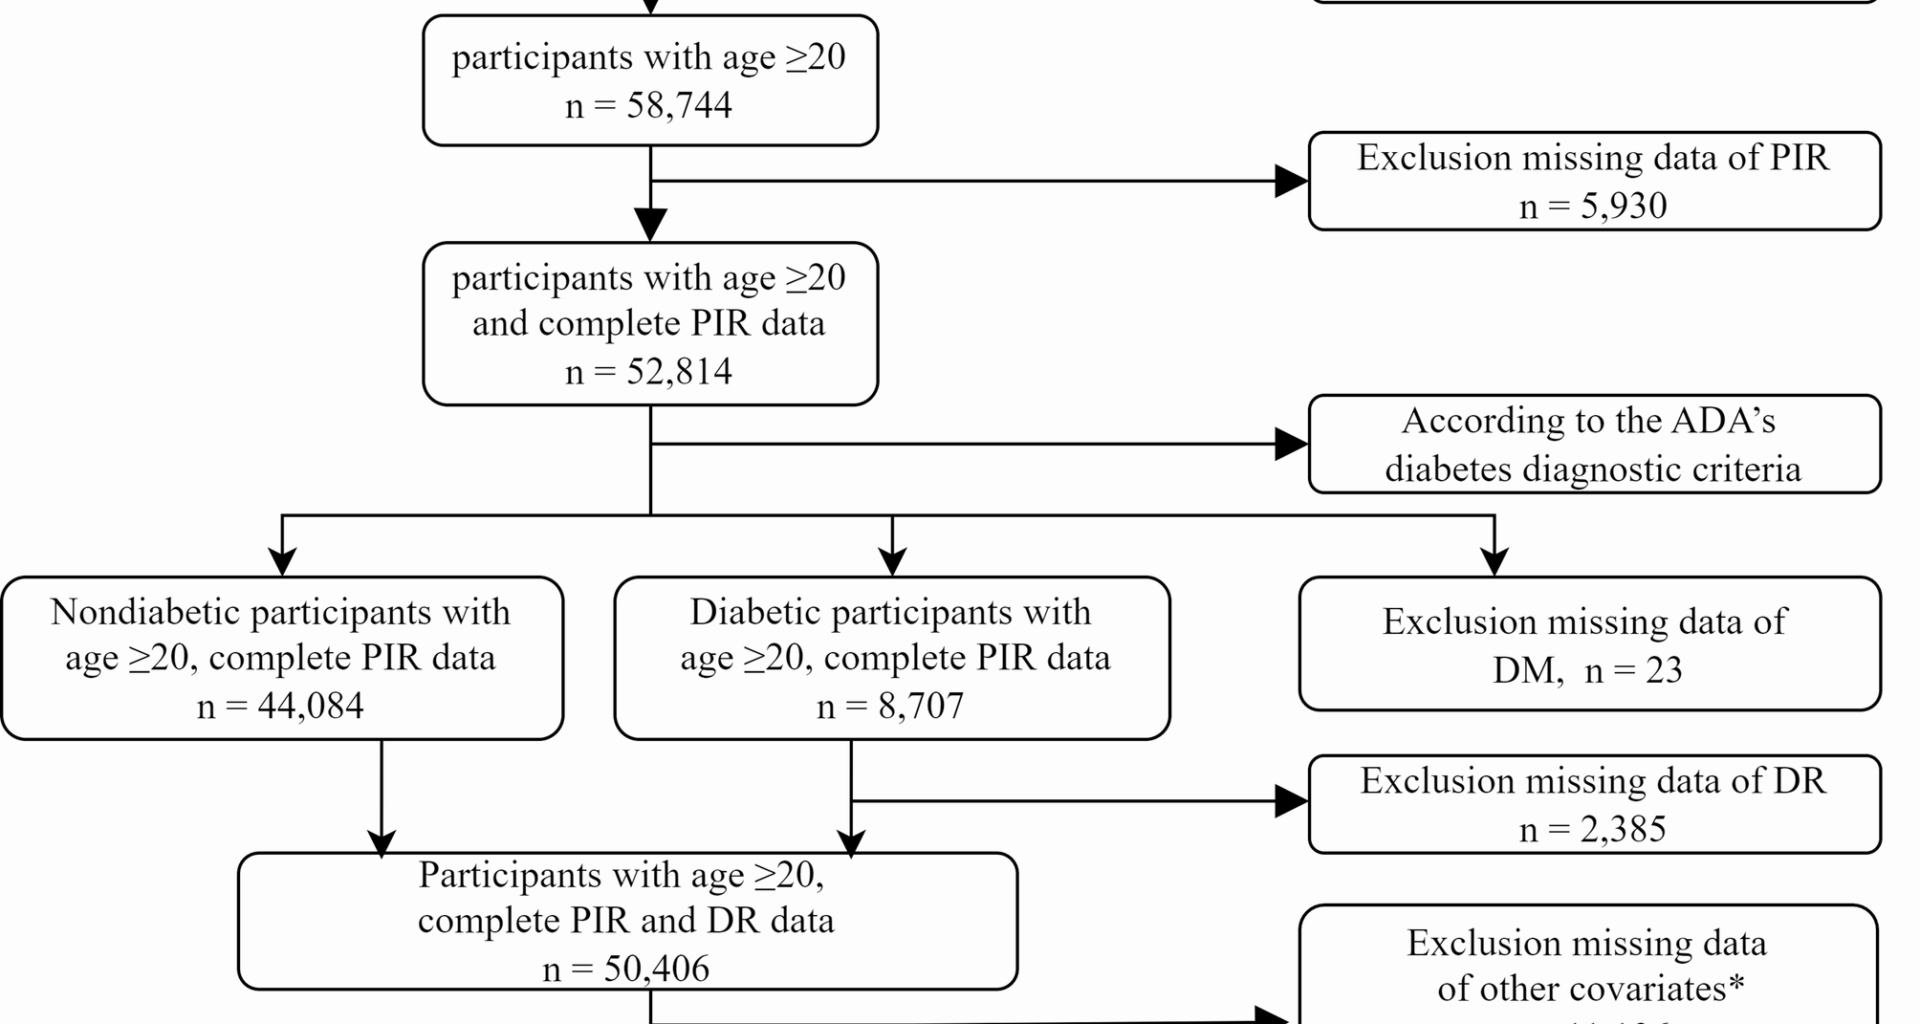
The study participants consisted of individuals aged 20 years and above in the United States, excluding those under the age of 20 (n = 48,878) and those with missing PIR data (n = 5,930). According to the American Diabetes Association (ADA) diagnostic criteria for diabetes [11] diabetes is defined as having any of the following conditions: (a) fasting plasma glucose (FPG) level ≥ 7.0 mmol/L or HbA1c concentration ≥ 6.5% or 2-h PG ≥ 11.1 mmol/L during the OGTT; (b) a response ‘yes’ to the question: ‘Doctor told you have diabetes?’ or ‘Taking insulin now?’. For participants with diabetes, we excluded those who lacked self-reported data on DR (n = 2,385); for nondiabetic participants, missing self-reported data on DR were standardized as not having DR. Missing data of DM and DR were also excluded. Additionally, 11,196 participants had missing data on other covariates. Ultimately, 39,210 cases were included in the final sample (see Fig. 1).
Fig. 1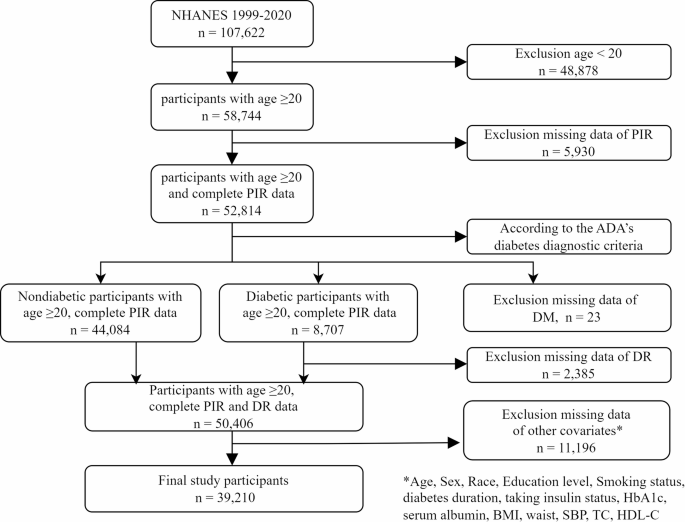
Flow chart illustrating the selection of participants in the NHANES from 1999–2020. DM, diabetes mellitus; DR, diabetic retinopathy; BMI, body mass index; SBP, systolic blood pressure; TC, total cholesterol; HDL-C, high-density lipoprotein cholesterol
Assessment of PIR
According to the NHANES official website, PIR variable was calculated by dividing family income (INDFMIN2) by poverty guidelines, which are specific to family size, as well as the appropriate year and state. The values were not computed if the income screener information (INQ 220: < $20,000 or ≥ $20,000) was the only family income information reported. If family income was reported as a range value, the midpoint of the range was used to compute the variable. Values at or above 5.00 were coded as 5.00 or more due to disclosure concerns. The values were not computed if the family income data were missing. In this study, we categorized individuals with PIR < 5 into Group 1 and those with PIR ≥ 5 into Group 2.
Assessment of DR
The occurrence of DR is considered as the outcome factor in this study. DR is defined as a response ‘yes’ to the question “Has any doctor ever told you that diabetes has affected your eyes or that you had retinopathy?” Nondiabetic patients lacking these self-reported data were categorized as ‘No’.
Study variables
The demographic variables included in this analysis were participants’ age (years), sex (male or female), race (Mexican American, other Hispanic, non-Hispanic white, non-Hispanic black, or other race), and education level (below high school, high school, or above high school). In addition, according to clinical practice and covariate screening, we also included body mass index (BMI), waist circumference, smoking status, disease duration, taking insulin status, HbA1c, serum albumin (ALB), systolic blood pressure (SBP), total cholesterol (TC), and high-density lipoprotein cholesterol (HDL-C) reported by the NHANES. BMI was calculated as weight in kilograms divided by the square of height in meters and was grouped into underweight (< 18.5), normal (18.5 to < 25), overweight (25 to < 30), and obese (≥ 30). Smoking status was classified as never-smoker (smoking fewer than 100 cigarettes in their entire life), former smoker (smoking more than 100 cigarettes but having quit smoking) or current smoker (smoking at least 100 cigarettes in their entire life). The duration of diabetes was calculated by subtracting the age of diabetes obtained for the first time from the age. For nondiabetic participants, missing self-reported data on taking insulin were standardized as not taking insulin. The waist circumference, HbA1c, serum ALB, SBP, TC and HDL-C data were extracted from the NHANES website.
Statistical analysis
Continuous variables are reported as medians and interquartile ranges (IQRs), whereas categorical variables are presented as numbers and percentages. The normality of continuous variables was examined via the Shapiro‒Wilk test. Student’s t test was used for normally distributed continuous variables, and the Mann‒Whitney U test was used for nonnormally distributed continuous variables. The chi-square test was used to compare categorical variables. A simple deletion method was used for variables with missing data.
We conducted univariate logistic regression analysis and multivariate logistic regression analysis to control the potential confounders. Two logistic regression models adjusted for different confounders were established in this study. Model 1 was adjusted for age, sex, race, and education level. Model 2 was adjusted for age, sex, race, education level, BMI, waist circumference, smoking status, duration of diabetes, taking insulin status, HbA1c, serum ALB, SBP, TC and HDL-C. Adjusted odds ratios (ORs) and 95% confidence intervals (CIs) were calculated to study the relationship between PIR and the prevalence of DR. To reduce potential bias, we also performed subgroup analysis and interaction analysis on age (20–39, 40–59, > 60), sex, race, education level, BMI, smoking status, and taking insulin status. To explore the association between PIR and prevalence of DR, RCS analyses were performed. In the RCS model, we also adjusted for all confounding factors. The predictive validities were quantified as areas under the ROC curves. All the data were statistically analyzed via R software (version 4.4.2).