
Study selection
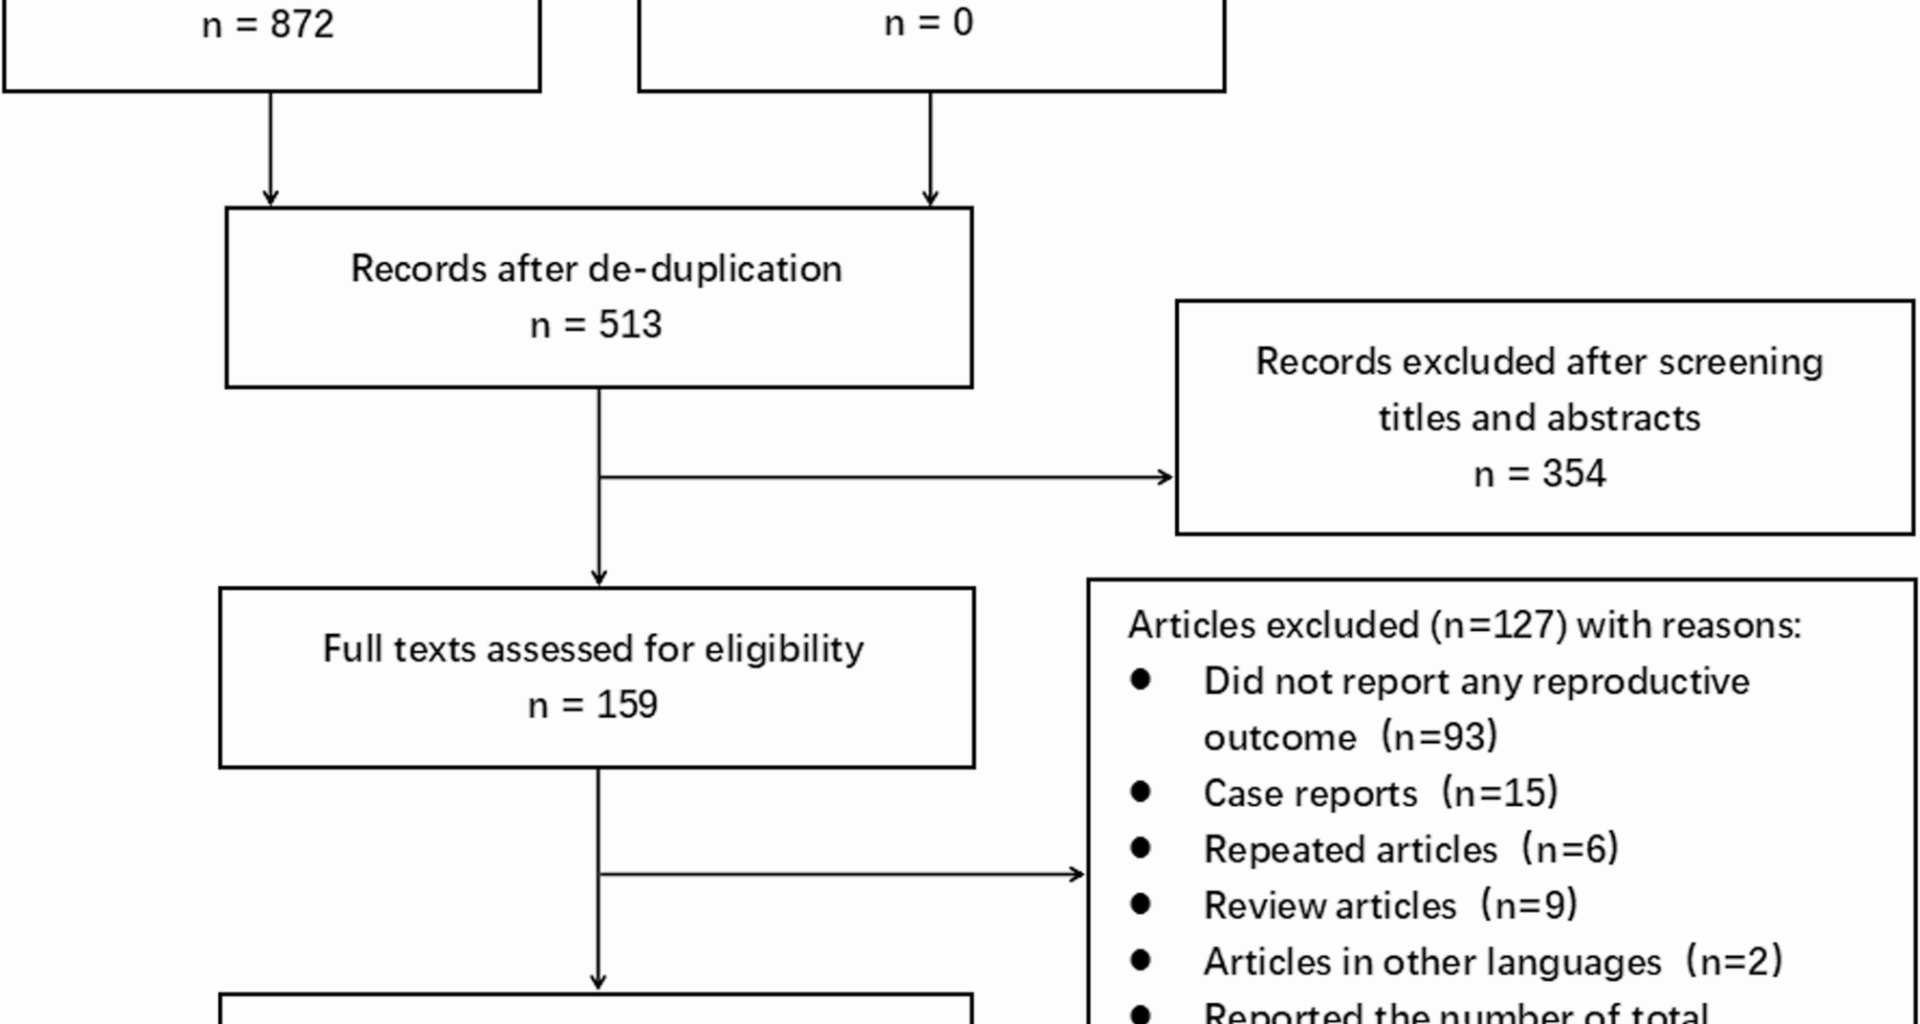
The titles and abstracts of 513 records retrieved from databases after de-duplication were screened, and the full texts of 159 articles were further assessed for eligibility. A total of 127 articles that did not meet the inclusion criteria were excluded. We excluded articles that did not report any reproductive outcome (n = 93), case reports (n = 15), repeated articles (n = 6), review articles (n = 9), articles in other languages (n = 2), and articles that reported the total number of participants rather than the number of participants desiring fertility (n = 2). Therefore, 32 articles [19,20,21,22,23,24,25,26,27,28,29,30,31,32,33,34,35,36,37,38,39,40,41,42,43,44,45,46,47,48,49,50] that met the prespecified criteria were included in the meta-analysis. Of these, 19 articles [19,20,21,22,23,24,25,26,27,28,29,30,31,32,33,34,35,36,37] focused on adenomyomectomy, one article [38] focused on UAE, and 13 articles [33, 39,40,41,42,43,44,45,46,47,48,49,50] focused on image-guided thermal ablation (HIFU: 10 articles [33, 39,40,41,42,43,44,45,46,47], RFA: 2 articles [48, 49], MWA: 1 article [50]). One article [33] compared the reproductive outcomes of patients treated with laparoscopic and HIFU. As only one article regarding UAE was included, the meta-analysis for UAE could not be performed. (Fig. 1)
Fig. 1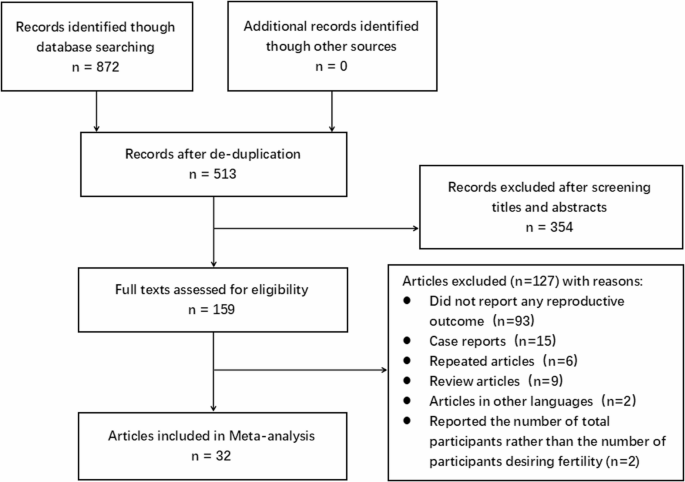
PRISMA flow chart for study selection
Study characteristics
Among the included articles comprising 2501 participants, 903 (36.1%) underwent adenomyomectomy, 6 (0.2%) underwent UAE, and 1592 (63.7%) received thermal ablation (1435 underwent HIFU, 118 underwent RFA, and 39 underwent MWA). The proportions of study design, geographic area, and language of articles are presented in Table 1.
Table 1 Summary of the included studies
Table 2 provides a comprehensive summary of the first author, publication year, treatments, surgical approach, the number and age of participants desiring fertility, follow-up duration, type of adenomyosis, history of subfertility, and dimensions of the uterus and adenomyosis. Table 3 offers a detailed overview of reproductive outcomes from each article, including pregnancy rate, delivery rate, pregnancy loss rate, spontaneous miscarriage rate, rate of adverse pregnancy outcomes, preterm delivery rate, IVF-ET conception rate, cesarean section rate, birthweight, and gestational age at delivery following treatments. The included articles exhibited a range of follow-up durations (spanning from 6 months to 10 years). Nineteen articles (55.9%) specified the type of adenomyosis, and 17 articles (50.0%) documented the participants’ subfertility history before treatments. Due to data limitations, it was challenging to determine whether there were statistically significant differences between these treatment groups in terms of participant age, follow-up duration, and baseline uterus and adenomyosis sizes.
Table 2 Characteristics of the included studies (N = 32)Table 3 Reproductive outcomes of the included studies (N = 32)Risk of bias of included studies
An assessment of the risk of bias and evidence quality for each article was conducted using the Newcastle-Ottawa Scale quality assessment tool, evaluating selection, comparability, and outcome (Table 4). Of these articles, eight (25.0%) were classified as high quality, 23 (71.9%) were classified as medium quality, and only one (3.1%) was classified as poor quality. The primary factors diminishing the quality of studies were: (1) comparability of cases and controls: most articles (53.1%) were clinical single-arm studies lacking a control group; (2) length of follow-up duration: a short follow-up period of less than 24 months in 21.9% of the articles was insufficient for reproductive outcomes to manifest; (3) lost to follow-up: a rate of loss to follow-up exceeding 20% was considered to impact the quality of the studies; (4) risk of selection bias.
Table 4 Quality assessment with Newcastle-Ottawa scale quality assessment toolSynthesis of results
Table 5 presents the synthesized reproductive outcomes following these fertility-sparing interventions for symptomatic adenomyosis. Tables 6 and 7 provide the results of subgroup analysis and sensitivity analysis, respectively. Figure 2 illustrates the histogram of the meta-analysis for reproductive outcomes. Figures 3, 4, 5, 6, 7, 8, 9 and 10 display the forest plots of the meta-analysis for reproductive outcomes.
Table 5 Results of Meta-analysis for reproductive outcomes after different fertility-sparing interventionsTable 6 Results of subgroup analysis for adenomyomectomy groupTable 7 Results of sensitivity analysis for studies with follow-up ≥ 36 months after adenomyomectomyFig. 2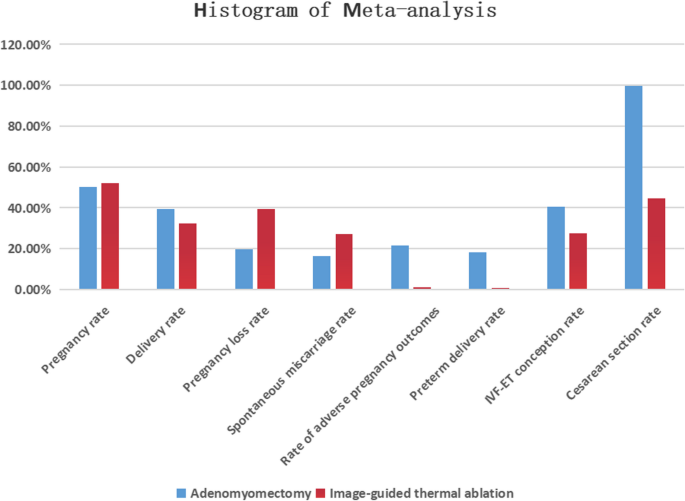
Histogram of meta-analysis for reproductive outcomes
Fig. 3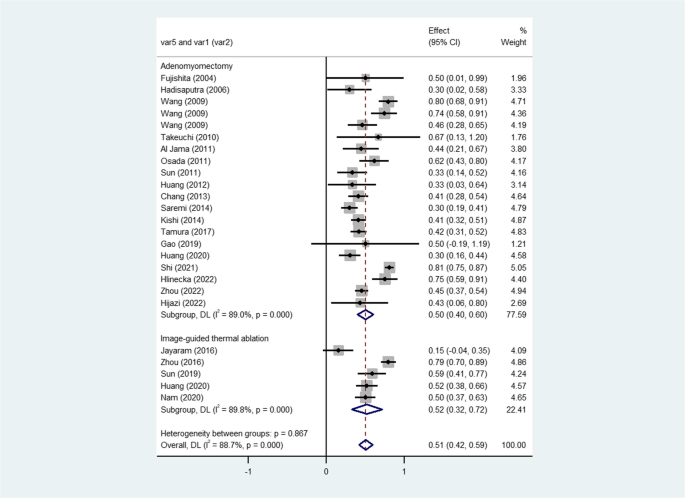
Forest plot of pooled pregnancy rates after fertility-sparing treatments for adenomyosis
Fig. 4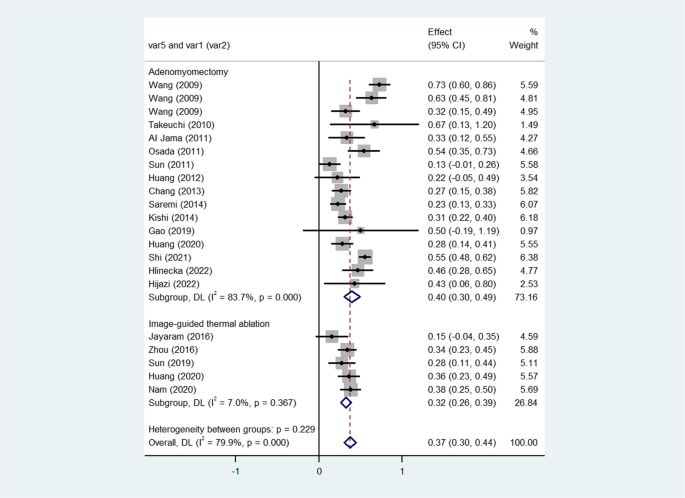
Forest plot of pooled delivery rates after fertility-sparing treatments for adenomyosis
Fig. 5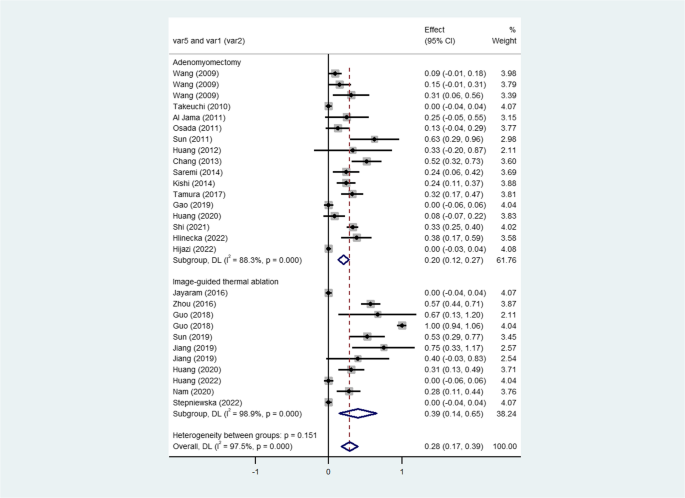
Forest plot of pooled pregnancy loss rates after fertility-sparing treatments for adenomyosis
Fig. 6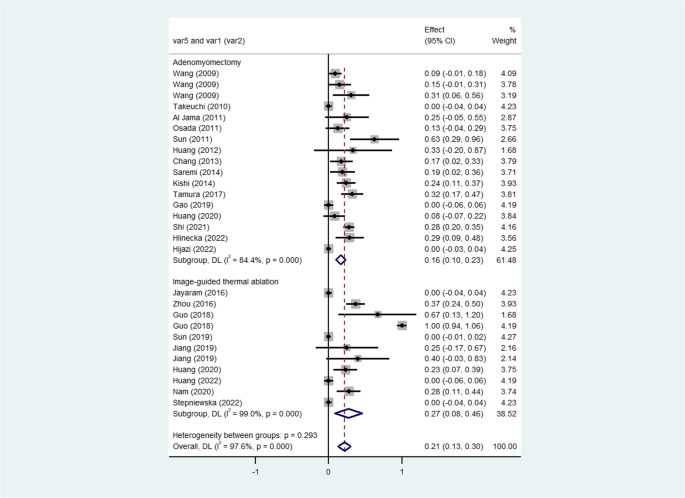
Forest plot of pooled spontaneous miscarriage rates after fertility-sparing treatments for adenomyosis
Fig. 7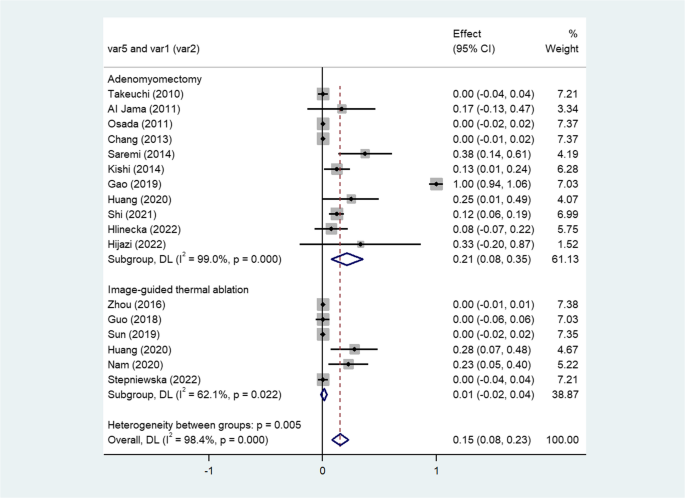
Forest plot of pooled rates of adverse pregnancy outcomes after fertility-sparing treatments for adenomyosis
Fig. 8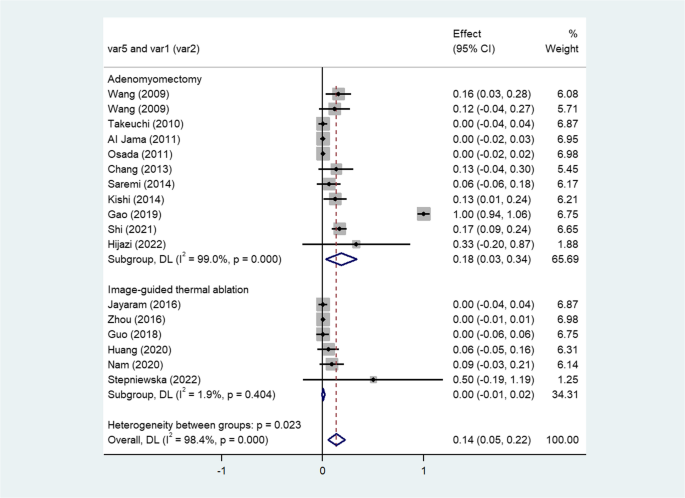
Forest plot of pooled preterm delivery rates after fertility-sparing treatments for adenomyosis
Fig. 9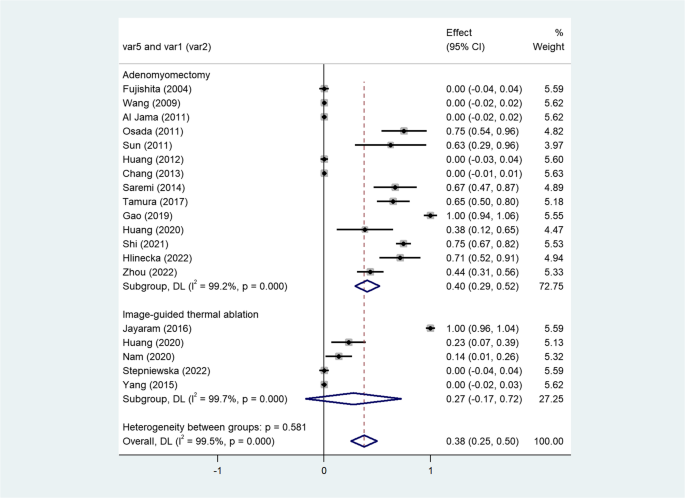
Forest plot of pooled IVF-ET conception rates after fertility-sparing treatments for adenomyosis. (IVF-ET: in vitro fertilization and embryo transfer)
Fig. 10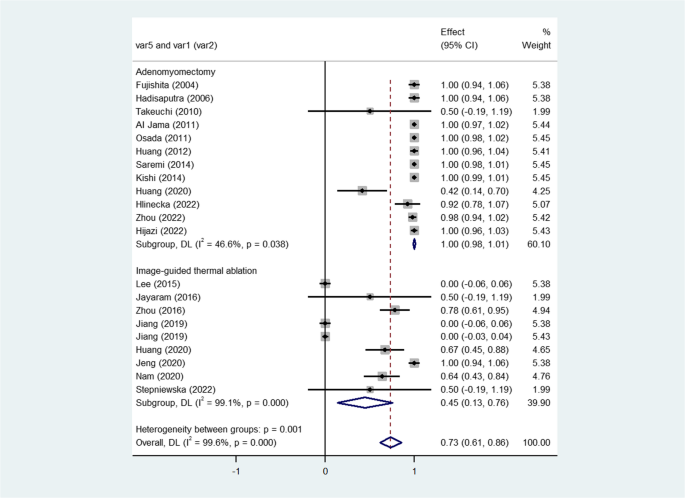
Forest plot of pooled cesarean section rates after fertility-sparing treatments for adenomyosis
Pregnancy rate
The pregnancy rates were 50.1% (95% CI, 40.0% to 60.2%, P < 0.001; I²=89.0%; 19 studies) following adenomyomectomy and 52.0% (95% CI, 32.4% to 71.6%, P < 0.001; I²=89.8%; 5 studies) following thermal ablation. The overall pregnancy rate after these treatments was 50.5% (95% CI, 41.9% to 59.2%, P < 0.001, I²=88.7%; 23 studies). Certainty of evidence: high. (Table 5; Fig. 3)
Delivery rate
The delivery rates were 39.5% (95% CI, 29.9% to 49.2%, P < 0.001; I²=83.7%; 15 studies) in adenomyomectomy group and 32.5% (95% CI, 26.0% to 38.9%, P = 0.367; I²=7.0%; 5 studies) in thermal ablation group. The overall delivery rate was 37.1% (95% CI, 29.7% to 44.5%, P < 0.001, I²=79.9%; 19 studies) after these treatments. The certainty of evidence was low due to ongoing pregnancy reported in six studies (with missing results), preventing an exact calculation of the delivery rate. (Table 5; Fig. 4)
Pregnancy loss rate
The pregnancy loss rates were 19.8% (95% CI, 12.2% to 27.5%, P < 0.001; I²=88.3%; 16 studies) for adenomyomectomy and 39.5% (95% CI, 13.8% to 65.1%, P < 0.001; I²=98.9%; 9 studies) for thermal ablation. The overall pregnancy loss rate after these uterine-sparing treatments was 28.3% (95% CI, 17.2% to 39.4%, P < 0.001, I²=97.5%; 24 studies). Certainty of evidence: medium. (Table 5; Fig. 5)
Spontaneous miscarriage rate
The spontaneous miscarriage rates were 16.3% (95% CI, 9.7% to 22.9%, P < 0.001; I²=84.4%; 16 studies) following adenomyomectomy and 27.1% (95% CI, 8.1% to 46.1%, P < 0.001; I²=99.0%; 9 studies) following thermal ablation. The overall spontaneous miscarriage rate after these treatments was 21.4% (95% CI, 12.5% to 30.3%, P < 0.001, I²=97.6%; 24 studies). Certainty of evidence: medium. (Table 5; Fig. 6)
Rate of adverse pregnancy outcomes
The rates of adverse pregnancy outcomes were 21.4% (95% CI, 7.5% to 35.3%, P < 0.001; I²=99.0%; 11 studies) in adenomyomectomy group and 1.0% (95% CI, −1.6% to 3.7%, P = 0.022; I²=62.1%; 6 studies) in thermal ablation group. The overall rate of adverse pregnancy outcomes was 15.3% (95% CI, 7.9% to 22.7%, P < 0.001, I²=98.4%; 16 studies) after these treatments. Certainty of evidence: medium. (Table 5; Fig. 7)
Preterm delivery rate
The preterm delivery rates were 18.4% (95% CI, 2.9% to 33.9%, P < 0.001; I²=99.0%; 10 studies) for adenomyectomy and 0.3% (95% CI, −1.0% to 1.7%, P = 0.404; I²=1.9%; 6 studies) for thermal ablation. The overall preterm delivery rate after these treatments was 13.5% (95% CI, 5.0% to 22.1%, P < 0.001, I²=98.4%; 16 studies). Certainty of evidence: medium. (Table 5; Fig. 8)
IVF-ET conception rate
The IVF-ET conception rates were 40.5% (95% CI, 28.8% to 52.1%, P < 0.001; I²=99.2%; 14 studies) after adenomyomectomy and 27.5% (95% CI, −17.3% to 72.2%, P < 0.001; I²=99.7%; 5 studies) after thermal ablation. The overall IVF-ET conception rate after these treatments was 37.5% (95% CI, 25.2% to 49.8%, P < 0.001, I²=99.5%; 18 studies). Certainty of evidence: medium. (Table 5; Fig. 9)
Cesarean section rate
The cesarean section rates were 99.6% (95% CI, 98.3% to 100.8%, P = 0.038; I²=46.6%; 12 studies) in adenomyomectomy group and 44.6% (95% CI, 13.4% to 75.9%, P < 0.001; I²=99.1%; 9 studies) in thermal ablation group. The overall cesarean section rate was 73.5% (95% CI, 61.2% to 85.7%, P < 0.001, I²=99.6%; 20 studies) after these treatments. Certainty of evidence: medium. (Table 5; Fig. 10)
Subgroup analysis
We performed subgroup analysis when the results indicated significant heterogeneity (I² statistic > 50%). However, subgroup analyses were limited to the adenomyomectomy group due to the scarcity of studies in the UAE and thermal ablation groups. The subgroup analyses were conducted according to surgical approach, whether participants received adjuvant hormone therapy, age of participants, type of adenomyosis, size of adenomyosis, and year of publication. The subgroup analysis results demonstrated a significant reduction in heterogeneity (I² statistic ≤ 50%) for the following outcomes: pregnancy rates for laparotomy and diffuse adenomyosis, pregnancy loss rates for adenomyomectomy without adjuvant hormone therapy and for diffuse adenomyosis, spontaneous miscarriage rates for adenomyomectomy without adjuvant hormone therapy and for diffuse adenomyosis, adverse pregnancy outcomes rates for average diameter of adenomyosis lesion < 50 mm and ≥ 50 mm, preterm delivery rate for average diameter of lesion ≥ 50 mm, IVF-ET conception rates for adenomyomectomy without adjuvant hormone therapy and for lesion < 50 mm in diameter, and cesarean section rate for laparotomy. However, significant heterogeneity (I² >50%) persisted in the remaining results of the subgroup analysis. (Table 6)
Sensitivity analysis
We performed sensitivity analyses for studies with a follow-up duration ≥ 36 months by excluding those with a follow-up duration < 36 months in the adenomyomectomy group. The results indicated that the pregnancy rate was 54.2% (95% CI, 40.0% to 68.5%, P < 0.001; I²=88.1%; 10 studies). The delivery rate was 40.0% (95% CI, 28.8% to 51.2%, P = 0.001; I²=70.2%; 8 studies). The pregnancy loss rate was 26.8% (95% CI, 11.0% to 42.6%, P < 0.001; I²=88.7%; 8 studies). The spontaneous miscarriage rate was 19.6% (95% CI, 7.5% to 31.7%, P < 0.001; I²=81.6%; 8 studies). The rate of adverse pregnancy outcomes was 23.2% (95% CI, 3.7% to 42.7%, P < 0.001; I²=99.5%; 6 studies). The preterm delivery rate was 26.1% (95% CI, 0.1% to 52.0%, P < 0.001; I²=99.6%; 5 studies). The IVF-ET conception rate was 34.6% (95% CI, 21.7% to 47.6%, P < 0.001; I²=99.4%; 10 studies). However, the results of sensitivity analysis still showed significant heterogeneity (I² >50%). We did not perform a sensitivity analysis for the cesarean section rate because the result exhibited low heterogeneity (I² statistic ≤ 50%). (Table 7)