

Structure and polar skyrmion of the as-grown thin film
The model system used in this study was the PTO/STO superlattice on a SrTiO3 (001) substrate. Previous studies have shown that polar skyrmions can be observed in this material at room temperature7. The superlattice of [10 uc PTO/2 uc STO]20 ([(PTO)10/(STO)2]20) with total thickness of 100 nm was fabricated on 5 nm LSMO, and [16 uc PTO/16 uc STO]16 ([(PTO)16/(STO)16]16) with total thickness of 200 nm was fabricated on 5 nm SrRuO3 on TiO2-terminated single-crystalline SrTiO3 (001) substrates by reflection high-energy electron diffraction (RHEED)-assisted pulsed-laser deposition (details in “Methods”). The θ-2θ X-ray diffraction (XRD) patterns reveal the high-quality epitaxial and periodic nature of the superlattice sample (Fig. 1a). Reciprocal space mapping (RSM) (Figs. 1b and S1a) at about the (002)-diffraction condition shows the several superlattice peaks, further confirming the periodic structure of the superlattice. Additionally, satellite peaks along the in-plane directions (side lobes, marked by arrows in Figs. 1b, and S1b), correspond to an ordered skyrmion phase with an in-plane modulation period ~25–30 nm for [(PTO)10/(STO)2]20 superlattice and 10–12 nm for ([(PTO)16/(STO)16]16 superlattice. The in situ transmission electron microscopy (TEM) observations were carried out on FEI Titan G2 80–200 ChemiSTEM in STEM mode (details in “Methods”). The planar view image of the pristine sample shows the formation of a disordered bubble state (Fig. 1c)7. The full 3-D structure and the corresponding polarization vector mappings extracted from TEM characterizations are further provided in Figs. S1c and 1d, which confirms the presence of polar skyrmion bubbles with hedge-hoge-like feature in the planar view and vortex-like structure in the cross-section view, consistent with the previous reports7,13. Dual AC resonance tracking piezo-force microscopy (DART-PFM) scanning (details in “Methods”) reveals skyrmion-like features, which are distinctly evident in both the vertical amplitude (Left, Fig. 1e) and phase (Right, Fig. 1e) images (few of them are marked with white circles). The darker areas within the circles possess a distinct polarization compared to their surroundings, attributed to the intrinsic swirling polarizations in skyrmions. The conducting atomic force microscopy (cAFM) characterizations are further performed, as shown in Fig. 1f, which demonstrates that the formation of polar skyrmions leads to higher local conductions, desired for potential applications in electronic devices. Such an enhanced local conduction for the core of the polar skyrmions has also been observed in previous literature25, which could be attributed to the band bending due to the local swirling polarization, as well as the bound charge induced by the local head-to-head polarization arrangement. Notably, the size of the region with enhanced conduction is approximately 2 nm, which corresponds to the characteristic length scale of the core of a polar skyrmion. Phase-field simulations are simultaneously performed to unveil the polar structure of the as-grown PTO/STO superlattice system (details in “Methods”, the model setup is provided in Fig. 1g). The calculated equilibrium polar texture under zero applied voltage shows skyrmion bubbles with a size of 10–20 nm (Fig. 1h), in good agreement with the experimental observations and previous reports7,11,13,29. It is interesting to note that the polar skyrmions are elongated oval structure rather than circular in shape, as shown in both the TEM images (Fig. 1c) and the simulation polar mapping (Fig. 1h). The observed size of the skyrmion is smaller in STEM measurement than that measured in PFM imaging, likely due to the resolution limitations of the PFM technique, which are inherently constrained by the tip size used during the measurements (Fig. S2)39.
Fig. 1: Structure and observation of polar skyrmions in PTO/STO superlattice.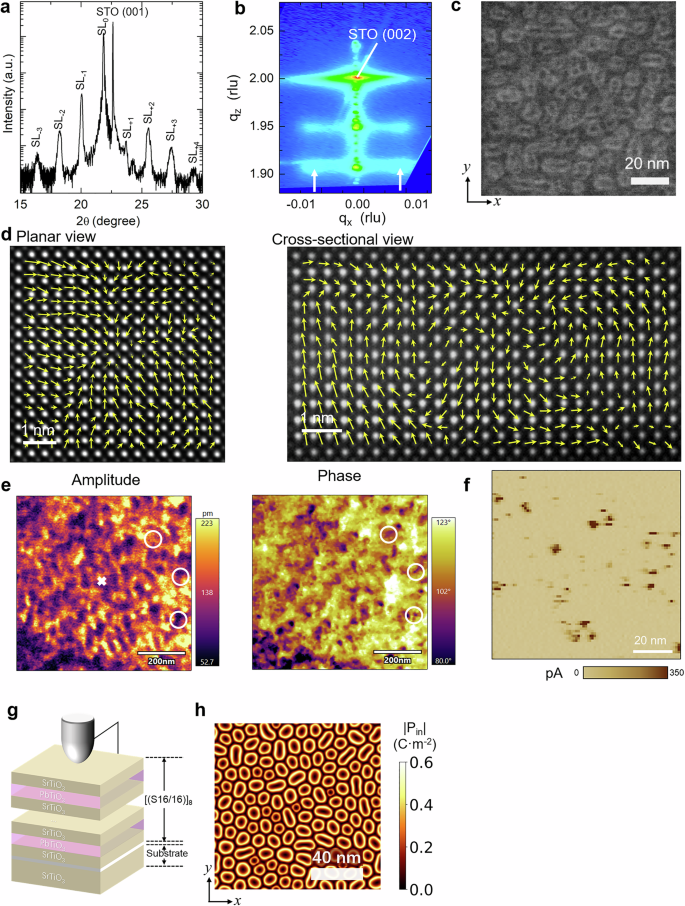
a XRD θ–2θ scan around (001)-reflection of the [(PTO)10/(STO)2]20 superlattice showing main superlattice film (SL0) peak along with several satellite peaks (SL1, SL−1, SL−2, and so), indicating the well periodic and high quality of the superlattice. b Reciprocal space mapping (RSM) around the (002)-reflection confirms again the well-periodic structure of the superlattice. Additionally, the appearance of side lobes along the in-plane direction (marked by white arrows) indicates the presence of the polar skyrmion phase in the samples. c Planar-view HAADF-STEM image of the [(PTO)16/(STO)16]16 superlattice shows the polar skyrmions. d Planar and cross-sectional polarization mapping from high resolution TEM images. e PFM images in DART mode, showing amplitude (left) and phase (right), highlighting the presence of polar skyrmions (marked by white circle). f cAFM images of the initial pristine sample, showing a higher conduction for the polar skyrmions. g Schematics of the model PTO/STO superlattice system with a charged probe on the top STO layer in the Phase-field simulations. Reprinted from Matter, 5, 3, Zhou et al.40 local manipulation and topological phase transitions of polar skyrmions, 1031–1041, Copyright (2022), with permission from Elsevier. h Simulated in-plane polar texture of the as-grown [(PTO)16/(STO)16]8 superlattice using phase-field simulations. Here, \(\left|{{{\rm{P}}}}_{{\mathrm{in}}}\right|\) is the magntitude of the in-plane polarization, defined by \(\left|{{\rm{P}}}_{{\mathrm{in}}}\right|=\sqrt{{P}_{{{\rm{x}}}}^{2}+{P}_{{{\rm{y}}}}^{2}}\).
Creation of the polar skyrmion bag
The concept of a polar skyrmion bag emerges from a pocket created within skyrmion walls, which contains skyrmions with opposite polarity to the walls. To create the skyrmion bag, an external electric field is applied through a charged tip to the skyrmion state (Fig. 2 and details in “Methods”). The schematics of the experimental setups (including the PFM and in situ STEM) are given in Fig. S3. The kinetic evolution of the in-plane polar pattern on the top PTO layer is simulated by the Phase-field simulations (Fig. 2a–f), the applied electric potential through a PFM tip is modeled by a Lorentz distribution, as plotted in Fig. S3a. The skyrmions underneath the probe region expand after 100 timesteps (Fig. 2a) due to the external out-of-plane electric field, consistent with previous reports11,40. Skyrmions near the edge of the tip become asymmetric due to the large in-plane field, resulting in greater in-plane polarization on the side near the tip. Consequently, the skyrmions near the edge of the tip are interconnected, effectively acting as a “fence” to separate the inner region near the tip from the outer region far away from the tip (Fig. 2b). Subsequently, after 10,000 timesteps (Fig. 2c), the skyrmions near the tip edge are displaced by the in-plane electric field, forming a ring-like pattern. Small skyrmions with opposite polarizations are observed upon melting of the stripes. After the applied field is removed, the asymmetric skyrmions recover to a circular pattern, and nucleation seeds gradually expand to a regular skyrmion, filling the region underneath the probe (Fig. 2d–f). Eventually, a grapefruit-like structure is formed, where 13 skyrmions are enclosed by a circular coat like pattern.
Fig. 2: Formation of polar skyrmion bag from skyrmion under applied potential with a charged tip.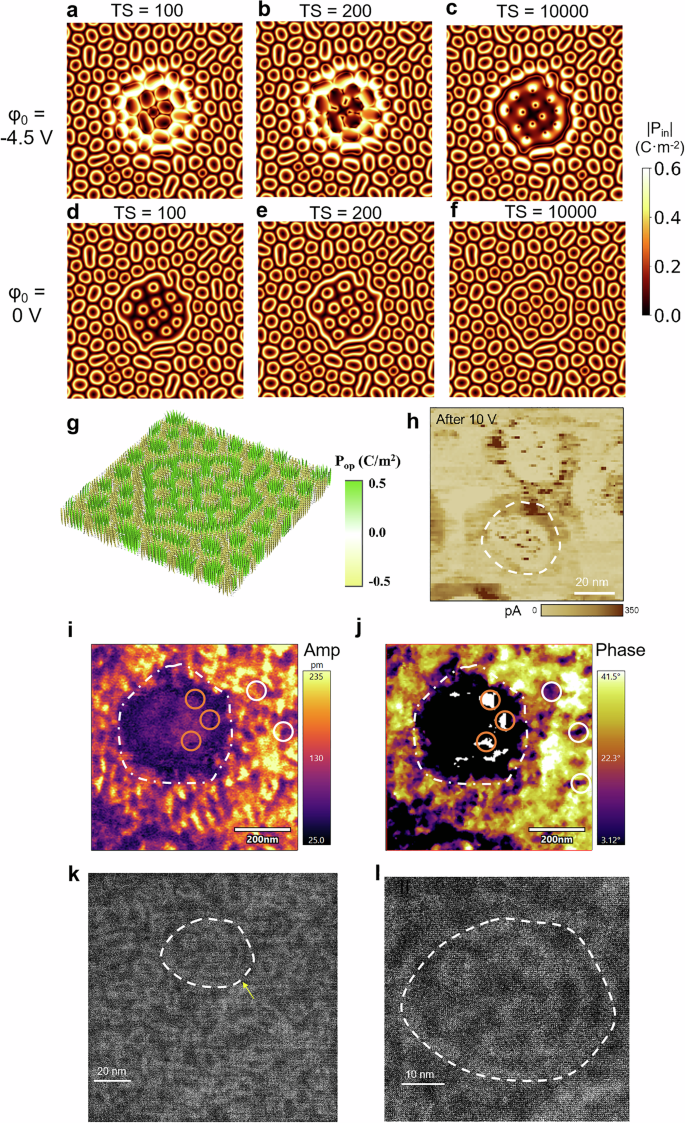
a–c The evolution kinetics from phase-field simulations (potential −4.5 V, diameter 40 nm) after 100, 200, and 10,000 timesteps, respectively, showing the expansion of skyrmions under the probe and their transformation into the “coat” of the skyrmion bag, forming nucleation seeds due to the blocking effect of outside skyrmions and mutual squeezing. d–f The relaxation kinetics after the field is removed, depicted after 100, 200, and 10000 timesteps, respectively, illustrate the recovery process where asymmetric skyrmions revert to a circular pattern, and nucleation seeds gradually expand into a regular skyrmion. g 3-D vector plot of the polar skyrmion bag. The positive/negative polarizations are shown in green/yellow. h cAFM image after poled with a charged tip under −10 V, showing the formation of two skyrmion bags. i, j Experimental observation of a polar skyrmion bag with PFM: an applied voltage of −15 V for approximately 20 msec induces the formation of a skyrmion bag, outlined by the white dashed ring. The skyrmions located outside the bag (indicated by a white circle) exhibit polarization opposite to those inside the bag (indicated by an orange circle). k Planar-view HAADF-STEM images showing the transitions from skyrmions and skyrmions bags after the bias loading. l The enlarged views of the skyrmions bags marked in (k).
The Pontryagin density of the topological feature of the grapefruit-like structure as calculated by phase-field simulation is depicted in Fig. S4a. Each inner skyrmion has a negative Pontryagin density, resulting in a net topological charge of −1. Conversely, the circular boundary exhibits alternating positive and negative Pontryagin density with an opposite topological charge of +1, similar to outside skyrmions. This implies that the inner skyrmions possess opposite polarity with outside skyrmions and the circular “coat”. The 3-dimensional polar vector arrangement of the polar skyrmion bag is shown in Fig. 2g, while the 3-D isosurface structure (Fig. S4b) reveals that the skyrmion bundles extend throughout the entire PTO layer in the z-direction, akin to the magnetic skyrmion bag32,34.
To experimentally harness a skyrmion bag, the cAFM measurements is performed to unveil the presence of polar skyrmion bags (Fig. 2h), it can be seen that after poled through a charged tip at −10 V, at least one ring formed, which enclosed multiple skyrmions inside (marked with white dashed line). The skyrmion bag wall shows a higher conduction comparable to the polar skyrmions. The PFM characterizations are further performed, with the PFM tip positioned over the designated area (indicated by a cross in Fig. 1d), and a bias voltage of −15 V was applied through the PFM tip of pulse duration 20 ms, resulting in the formation of a skyrmion bag within the [(PTO)10/(STO)2]20 superlattice. This phenomenon was observed in the PFM amplitude and phase images (Fig. 2i, j). The dashed white boundary highlights the perimeter of the skyrmion bag, which is visible in the PFM amplitude image as a darker contrast (Fig. 2i). The creation of the skyrmion bag structure is attributed to the merging of skyrmion walls, which interconnect to form a closed circular boundary. This boundary confines multiple skyrmions with distinct polarities within the bag.
The PFM images provide a detailed visualization of the skyrmion bag structure, aligning well with theoretical predictions. Several individual skyrmions inside and outside the bag are marked with orange and white circles, respectively. Additionally, it is also discovered that a skyrmion bag can form under lower voltages if the voltage is applied for a longer duration. For instance, applying a voltage of −6 V for 30 s can induce the formation of a polar skyrmion bag, as demonstrated in Fig. S5a, b. The PFM phase image and the butterfly loops (Fig. S5c–f) clearly reveals the opposite polarities of skyrmions inside and outside the skyrmion bag. Skyrmions located outside the bag exhibit a darker phase contrast, while those within the bag display a brighter phase contrast. This difference in polarity highlights the spatial variation in local polarization.
To confirm the universality of this phenomenon, additional experiments were conducted on the [(PTO)16/(STO)16]16 superlattice, with further details provided in Fig. S6. These results substantiate the reproducibility and robustness of skyrmion bag formation across different superlattice configurations. In situ STEM is further performed to validate the formation of the skyrmion bag, with the electrical bias of 20 V applied for ~30 s between a tungsten tip and the Au conductive layer (~5 nm) on the film top. It can be seen that after applying the electric pulse, a skyrmion bag structure is formed, with a clear boundary that encloses multiple skyrmions (Fig. 2k). The radius of the skyrmion bag is ~20 nm. The zoom-in image of the polar skyrmion bag is given in Fig. 2l, an oval-like skyrmion bag structure can be identified, with six polar skyrmions inside. It should be noted that in the phase-field simulations and STEM images, the skyrmions are closely packed within the skyrmion bag. In contrast, the PFM images show only a few skyrmions present in the skyrmion bag. This discrepancy is primarily due to the differences in tip radius and the relatively low resolution of the PFM technique. Nevertheless, the PFM and STEM characterizations clearly confirm the formation of polar skyrmion bag with electric potential applied through a charged tip. Moreover, the concept of polar skyrmion bag has been introduced by Sun et al.39 recently, as a circular structure that encloses several skyrmions inside, where the polarity inside and outside the circle remains the same. Notably, the skyrmion bags created in this study exhibit a different polarity inside the bag compared to the outside. This resembles the skyrmion bag observed in a magnetic system, which represents a distinctly different structure from that of Sun et al.39.
Erasure and recovery of skyrmion bag
It is also crucial to erase and recover the skyrmion bag for memory application. We explore ways to destruct and recover the skyrmion bag state by manipulating the sign of the applied potential (Fig. 3). Our phase-field simulations reveal that for the skyrmion bag state formed after poling at −4.5 V (Fig. 3a), while an applied potential of +4 V will switch the polarity of the inner skyrmions and break the “coat” region into several asymmetric walls (Fig. 3b). The kinetics of the “coat” destruction process is illustrated in Fig. S7. The melting of the skyrmion bag wall can be observed when +4 V is applied, accompanied by the shrinking of the inner skyrmions. Upon removal of the applied electric field, the asymmetric skyrmion walls evolve into long vortex stripes. While the nucleation seeds continue to grow, eventually forming a regular skyrmion pattern (Figs. 3c and S7f–j). The reconstruction of the skyrmion bag from this regular skyrmion pattern can be achieved by utilizing a repeatable −4 V pulse (Fig. 3d), indicating the excellent reliability and durability of this process.
Fig. 3: Erasing and recovering the skyrmion bag state.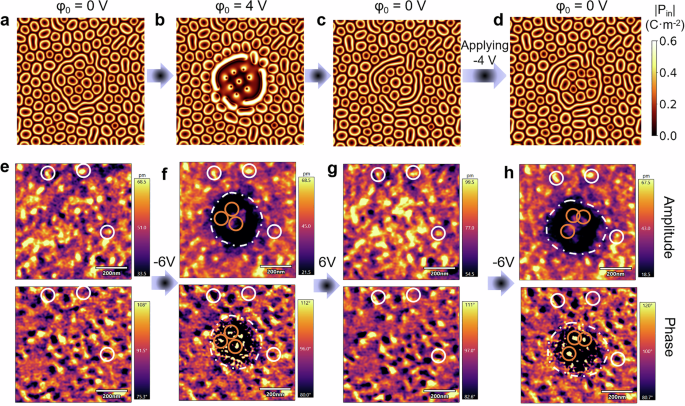
From phase-field simulations: a Planar views of the initial polarization distribution after applying −4 V to pack the skyrmions and form a stable skyrmion bag when the field is removed. b–c Applying +4 V could unpack the skyrmion bag and form skyrmions. d Reversible transition from skyrmions to skyrmion bag with another −4 V pulse. From PFM experiments: e Initial skyrmion structure. f Formation of skyrmion bag after applying −6 V. g Erasing the skyrmion bag after applying 6 V. h Recreation of polar skyrmion bag after applying −6 V again.
To experimentally demonstrate the reversible formation of a skyrmion bag, PFM images were first captured for a pristine region of the [(PTO)10/(STO)2]20 superlattice, which contains skyrmions (some skyrmions are marked by white circles in Fig. 3e). To create a skyrmion bag, a bias voltage of −6 V was applied for ~30 s, resulting in the formation of the skyrmion bag (Fig. 3f). To erase the skyrmion bag, the PFM tip was moved to the central region, and a reversed bias voltage of +6 V was applied for ~30 s. The resultant PFM images show the skyrmion bag boundary disappearing, with the skyrmions reverting to their original state (Fig. 3g). To recreate the skyrmion bag, the PFM tip was again positioned at the central region, and a −6 V bias was applied for ~30 s. The PFM images clearly demonstrate the reformation of the skyrmion bag (Fig. 3h), confirming the reproducibility of its formation and erasure. A similar experiment was conducted on the [(PTO)16/(STO)16]16 superlattice, which also exhibited consistent erasure and recreation of the skyrmion bag (details provided in Fig. S8).
Phase diagram of topological charge of skyrmion bag (Qsk) under different applied voltage
The effect of the magnitude of the applied potential is further investigated through phase-field simulations (Fig. 4). The final states depicted here were obtained after poling for 10,000 timesteps followed by relaxation at zero field for another 10,000 timesteps. When the applied potential is small, e.g., −1 V, the polar skyrmion states can be recovered upon removing the field (Fig. 4a). With a higher magnitude of the applied potential (−2 V), we observe the merging of polar skyrmions to form curved stripes (Fig. 4b). Moreover, further increasing the applied potential can lead to the formation of skyrmion bag (Fig. 4c, d), where the number of enclosed skyrmions increases with the applied potential. This can be understood since smaller skyrmion nuclei can formed under a higher field, breaking the long stripes through the Raleigh-Plateau mechanism, as has been reported previously41. As the applied potential increases to higher than −5 V (Fig. 4e, f), the skyrmions inside the bag start to merge into stripes, resulting in a decreasing of net topological charge. The electric potential phase diagram shows three regions (Fig. 4g): when the applied potential is small, the full skyrmion state can be preserved; under higher electric field, the skyrmions merge to form curved stripes; when the applied potential is >3 V, skyrmion bag state can be stabilized even when the field is removed. Notably, the net topological charge of the skyrmion bag initially increases with the increasing applied potential, reaching a maximum of 13 at −4.5 V, which gradually decreases to 4 at −8 V. The decrease in the net topological charge inside the bag can be attributed to the merging of the newly-formed skyrmions inside the bag.
Fig. 4: Topological state and topological charge vs electric potential phase diagram of skyrmion bag.
From phase-field simulations: a–f Planar views of the polarization distribution after electrical potential with −1 V, −2 V, −3 V, −3.5 V, −5.5 V, and −8 V, respectively. The boundary appears when potential is below −3 V, and inner skyrmions begin to melt into strips when voltage is below −5 V. g Absolute value of topological charge as a function of the absolute value of voltage (electrical potential), demonstrating the variation in topological charge under different voltages. From PFM measurements: h PFM phase images reveal the experimental observation of skyrmion bags containing varying numbers of skyrmions and stripe domains within the bag, depending on the magnitude of the applied bias voltage for same duration of 30 s. i Schematics of the energy landscape for the formation of high-order topologies. j Evolution of the total energy after the application and removal of the external field (−4.5 V) from phase-field simulations, showing that the skyrmion bag and skyrmion have similar total energy, and the external electric field could help overcome the energy barrier between the polar skyrmion and polar skyrmion bag.
The electric potential manipulation of the skyrmion bag state is further studied. Figure 4h presents the experimental observation of skyrmion bags containing varying numbers of skyrmions within the bag, depending on the magnitude of the applied voltage bias. This observation highlights the potential to stabilize different topological charge states, showcasing the feasibility of utilizing skyrmion bags in multistate memory applications. To illustrate the formation mechanism for the high-order topologies, a schematic diagram of the energy landscape is further plotted in Fig. 4i. It can be seen that the system has multiple stable energy wells with similar energy, where the polar skyrmion is the closest to the paraelectric phase, which forms spontaneously upon cooling. Meanwhile, to form skyrmion bags from the stable skyrmion state, one has to overcome the barriers with an externally applied electric field. The evolution of the total energy under an applied tip electric field of −4.5 V is further given in Fig. 4j, demonstrating that the external field provides an energy of ~1.7 MJ/m3 to overcome the barrier between skyrmion and skyrmion bag (details of each energy component is plotted in Fig. S9). After the field is removed, the system relaxes to a skyrmion bag state, which has a similar yet slightly lower energy as compared to the initial skyrmion state (−2.33 MJ/m3 for skyrmion vs. −2.48 MJ/m3 for skyrmion bag). This study demonstrates that the number of skyrmions within a skyrmion bag can be dynamically controlled in real-time by tuning the applied voltage, offering a promising avenue for real-time reconfigurable topological systems.