

Controlling the radiation environment of superconducting qubits
The qubit chip was relocated from the Earth’s surface at Madison, WI to the Northwestern EXperimental Underground Site (NEXUS) at Fermilab in Batavia, IL. Previously, correlated jumps in offset charge, associated with gamma ray and cosmic ray impacts, were observed in this qubit array. Underground, over 99% of cosmic ray muons are shielded by the rock overburden, creating an environment in which the qubit response to gamma radiation can be studied in isolation. The muon flux underground is ~7 cm−2 day−1. A movable lead shield provides 4π coverage to reduce the ambient gamma background by over 99%. We vary the flux of gamma rays incident on the qubit chip using this shield and measure the rate and magnitude of ensuing charge burst events via Ramsey tomography. Other energy-resolving detectors operating simultaneously in NEXUS are used to calibrate the flux and spectrum of ionizing radiation. Additional facility and experimental hardware details are discussed in the Supplementary Information, Section A. This study is in some sense complementary to that of Ref. 11, in which scintillation detectors provide coincidence information between cosmic ray muon events and qubit errors.
For different datasets during this run period, we vary the flux of gammas incident on the qubit chip by opening and closing the lead shield, and we measure the rate of discontinuous changes in offset charge (“charge jumps”), both for individual qubits and for the correlated event rate across pairs of qubits. The work presented here consists of two datasets corresponding to the lead shield being open (ambient gamma flux) and closed (minimal gamma flux). The integrated measurement times in the “Shield Open” (S.O.) and “Shield Closed” (S.C.) configurations are 23.949 and 22.075 h, respectively.
Response of qubit charge environment to ionizing radiation
A Ramsey sequence (X/2 − Idle − X/2) is applied to each qubit, as described in Refs. 9,10. During the idle period tidle of this sequence, the state vector phase ϕ evolves as a function of the dimensionless offset charge ng present on the qubit island,
$$\phi \,({n}_{{{{\rm{g}}}}})=\Delta {f}_{01}{t}_{{{{\rm{idle}}}}}\cos (2\pi {n}_{{{{\rm{g}}}}}),$$
(1)
for charge dispersion Δf01. Here, ng is the sum of the charge applied via the bias lines and the intrinsic offset charge. This pulse sequence maps gate charge (modulo 1e) onto the excited state probability P1 of the qubit. This mapping is designed to be insensitive to the parity of the qubit island, given that the quasiparticle tunneling rate in this device is orders of magnitude faster than the measurement cadence. A discontinuous change in ng, as from an induced electric field following a charge burst event, causes a discontinuity in P1, as shown in Fig. 1. These discontinuities are recorded as charge jumps with a magnitude Δq. Scanning the charge bias on each qubit across a range of voltages allows for a calibration of ng values and an extraction of P1 that is less sensitive to charge noise. See Supplementary Information, Section E for further details.
Fig. 1: Ramsey tomography detects qubit charge jumps.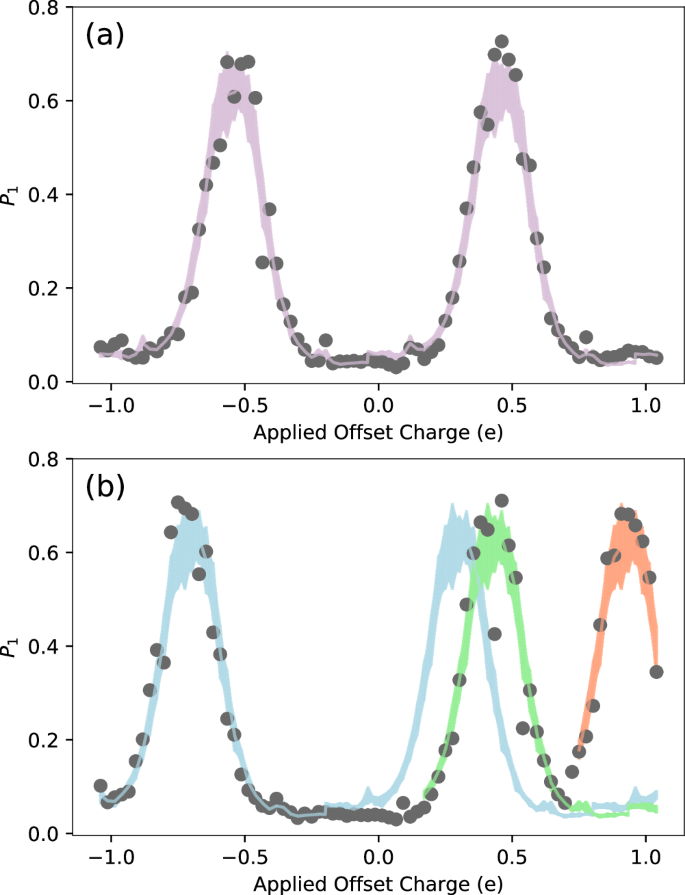
a Example of a single charge tomography scan from one qubit, illustrating the relationship between the qubit’s excited state probability P1 and applied offset charge. Each gray point is the average of 200 measurements. The purple band shows a fit to the template, with the width representing standard error across template samples. b A different tomography scan consisting of two charge jumps, with the shaded lines corresponding to the new best template fit after each jump. The green (orange) shaded template corresponds to a charge jump with Δq = 0.13e (0.50e) ± 0.03e relative to the blue template, where e is the elementary charge.
In principle, ng can be analytically determined from the excited state population P19. However, when multiple burst events occur in the qubit substrate during a single tomographic scan, and/or when other incoherent noise is present in the system, fitting against this functional form is not an efficient method of detecting charge jumps. Instead, we perform a rolling χ2 minimization to fit each tomographic scan against a template averaged from ~20 jump-free scans, with the “phase” of P1 floating on ng ∈ ( −0.5e, +0.5e). Examples of a jumpless scan and a scan with two detected jumps are shown in Fig. 1.
To quantify the efficiency of this method, the equivalent of 400 h of Ramsey tomography scans were simulated for each qubit, and convolved with a Gaussian noise spectrum according to the measured noise in each qubit. Charge jumps are simulated by injecting P1 discontinuities into this dataset at varying intervals and with varying sizes. In all four qubits, this method finds an efficiency of >70% for identifying jumps of magnitude 0.1e≤∣Δq∣≤0.5e, with larger values of ∣Δq∣ aliased down to the measurement interval. The raw extracted rates for each dataset are then divided by this efficiency to obtain the efficiency-corrected rates, which represent the rates of charge jumps in the qubits, agnostic to our analysis methodology. Charge burst rates are extracted for single qubits and for all qubit pairs. The resulting efficiency-corrected rates above a charge jump threshold of ∣Δq∣≥0.1e for each qubit are displayed in Table 1. The corresponding time-correlated rates across qubit pairs are displayed in Table 2 and the relative jump sizes ∣Δq∣ of these pairs are shown in Fig. 2. A pair of charge jumps is considered time-correlated if they occur within 44 s of each other, as limited by our data-acquisition methodology. See Supplementary Information, Section E for details.
Table 1 Charge jump rates in individual qubitsTable 2 Correlated charge jump rates in qubit pairsFig. 2: Correlated charge jump magnitudes between qubit pairs depend on distance and shielding.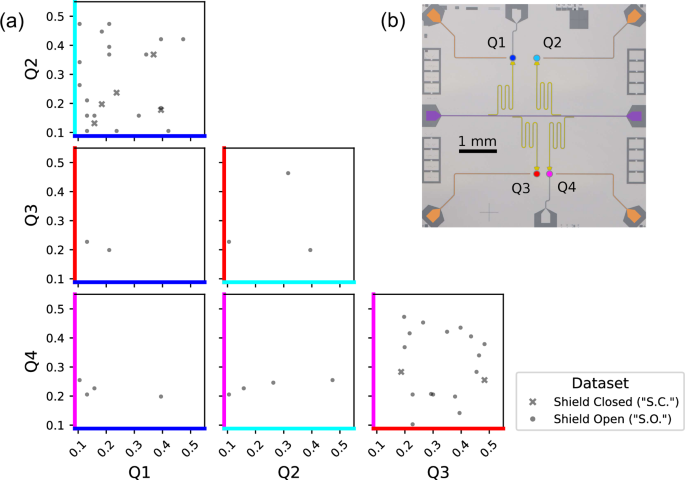
a Jump magnitudes 0.1e≤∣Δq∣≤0.5e, in units of electric charge e, for all qubit pairs. S.C. data is shown as x’s and S.O. data is shown as dots. The raw data retains sign information, but only magnitude ∣Δq∣ is presented here for visual clarity. Non-correlated events are omitted, also for visual clarity. b Micrograph of the qubit chip, annotated with false colors to match the plot axes.
We compare the rate of qubit charge jumps against the flux of gamma rays present during the collection of S.O. and S.C. datasets. These fluxes were measured by a Li2MoO4 (LMO) crystal instrumented with a Transition Edge Sensor as a thermistor19 and located 18.7 cm from the qubit chip in the DR (see Supplementary Information, Sections A and F). We thus perform a direct measurement of the ratio between S.C. and S.O. gamma fluxes. Based on LMO measurements, we determine that the gamma flux in the S.O. case should be a factor of 20 ± 1 larger than in the S.C. case, for gamma energies above 150 keV.
Relating gamma flux to charge burst rates
Averaged over all four qubits, the charge jump rates that we measure for the S.O. and S.C. data are 0.51 and 0.19 mHz, respectively, as shown in Table 1. Therefore, closing the shield reduces the rate of qubit charge bursts by only a factor of 2.7. This rate is over seven times less than expected based on the factor of 20 reduction in gamma flux measured in the LMO detector. A possible explanation for this discrepancy is that in our lowest-background S.C. configuration, we are sensitive to an excess source of charge bursts that is not dominated by the external gamma flux. Potential sources of radiation inside the fridge that might significantly impact the qubit package but not the LMO detector warrant follow up study and assay20,21. The expected muon flux through the qubit (for both configurations) is ~0.08 mHz cm−2 – too low to explain the observed rates. The NuMI muon neutrino beam22 was not active during data collection for this work. Neutrino interactions in matter23, therefore, contributed no additional muon flux during this study.
We infer that the ambient gamma flux does not dominantly contribute to our S.C. dataset, as the measured rate far exceeds the expected rate given the scaling of LMO data. We therefore subtract the S.C. rates from the S.O. data to obtain a reduced burst rate in the S.O. data, induced by ambient gammas, of \(0.3{4}_{-0.06}^{+0.07}\) mHz. In subtracting these data to determine the gamma-induced component, we account for an unknown population of bursts by assuming a constant excess rate of jumps present in both the S.O. and S.C. data. We estimate our ambient gamma flux in the S.O. configuration to be approximately five times lower than that measured using a NaI detector in Ref. 10. If we assume, as Ref. 10 does, that the surface burst rate of 1.35 mHz was gamma-dominated, our ambient rate estimate of 0.34 mHz is proportional with that expected reduction in flux.
The distances between each qubit pair are different, per Table 2 and Fig. 2. The smallest separation between qubit pairs (qubits 3 and 4) is 340 μm and the largest separation between pairs (qubits 1 and 4) is 3330 μm. This variable separation between qubit pairs enables some inferences about correlated noise rates. First, it is technically possible that separate burst events could create conditions that mimic correlated charge jumps arising from a single charge burst. In the S.O. data, we measure a correlated charge jump rate in nearby qubit pairs of 0.27 mHz for qubits 1 and 2, and 0.29 mHz for qubits 3 and 4. Given the low single-qubit jump rates in Table 1, the rate at which this stochastic coincidence could occur is orders of magnitude lower than the measured correlated jump rate. Next, this correlated rate is approximately half of the single-qubit rate (to within statistical uncertainty), which is consistent with that observed in Ref. 10 in which the rate is dominated by gamma flux. In the S.O. data, the correlated jump rate across distant qubit pairs is too low to make any statements on burst origin with any statistical significance. The same statistical limitation is true for nearby qubit pairs in the S.C. data. Finally, we are able to eliminate correlated charge noise in charge-sensitive qubits separated by over 3 mm, on timescales nearing one day.