
Artificial light pollution is accelerating across the globe1,2 and has widespread consequences for people3,4 and the planet5,6,7. Shifts in the luminance and spectral composition of the nocturnal environment modify the physiology, behaviour and ecological interactions of organisms7,8,9,10,11, which together play a fundamental role in ecosystem metabolism12,13. Ecosystem metabolism, comprising gross primary production (GPP) and ecosystem respiration (Re), directs the magnitude and direction of carbon–climate feedbacks via net ecosystem exchange (NEE)14. Around one quarter of global terrestrial ecosystems are exposed to artificial light at night (ALAN)15, but the effects on ecosystem metabolism are currently unknown.
Changing daily and seasonal cycles of light and dark10 could decouple the timing of biological processes across trophic networks16. Trophic groups are also exposed to ALAN at different intensities and have varying sensitivities to luminance and spectral composition17. Plant responses to photoperiod are influenced even at low ALAN intensities18,19, and longer-term exposure influences seasonal phenology, growth form, resource allocation and, thus, potentially carbon fixation20. High ALAN intensity exposure in urban areas disrupts the behavioural patterns of nocturnally migrating birds21 and plant diversity22 and restructures soil microbial communities, reducing the functional genes involved in nutrient regulation and plant health23. Together, the observed effects of ALAN across levels of biological organization and diverse taxa suggest a potential cascading impact on ecosystem structure and function. Previous studies of ALAN effects, however, have focused on local or experimental manipulations, leaving uncertainty about whether ALAN effects persist at the ecosystem level and longer timescales.
GPP and Re are fundamentally constrained by shortwave (solar) radiation (SW) and temperature (T), respectively24,25,26. That is, SW determines the direction and duration of energy flow between the atmosphere and ecosystems, and T determines the rate of reactions12. Although ALAN is not expected to influence SW or T directly, artificial light could disrupt the processing of energy according to these fundamental constraints via acclimation, compensation and adaptation strategies27,28. A better understanding of the magnitude and direction of ALAN effects on ecosystem metabolism could help constrain carbon–climate processes in Earth system models (ESMs)29. Specifically, largely uncertain ESM processes and their response to climatic factors could be compounded by the chronic effects of pervasive anthropogenic stressors, such as ALAN.
Global efforts to measure carbon exchange across diverse ecosystems30 combined with satellite observations of ALAN distribution and intensity across the land surface2,31 enable the exploration of artificial light’s influence on terrestrial ecosystem metabolism. Here, we leverage the harmonized nighttime light dataset of Li et al.32 and eddy covariance observations from FLUXNET201530 to investigate the instantaneous and aggregated influence of ALAN on ecosystem-scale NEE, GPP and Re fluxes. Although both datasets have global coverage, the location of eddy covariance flux towers are biased towards dark sky regions (Extended Data Fig. 1). Following definitions by Li et al.32 and others33, we use three digital number (DN, higher values represent greater luminance of light at night; Methods) groups representative of low (DN <10), medium (DN ≥ 10 < 30) and high (≥30, representative of urban boundaries) ALAN intensity to identify regions with FLUXNET2015 sites across a range of ALAN intensities. North America and Europe were the only regions, globally, with more than one high ALAN intensity FLUXNET2015 site (Methods; Fig. 1a,d). Within both North America and Europe, sites were selected on the basis of latitudinal ranges at which medium or high ALAN intensity sites were present (Fig. 1b,e) to minimize climatic factors in higher or lower latitude sites being ascribed to low ALAN intensities. In total, 86 FLUXNET2015 sites were selected, 34 sites in North America (4, 5 and 25 sites at high, medium and low ALAN intensities, respectively) and 52 sites in Europe (13, 17 and 22 sites at high, medium and low ALAN intensities, respectively) (Methods; Fig. 1 and Supplementary Table 1). Despite regional imbalances in FLUXNET2015 site distribution across ALAN intensity levels, the dataset captures a diverse range of ALAN intensities across temperate regions experiencing similar seasonal fluctuations in T and SW.
Fig. 1: Distribution of flux tower sites across artificial light intensity in North America and Europe.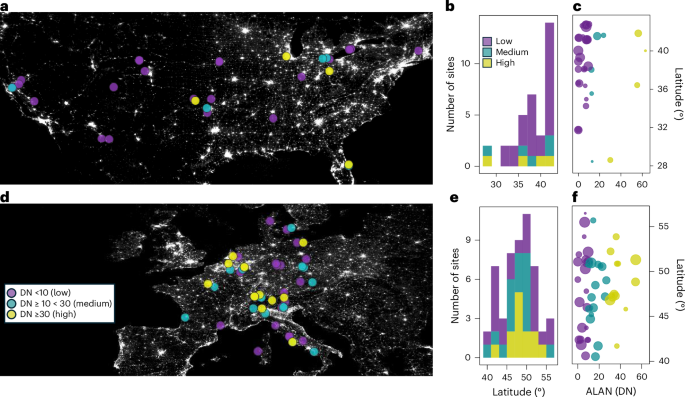
a,d, The location of 86 eddy covariance flux tower sites from FLUXNET2015 (symbols, colours indicate ALAN intensity according to DN (higher values represent greater luminance of light at night) (as in d) displayed over a harmonized global nighttime light map for 2012 (for visualization only) in North America (n = 34) (a) and Europe (n = 52) (d). b,e, The latitudinal distribution of sites with different ALAN intensities for North America (b) and for Europe (e), in 2° N intervals. c,f, The ALAN intensities of selected FLUXNET2015 sites, averaged across site years (the number of years with observational data per site), for North America (c) and Europe (f) according to DN with symbol size indicating number of site years (range: 1–20 years per site between 1992 and 2014, total site years in c is 211 and in f is 412). Basemaps in a and d were generated with QGIS using the harmonized global nighttime light dataset32 under a Creative Commons license CC BY 4.0.
To detect the potential influence of ALAN on ecosystem metabolism, we investigate half-hourly and mean daily ecosystem carbon fluxes (Fc; Fc: NEE, GPP and Re) measurements against their fundamental constraints, T and SW, according to the modified Arrhenius equation of Weyhenmeyer12:
$${F}_{{\rm{c}}}={T}^{4}\sigma {{\rm{e}}}^{\frac{-\mathrm{SW}}{\sigma {T}^{4}}}{k}_{{F}_{{\rm{c}}}}-b,$$
(1)
where Fc is ecosystem C flux (NEE, GPP, Re) (in µmol CO2 m−2 s−1), T is temperature in Kelvin, σ is the Stefan–Boltzmann constant (in J m−2 s−1 K−4) (5.67 × 10⁻⁸), SW is incoming SW (in J m−2 s−1,) kFc is the slope of the linear relationship and b is the intercept. The function establishes a biophysically grounded baseline for different Fc by capturing their shared fundamental constraints (T and SW). The use of the modified Arrhenius function in this study primarily serves as a comparative baseline rather than a mechanistic model, enabling deviations attributable to chronic ALAN effects to be identified relative to fundamental energetic constraints.
The null models for NEE, GPP and Re were linear mixed effect models (LMMs) or generalized additive mixed models (GAMMs) fitted to equation (1) (Methods) with FLUXNET2015 site and latitude as random effects and fundamental constraint (\({T}^{4}\sigma \,{{\rm{e}}}^{\frac{-\mathrm{SW}}{\sigma {T}^{4}}}\), J m−2 s−1) as a fixed effect (Fig. 2). The null models were tested against models with additional explanatory variables, including continent, climate, International Geosphere–Biosphere Programme land use classifications, growing season (GS), night duration (ND, hours), vapour pressure deficit (VPD, hectopascals), precipitation (P, millimetres), ALAN intensity (DN), distance to nearest urban polygon (DtNUP, kilometres) and proportion of urban land cover in 3- and 10-km buffers around each site (pULC_3km, pULC_10km). The LMM selection criteria for explanatory variables followed a trade-off between explanatory power and parsimony, with the condition that additional degrees of freedom (df) were accompanied by lower Akaike information criteria (AIC) and higher marginal R2 (R2m) goodness-of-fit measures (ΔAICdf <−5 and ΔR2mdf >0.01 compared with the null model (Methods; Fig. 2a,c,e). All Fc LMMs selected GS; GPP and Re LMMs selected ND; the GPP LMM selected DtNUP; and the Re LMM selected VPD and ALAN (Supplementary Tables 2 and 3).
Fig. 2: Ecosystem carbon flux dependence on modified Arrhenius constraints and the effect of ALAN.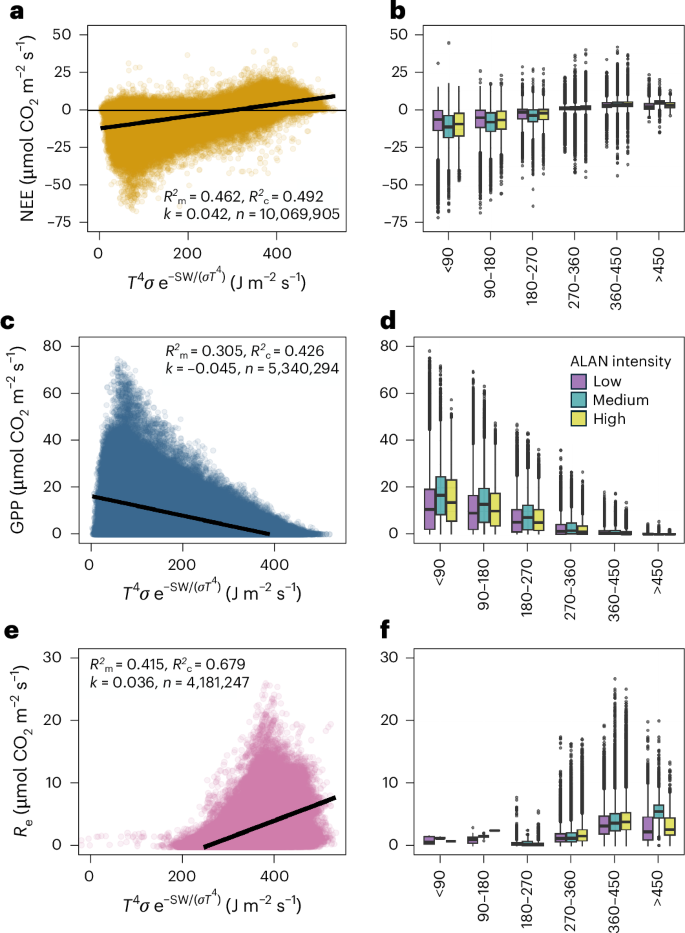
a,c,e, The symbols are half-hourly FLUXNET2015 measurements for NEE (gold symbols) (a), daytime GPP (blue symbols) (c) and nighttime Re (magenta symbols) (e) for 86 sites across North America and Europe. The linear regression lines in a, c and e indicate fixed-effect relationships of fundamental constraints on ecosystem carbon fluxes according to the modified Arrhenius function (null models as in equation (1)). b,d,f, The box plots display the distribution of measured fluxes across bins of the modified Arrhenius function (axes labels and units in b, d and f are the same as in a, c and e, respectively) grouped by ALAN intensity to illustrate variation in carbon fluxes relative to energetic constraints as a function of ALAN. The boxes represent interquartile ranges (IQR), the horizontal lines denote medians, the whiskers extend to 1.5 × IQR and the points indicate outliers.
Backward selection and variance-weighting were applied to GAMMs fitted to half-hourly NEE, GPP and Re observations (Methods; Supplementary Table 4) with the explanatory variable identified in the LMMs. In the final GAMMs, all Fc retained a significant interaction between ALAN and ND (Fig. 3 and Supplementary Table 5). Notably, the NEE GAMM did not retain GS as a significant predictor, suggesting that the seasonality in instantaneous NEE responses was captured by GPP and Re, which both retained GS effects (Supplementary Table 5). During GAMM selection, VPD (selected in the Re LMM) exhibited consistently high concurvity (>0.8) with other smooth terms, including models in which ALAN was removed, indicating substantial collinearity with the modified Arrhenius function. DtNUP, selected in the GPP LMM, contributed no additional explanatory power in all GAMMs.
Fig. 3: Nonlinear influence of ALAN and ND on ecosystem metabolism.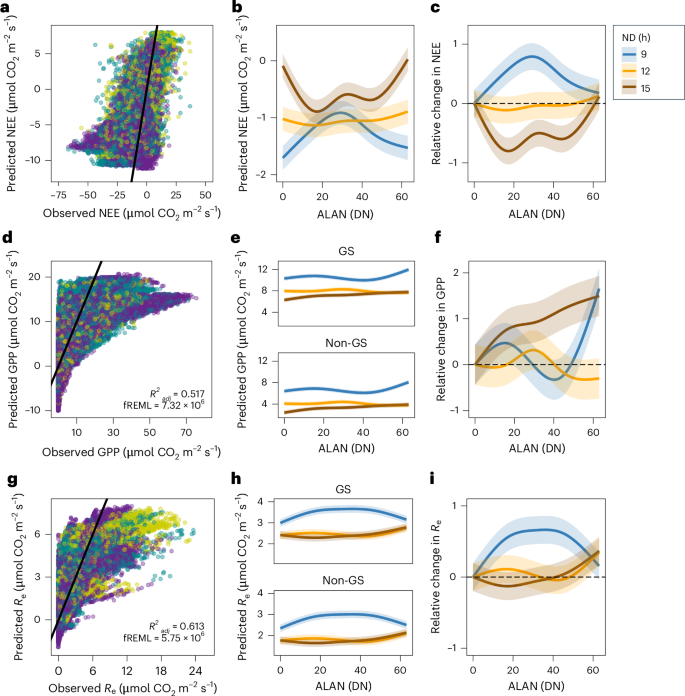
a–i, GAMMs fitted to half-hourly carbon flux measurements consistently selected smooth tensor product interactions between ALAN and ND for NEE (a–c), GPP (d–f) and Re (g–i). a (R2adj = 0.430; fREML = 1.35 × 10⁷), d and g show observed versus predicted fluxes for the final variance-weighted GAMMs (Supplementary Table 5), which account for heteroscedasticity across the range of observed fluxes (Supplementary Table 4 and Extended Data Fig. 2). b, e and h illustrate smooth estimates of the tensor product interaction across the gradient of ALAN intensity and ND (coloured lines, with shaded ribbons representing mean predictions ± 95% confidence intervals). For GPP, e, and Re, h, predictions are shown separately for the GS and non-GS, whereas for NEE, b, the GS was not selected as a significant predictor. c, f and i depict GAMM-derived estimates of the relative change in each flux across gradients of ALAN intensity and ND, expressed relative to ALAN = 0, with shaded areas denoting 95% confidence intervals around the mean.
The variance weighting substantially reduced residual heteroscedasticity across all Fc, with the scale estimate reduced by ~95% and adjusted R² (R2adj) reduced by 0.06–0.11 in weighted compared with unweighted final GAMMs, indicating improved model stability through decreased overfitting to high-variance observations (Supplementary Table 4 and Extended Data Fig. 2). Figure 3, right panels, shows weighted GAMM estimates of relative changes in each Fc across gradients of ALAN intensity and ND. Partial effect surfaces illustrating nonlinear ALAN × ND interactions at half-hourly timescales are presented in Extended Data Fig. 3, along with residual diagnostics indicating no substantial autocorrelation after model fitting.
LMMs and GAMMs fitted to mean daily NEE, GPP and Re yielded more consistent trends compared with models fitted to half-hourly observations. All daily LMMs and GAMMs identified GS and ND as significant predictors, with the GPP LMM selecting DtNUP and the Re LMM selecting ALAN as explanatory variables (Supplementary Tables 6 and 7). All of the daily GAMMs selected the smooth tensor product between ALAN and ND (Supplementary Tables 8 and 9). Compared with the half-hourly models, the daily GAMMs exhibited smoother and more monotonic relationships between ALAN and Fc, reflecting the reduction in diel and short-term variability through temporal aggregation (Extended Data Fig. 4). Temporal aggregation led to clearer trends in predicted relative changes in Fc across gradients of ALAN intensity (Fig. 4), in contrast to more variable patterns in the half-hourly GAMM predictions (Fig. 3c,f,i). Notably, whereas ALAN consistently increased Re in half-hourly GAMMs and particularly during short nights (Fig. 3h,i), the daily GAMMs showed a contrasting pattern, with Re increasing most with ALAN intensity during longer nights (Fig. 4c,f). This divergence demonstrates how the aggregation of diel variability can modify the apparent direction and magnitude of ALAN effects on Fc. The partial effect surfaces from daily models showed more regular gradients and reduced nonlinear complexity, whereas residual autocorrelation was minimal, supporting the suitability of daily models for capturing net ALAN effects on ecosystem metabolism (Extended Data Fig. 5).
Fig. 4: Nonlinear response of mean daily ecosystem carbon fluxes to ALAN and ND.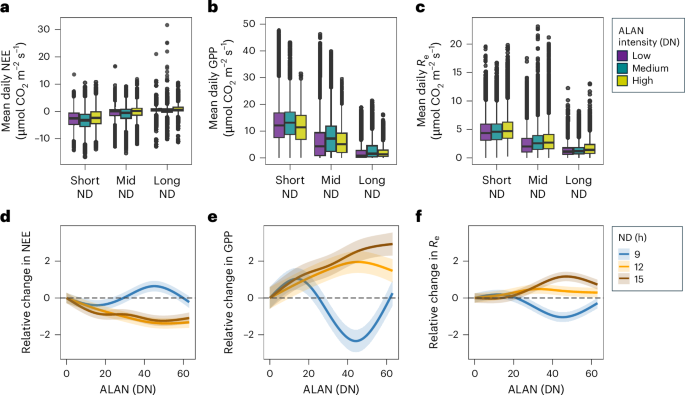
a–c, The box plots display the distribution of measured mean daily NEE (a), GPP (b) and Re (c) across ND groups (short ND: <9.5, mid ND: ≥9.5 < 13.9, long ND: ≥13.9 h, defined by 25% and 75% quartiles) coloured by ALAN intensity (n = 197,247). The boxes represent the interquartile ranges (IQR), the horizontal lines denote medians, the whiskers extend to 1.5× the IQR and the points indicate outliers. d–f, The variance-weighted GAMM predictions (Supplementary Table 9) for relative changes in daily mean NEE (d), GPP (e) and Re (f), expressed relative to ALAN = 0 for ND groups as in Fig. 3, with shaded ribbons representing mean predictions ± 95% confidence intervals.
The role of ALAN along with longer-term drivers of ecosystem metabolism was evaluated by constructing a piecewise structural equation model (SEM) integrating multiple exogenous predictors and hypothesized mediation pathways. The final SEM incorporated GS length, ALAN intensity and climatic variables including SW, VPD and T, along with the urban metric DtNUP (Fig. 5a). The modified Arrhenius function was not selected, reflecting how annual temporal aggregation reduces positive and negative deviations in fundamental constraints compared with short-term flux variability. The aggregated measures of ND were also not selected, with phenological drivers such as GS length more important at annual timescales (Supplementary Table 10). The mediation analysis, using nonparametric bootstrap resampling to quantify both direct and indirect effects of GS length and indirect effects of ALAN on NEE, supports the inference that the influence of ALAN on ecosystem metabolism is primarily mediated through increased Re (Fig. 5b). The influence of GS length on NEE was significantly mediated through increased GPP (Fig. 5b). The leave-one-out sensitivity analysis of the SEM indicated that no alternative model performed better than the full model (Supplementary Table 11). Notably, the exclusion of ALAN, DtNUP, VPD or GS length led to significant declines in model performance, reflecting the importance of these predictors in explaining the interannual variation in ecosystem metabolism (Fig. 5c).
Fig. 5: Final SEM structure for annual NEE, GPP and Re fluxes.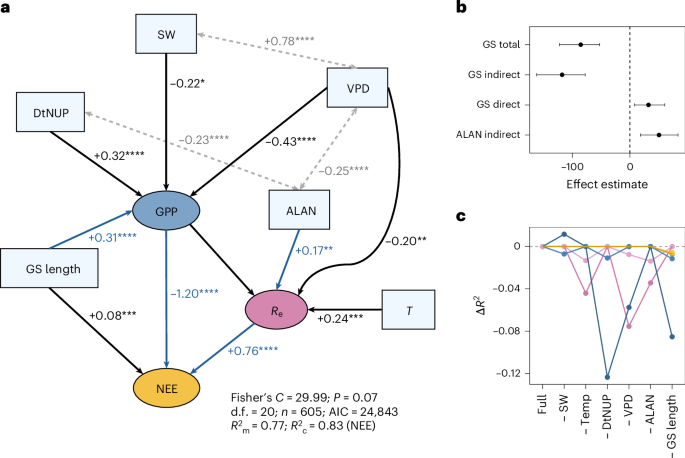
a, The hypothesized pathways linking explanatory variables to ecosystem carbon fluxes show the standardized path coefficients of the final SEM with significance levels (****P < 0.0001, ***P < 0.001, **P < 0.01, *P < 0.05, exact P values in Supplementary Table 10). The tests are two-sided, with no adjustments for multiple comparisons. The arrow thickness indicates the magnitude of standardized effect sizes, the black arrows and text indicate direct pathways, the double-headed grey arrows and text indicate the residual correlations and the blue arrows and text indicate the mediation pathways supported by the bootstrap analysis. The SEM was fitted to complete cases for all variables (605 site years, 84 sites). b, The bootstrap-derived estimates shown are means and 95% percentiles from 1,000 replicates for the direct and indirect effects of GS length and ALAN on NEE. c, The outputs from a leave-one-out analysis show the change in marginal (lighter-coloured symbols and lines) and conditional (darker-coloured symbols and lines) R² (ΔR²) for NEE (gold), GPP (blue) and Re (magenta) relative to the full model after systematically removing each exogenous predictor (Supplementary Table 11).
To ensure our data analysis was robust to site bias across ALAN intensities (17, 22 and 47 sites at high, medium and low ALAN intensities, respectively, and 34 sites in North America and 52 sites in Europe), we repeated all GAMM and SEM analyses using a balanced dataset with an equal representation of low, medium and high ALAN intensity sites per continent (Extended Data Figs. 6–9). The models fitted to the balanced dataset showed consistently significant nonlinear interactions between ALAN and ND across temporal scales (Extended Data Fig. 6), and the annual SEM retained the core structure of ALAN indirectly influencing NEE through increased Re (Extended Data Fig. 9). Whereas several weaker interactions (for example Re ~ T and NEE ~ GS length) were no longer significant owing to reduced sample size, the SEM retained dominant pathways, and the overall explanatory power was comparable (R2m = 0.64, R2c = 0.70 for NEE). Notably, the standardized coefficients strengthened between ALAN ~ Re and Re ~ NEE when the SEM was fitted to the balanced dataset. Our observed ALAN effects on ecosystem metabolism are therefore robust to spatial imbalances in ALAN intensity across FLUXNET2015 site distribution.
Our study provides cross-continental evidence of ALAN’s influence on ecosystem metabolism across timescales. We demonstrate that ALAN consistently modifies the relationship between Fc and their fundamental energetic constraints (Figs. 2–4). The Re response to fundamental constraints was particularly sensitive to ALAN intensity at short (half-hourly and daily) timescales (Fig. 2 and Supplementary Tables 2 and 6). Alongside Re, GPP and NEE exhibited significant nonlinear interactions between ND and ALAN intensity, revealing the importance of ALAN magnitude and timing in modulating ecosystem metabolism across scales (Figs. 3 and 4). At annual timescales, the influence of ALAN on NEE was primarily mediated through increased Re rather than the direct suppression of GPP (Fig. 5). Taken together, our findings demonstrate the role of ALAN as a pervasive stressor capable of disrupting carbon balance across spatial and temporal scales.
The nonlinear influence of ALAN on ecosystem metabolism was strongly modulated by diel cycles and seasonality, demonstrating the importance of phenological dynamics34 and biogeochemical feedbacks in shaping long-term carbon balance35. The temporal aggregation led to notable shifts in the strength and direction of ALAN effects on Re, whereas GPP and NEE displayed more consistent nonlinear responses to ND across timescales (Figs. 3 and 4). At the half-hourly resolution, short nights showed the strongest ALAN-induced increases in Re (Fig. 3h,i), reflecting immediate physiological and microbial responses such as prolonged stomatal opening36, sustained leaf dark respiration37 and elevated microbial decomposition under disrupted circadian regulation38. By contrast, daily mean nighttime Re estimates indicated larger ALAN-related increases during longer nights (Fig. 4f), demonstrating how aggregation dampens short-term variability while revealing broader shifts in Re across longer nights. GPP exhibited consistent positive or nonlinear ALAN effects across timescales (Figs. 3 and 4), probably driven by nocturnal illumination extending photosynthetic activity at medium ALAN intensities39,40. Temporal scale and ND thus collectively shape ALAN’s ecological impact, whereas diel averaging can obscure short-lived physiological responses while reflecting cumulative nighttime effects.
Re exhibited greater sensitivity to ALAN than GPP across timescales (Figs. 2 and 3 and Supplementary Tables 2–11), and the SEM confirmed that ALAN primarily influences NEE indirectly via increased Re at annual timescales (Fig. 5). The destabilizing effect of ALAN on production-respiration coupling will arise from shifts in multiple autotrophic and heterotrophic processes controlling carbon allocation and use efficiency17,38. The greater Re sensitivity may reflect a higher capacity of autotrophs to acclimate to ALAN through conservative growth strategies such as increased shoot-to-root ratios20,41. In ecosystems dominated by C3 plants, for instance, prolonged ALAN exposure can disrupt circadian regulation and prolong stomatal opening, reducing carbon uptake efficiency, increasing mortality and senescence, and leading to reduced GPP over time42,43. Such trophic mismatches and shifts in carbon allocation are likely to accumulate across levels of biological organization, space and time44,45, leading to progressive declines in NEE in illuminated ecosystems.
The ecological impacts of ALAN have primarily been examined at local scales6,17, but landscape-scale factors will confound or amplify these localized effects2. Urban proximity influenced GPP in our analysis, whereas ALAN directly influenced Re (Fig. 5), suggesting distinct pathways through which nighttime lighting and urban characteristics modify ecosystem metabolism. Balancing sites across low, medium and high ALAN intensities further indicates potentially stronger mediating effects of ALAN on NEE via Re (Extended Data Fig. 9). Despite the pervasive nature of light pollution, ALAN remains overlooked in ESM carbon–climate projections that otherwise account for climate and land use changes. Current observational data, however, do not enable the disentangling of the contribution of ALAN relative to sunlight in shaping Fc, and future targeted experimental studies will be needed to resolve these relationships.
Global eddy covariance networks such as FLUXNET are vital for monitoring ecosystem metabolism across diverse climates and land use types, but they are typically biased towards temperate regions, seminatural landscapes and dark skies (Extended Data Fig. 1). Urban flux towers are particularly scarce, and although networks such as Urban PLUMBER have been established, they do not measure Fc (ref. 46). Similarly, available nighttime light satellite products used here (Visible Infrared Imaging Radiometer Suite (VIIRS) and Defence Meteorological Satellite Programme (DMSP)) are coarse in spatial resolution, are insensitive to blue light emitted by white light-emitting diode (LED) lighting47 and cannot fully capture local heterogeneity in ALAN exposure at flux tower sites.
Enhanced satellite sensors with improved spectral and spatial resolution would advance ALAN monitoring2, but ground-based measurements are also needed to capture how cloud cover exacerbates or reduces skyglow (brightening of the night sky) in high or low ALAN intensity areas, respectively48. The coordinated expansion of eddy covariance flux tower networks along with complementary measurements, such as chamber-based respiration estimates and isotopic tracers, will be critical to disentangle the mechanisms by which ALAN alters ecosystem metabolism. Expanding ecosystem-level Fc measurements into urbanized, tropical, arid and high-latitude regions is vital to evaluate the global relevance of ALAN impacts on carbon cycling. While monitoring is essential, mitigation is also readily achievable.
Artificial light is ubiquitous and often beneficial, but the negative ecological effects of light pollution can be reduced while balancing societal benefits. Retrofitting LED lighting can reduce light pollution5, but it often results in over-illumination due to their higher efficiency49. Given that lighting accounts for 20% of global electricity consumption and 6% of CO2 emissions50 and can exacerbate degraded air quality51,52, mitigation interventions such as directional, dimmable and adaptive lighting designs2 offer wider cobenefits. Unlike climate and land use change, the effects of light pollution could be mitigated overnight53. Our study demonstrates the pervasive influence of light pollution on ecosystem metabolism across scales and highlights the urgent need to integrate ALAN into global change research, assessments of carbon–climate feedbacks and mitigation strategies. Developing a higher resolution understanding of species, community and ecosystem sensitivity to ALAN will be central to designing interventions that both safeguard biodiversity and preserve the land carbon sink.