
The device configuration used for the main experiment is sketched in Fig. 1a. The interdigital transducers (IDT) are deposited over a 128° Y-cut LiNbO3 substrate, designed to resonate at 1.3 GHz for the Rayleigh mode. The characterization of the IDT can be found in the Supplementary Information S1. A collection of strips with widths ranging from 500 nm to 1.6 µm, each incorporating an elliptical nucleation pad, are situated 3 mm away from the IDTs, as shown in Fig. 1a. The large distance between the IDT and the magnetic devices was required to avoid possible arcs on the sample from the imaging extraction voltage of the XMCD-PEEM set-up. The structure of the magnetic strip is Cr(1 nm)/FeCo(2 nm)/FeCoB(3 nm)/Py(1 nm)/Pt(1 nm), where FeCo stands for Fe65Co35, FeCoB for (Fe65Co35)95B5 and Py for Permalloy Ni80Fe20. The FeCo layer is magnetostrictive, and it was the material that, via resistive measurements, gave us the first evidence of the mechanism reported in this work. FeCoB is also magnetostrictive and helps reduce the coercivity as shown in the hysteresis loops in Supplementary Information S2. Finally, the thin Py layer on top reduces the coercivity even more and decreases the probability of DW pinning in the strips.
Fig. 1: Experiment description.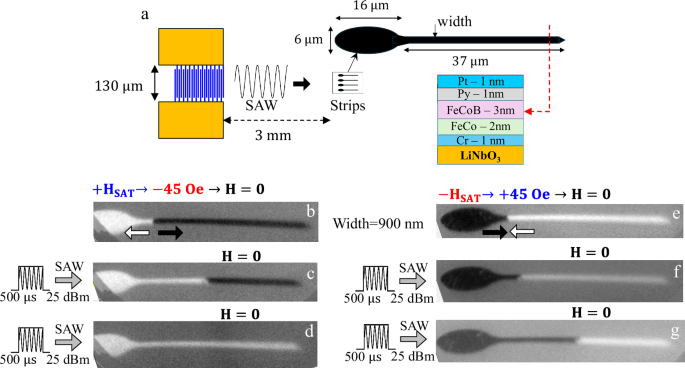
a Schematic representation of the sample. An IDT, deposited over LiNbO3, is placed 3 mm away from a set of ferromagnetic strips of different widths. The strips have an elliptical nucleation pad with the dimensions shown in the figure. The length of the strip is always 37 μm. In this figure, all the strips are 900 nm wide. b XMCD-PEEM image taken at zero external magnetic field, after the field sequence shown on top of the figure. The arrows indicate the direction of the magnetization. c XMCD-PEEM image taken after a 500 µs 25 dBm SAW pulse, always at zero external magnetic field d XMCD-PEEM image taken after a second 500 µs 25 dBm SAW pulse, also at zero external magnetic field. e–g Same sequence as (b–d) but with a Head-to-Head DW instead.
Figure 1 shows sequences of XMCD-PEEM images acquired on 900 nm-wide strips, measured at the Fe L3 edge (see “Methods” for details). The procedure to nucleate and inject a DW in the strip is written on top of the first sequence of images. First, the strip is saturated in plane with a maximum field of 200 Oe. Then, an opposite field of 45 Oe is applied, reversing the magnetization in the nucleation pad. Finally, the field is ramped to zero and stays at zero while the experiment is performed by applying SAW pulses. In Fig. 1b, starting from saturation to the right, once the field sequence is completed and the field is brought to zero, the XMCD-PEEM image reveals a single Tail-to-Tail DW close to the injection pad. Then, a 500 µs 25 dBm SAW pulse is delivered, still at zero external magnetic field. The image taken after the pulse (Fig. 1c) shows a clear displacement of the DW in the same direction as the SAW propagation, from left to right. A second SAW pulse completes the reversal (Fig. 1d), implying that the DW was displaced again in the same direction as the SAW propagation at zero field. The situation is very similar when a Head-to-Head DW was injected, as shown in the sequence Fig. 1e–g. Although in Fig. 1 the Head-to-Head DW seems less mobile than the Tail-to-Tail, in all the sequences measured, we could not find any conclusive difference in the response of the two types of DW to the acoustic wave. In the Supplementary Information, we provide additional experimental evidence of the particularities of the SAW-driven DW displacement at zero external magnetic field. Figure S4 shows examples of the movement of the two DW types under the sole action of the SAW. Figure S5 demonstrates that the DW moves in successive steps following four identical consecutive SAW pulses. Figure S6 shows that the DW displacement increases with SAW pulses of greater width, although some stochasticity is observed in the pinning and motion of the DW. Figure S7 reveals that DW displacement also increases with the amplitude of the SAW pulses, with no displacement observed below 25 dBm. Figure S8 provides evidence that the DW can be displaced solely by the SAW when the acoustic wave propagates from the tip of the strip toward the nucleation pad. Remarkably, the SAW alone can reverse the magnetization of the strip, even in the elliptical pad, which is significantly wider than the strip. Finally, in Fig. S9, we show images demonstrating that the SAW can move the DWs in the direction of the wave propagation (left to right), even against the opposing pressure of a small applied magnetic field.
In all the extensive evidence obtained by XMCD-PEEM microscopy, the movement of the DW was always observed to be in the direction of the SAW propagation (left to right). To rule out any major role played by the heat carried by the SAW, we used a thermography camera to measure the temperature in the sample. The details can be found in Supplementary Information S4. At 28 dBm of continuous SAW, the thermal increase in the devices (3 mm away from the IDT) is less than 10 °C in steady state. The temperature in the IDT is larger, but it does not reach 20 °C at the maximum power used in this experiment. This small temperature increase agrees with previous estimations by other authors21,22 and, although it may be relevant for materials with perpendicular magnetic anisotropy21, it is small for materials like the ones used in this work, where the DWs do not move by thermal activation. Note also that the experiments shown in this work use a pulsed SAW, so the temperature increase in the sample is most likely smaller than 10 °C. Finally, we ought to mention that the temperature gradient along the entire length of the ferromagnetic strip is smaller than 0.04 °C/µm. This small thermal gradient would unlikely play any role in the DW movement, which would be towards the hot end, i.e., against the direction of the wave propagation and the DW motion observed.
Figure 2 shows the influence of the strip width on the zero-field DW motion driven by the SAW. The sequence of XMCD-PEEM images in Fig. 2a–c, taken for four different strip widths and using a short 2 μs SAW pulse, shows that strips 1.2 and 1 μm wide allow a larger displacement of the DW than wider or narrower strips. Figure 2d summarizes the DW velocity in the same four strips as a function of the SAW power for a SAW pulse 2 μs long. The velocity is measured by dividing the DW displacement by the 2 μs of the SAW pulse. The minimum pulse width we could apply during the Synchrotron experiment was 2 μs. Moreover, given the length of the strips (which had to allow the entire strip to be visible within the 50 μm field of view of the XMCD-PEEM microscope), it was not possible to perform a detailed study of the DW velocity for longer pulse widths.
Fig. 2: Magnetic domain wall movement under the action of a SAW in strips of different widths.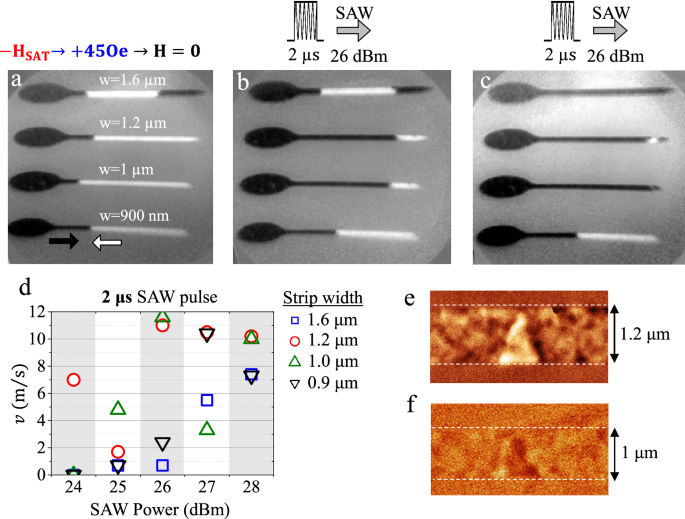
a XMCD-PEEM image of the magnetic configuration of four strips of various widths, as marked in the figure, after the field sequence shown on top of the figure. The arrows indicate the direction of magnetization. b Magnetic state of the same strips in (a) after a 2 μs 26 dBm SAW pulse and zero external magnetic field. c Magnetic state of the same strips in (b) after a second 2 μs 26 dBm SAW pulse and zero external magnetic field. d Plot with the DW velocity versus the SAW power, measured in the four strips shown in (a–c) after applying a single 2 μs SAW pulse with zero field (e) MFM image of the DW present in strips 1.2 μm wide (f) MFM image of the DW present in strips 1 μm wide.
Although Fig. 2d shows a clear increase in velocity with increasing SAW amplitude (see also Fig. S7 in the Supplementary Information), there is some variability in the results. In most of the experimental images presented in this work, it is evident that DW displacement exhibits a degree of stochastic behavior, possibly due to the polycrystalline nature of the ferromagnetic strip and lithographic imperfections. This stochastic behavior is also predicted by our micromagnetic simulations discussed later. Despite the dispersion in the results, strips 1 and 1.2 μm wide show, on average, a larger DW velocity for almost any SAW power. The maximum velocity measured was ~12 m/s. To image the type of DW present in the strips, we used magnetic force microscopy (MFM). In all the strips under study, we only observed transversal DWs, such as those shown in Fig. 2e for strips 1.2 μm wide and in Fig. 2f for strips 1 μm wide. The shape and width of the transversal DWs in wider or narrower strips may vary slightly from those shown in Fig. 2e, f.
The evidence shown in Fig. 2 implies that the field-free DW motion in the direction of the SAW propagation also depends on the width of the strip. We have conducted a detailed theoretical study with micromagnetic simulations to clarify the mechanism that allows the DW to move under the sole action of the SAW and only in the direction of the wave propagation.
The micromagnetic simulations were performed with mumax 3 software23, where the action of the SAW was included via the magnetoelastic field as explained in “Methods”. The simulation shown in this manuscript involves only one layer of the experimental stack—the FeCo layer—for two main reasons. Firstly, adding additional magnetic layers significantly increases the computational cost. Secondly, in preliminary experiments using strips made of a single FeCo layer, we observed DW motion in the direction of the wave propagation with a small external magnetic field present. Indeed, it will become clear that the simulation with strips made of a single FeCo layer accounts for all the experimental findings.
In Fig. 3a we show a schematic representation of the strip simulated, a single layer of FeCo, 3 nm thick and 1 μm wide. The SAW can be delivered from left to right, called SAW+, and from right to left, called SAW−. As shown in Fig. 3a, an asymmetric transverse DW like the ones observed by MFM is stable in the strip. The mechanical excitation is activated after the DW is stabilized at the center of the strip. Figure 3b displays the time evolution of the position along the nanostrip, \({X}_{{{\mathrm{DW}}}}\), for two values of the SAW amplitude \(\varepsilon\) and both propagation directions, left to right or SAW+ and right to left or SAW−. The equivalence between the SAW amplitude used in the simulations (in ppm) and the SAW amplitude used in the experiments (in dBm) can be found in Supplementary Information S1. Without SAW (black line), the DW remains at the center (\({X}_{{{\mathrm{DW}}}}=0\)) but if the SAW is activated, the DW undergoes a complex oscillatory motion that results in a net displacement along the direction of the SAW propagation. The process can be visualized in the animation in Supplementary Movie 1. In Fig. 3c, we present snapshots of the magnetization configuration for different values of the amplitude of the SAW, taken at the same instant (\(t=15\,{{{\rm{ns}}}}\)), showing that the DW moves along the direction in which the SAW propagates, and that the displacement increases with the amplitude of the SAW.
Fig. 3: Micromagnetic simulations of the acoustic movement of a magnetic domain wall.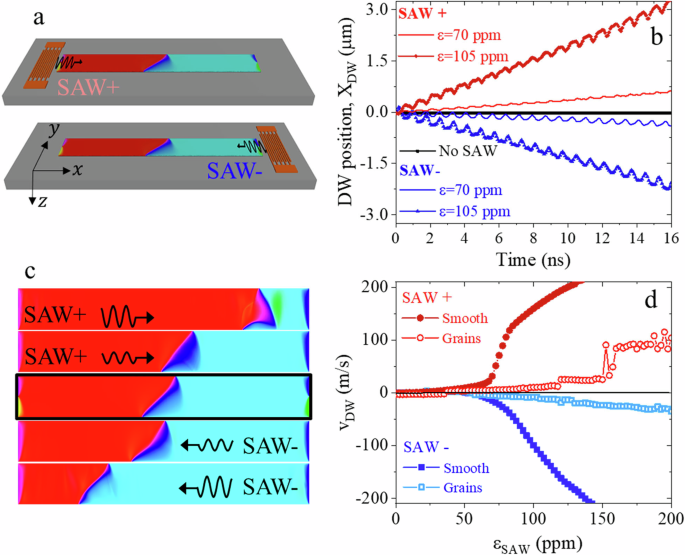
a Set up with a single transversal DW nucleated in the middle of a FeCo strip where the SAW is delivered from both directions. b Time evolution of the DW position along the nanostrip for several values of the SAW amplitude and propagation direction. c Snapshots of the magnetization configuration 15 ns after activating the SAW, where the color scale represents the magnitude of \({m}_{{{{\rm{x}}}}}\) (red for \({m}_{{{{\rm{x}}}}}=1\), cyan for \({m}_{{{{\rm{x}}}}}=-1\)), for SAW amplitudes of 70 and 105 ppm and opposite propagation directions. d DW average velocity versus the amplitude of the SAW for ideal-smooth and granular nanostrips in both SAW+ and SAW− directions.
In Fig. 3d, the average DW velocity, \({v}_{{{\mathrm{DW}}}}\), is plotted as a function of the SAW amplitude, \({\varepsilon }_{{{\mathrm{SAW}}}}\), for both SAW propagation directions. The DW speed increases monotonically with the amplitude of the SAW, and three regimes can be observed. After a linear regime with a small slope for low values of \({\varepsilon }_{{{\mathrm{SAW}}}}\), a rapid non-linear increase is found for intermediate values (\({\varepsilon }_{{{\mathrm{SAW}}}} \sim 70-100\,{{\mathrm{ppm}}}\)) followed by a recovery of the linear regime (\({\varepsilon }_{{{\mathrm{SAW}}}} > 100\,{{\mathrm{ppm}}}\)) with a larger slope than in the initial regime. Together with the velocity plots obtained for ideal samples (solid symbols), in Fig. 3d we also show the result obtained for samples with disorder (open symbols). Specifically, the disordered samples have a grain distribution of characteristic diameter \(d=20\,{{{\rm{nm}}}}\) and a standard deviation of the anisotropy constant among grains \(\sigma=3\%\). The DW velocity reduces significantly due to the pinning introduced by the disorder, and the regimes mentioned above are blurred. Nevertheless, the main effect remains: the SAW pushes the DW in the direction of its propagation. In Fig. 3b, d we also observe that the velocity for SAW+ and SAW− is different. This is due to the asymmetric configuration of the transversal DW, which is tilted with the \(x\) axis (see snapshots in Fig. 3c), resulting in an asymmetric response for opposite SAW propagation directions. This effect is highlighted in Fig. S11 of Supplementary Information, where the DW speed is plotted as a function of the angle between the nanostrip axis and the SAW propagation direction for the four possible DW configurations with equivalent energy. The maximum average velocity for each type of DW is obtained for a given angle, showing that the SAW-induced DW motion reported in this work distinguishes between different DW tilt and chirality configurations. This fact will become clearer after the discussion section. We should also mention that the longitudinal strain wave \({\varepsilon }_{{{\mathrm{xx}}}}\) is the responsible for the zero-field DW motion24,25, as shown in Supplementary Information S6. Additionally, the movement of the DW can be enhanced by reducing the magnetic damping, as shown in Supplementary Information S7.