
We first demonstrate the creation and field-resolved characterization of light transients, focusing on generating sub-cycle pulses. For this purpose, we chose an HCF with a 530 μm core diameter, filled with Ne gas. Figure 2a presents the measured spectra at the exit of the HCF as a function of Ne gas pressure. The spectra are corrected for the spectrometer response and normalized to the maximal intensity. As the pressure increases, self-steepening introduces spectral asymmetry, extending the broadening into the visible spectral region. This is confirmed by the central wavelength of the spectrum, which blueshifts as the pressure increases. The dashed line marks the centroid wavelength, which shifts from approximately 1,800 nm in vacuum to 1,654 nm at 1.1 bar, and to 1,366 nm at 2 bar. At a pressure of 1.5 bar, the spectrum reaches a width of about 1 octave, whereas the spectral bandwidth exceeds 2 octaves at a pressure of 2 bar.
Fig. 2: Field-resolved metrology of self-compressed light transients.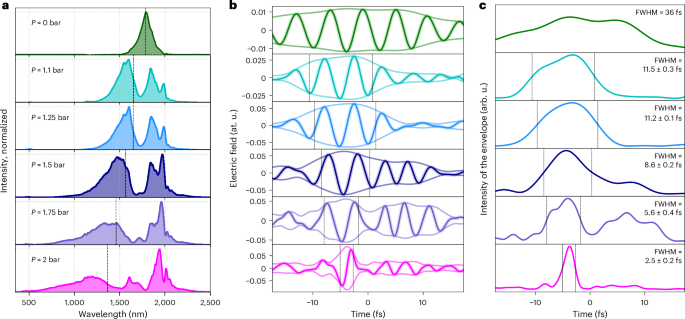
a, Measured spectra in Ne-filled HCF of 530 μm core diameter as a function of pressure. The black dashed line shows the central wavelength of the spectrum weighted by the intensity. Going from evacuated HCF to 2 bar Ne pressure, top to bottom, they are 1,785 nm, 1,654 nm, 1,651 nm, 1,566 nm, 1,460 nm and 1,366 nm. b, Reconstructed electric field waveform and envelope of the weak field of pulses in vacuum and broadened in 1.1 bar, 1.25 bar, 1.5 bar, 1.75 bar and 2 bar of Ne, respectively. The temporal profiles are obtained from the TIPTOE measurements and retrieved with the CRIME algorithm. For illustration purposes, we show a representative retrieved waveform, as the CEP of the input was not actively stabilized. c, Intensity of the reconstructed envelope of the weak field pulses. The black dashed lines in b and c indicate the limits of the intensity envelope’s FWHM, taken as the mean value from ten independent reconstructions. The corresponding FWHM value is shown in the legend of c, and the error in the pulse duration is expressed as the standard deviation calculated from these ten reconstructions.
The reconstructed electric field waveforms and the amplitude of the weak field obtained from the CRIME algorithm are shown in Fig. 2b, while the intensity of the envelope is shown in Fig. 2c. First, we note that in the case of pulses propagating through the evacuated HCF (green curves), the pulse duration cannot be reliably estimated because the measurement is limited by the scanning delay window of the split-toroidal mirror (set by design constraint at 35 fs). As a result, the reconstructed electric field does not approach zero at the boundaries of the scan range, preventing an accurate estimation of the pulse duration. Nevertheless, we can observe that the pulse length is comparable to the delay stage’s scan range. On the basis of the temporal characterization of the idler pulses before the HCF performed using frequency-resolved optical gating, and accounting for their propagation through materials before entering the HCF (5.2 mm CaF2, 1 mm fused silica (FS), 2.2 m of air), the duration is expected to be on the order of 36 fs.
Self-compression is achieved already at 1.1 bar, where the pulse duration decreases from approximately 36 fs to approximately 11 fs (full-width at half-maximum (FWHM)), marking a transition from a multicycle regime to 2-cycle pulses. As the pressure increases, even shorter pulses are obtained. In particular, the pressure is 2 bar, which leads to the generation of a sub-cycle light transient with an FWHM of the intensity envelope of 2.5 ± 0.2 fs. This is close to one-half of an optical cycle at the centroid wavelength of 1,366 nm (4.55 fs).
Having established that self-compression can create sub-cycle light transients, we now investigate their efficiency in generating SXR radiation, focusing on the water-window spectral region, specifically between 250 eV and 450 eV. Figure 3a shows HHG spectra in this spectral range generated in He using different Ne gas pressures in the HCF. The spectra have been corrected for the camera’s quantum efficiency, quantum yield and transmission through the 150 μm Al filter used to protect the detector. Given that the cut-off energy (Ec) is proportional to the ponderomotive potential25,26, which scales with the peak intensity and the square of the central wavelength (Ec ∝ Iλ2), one might expect that shorter pulses, owing to higher peak intensity, would enhance both Ec and the photon flux. However, our findings show a more complex behaviour. The counts at the C K-edge (284.5 eV) are maximized at 1.25 bar, corresponding to 2-cycle pulses at 1,653 nm. In this case, the high-harmonic flux increases by a factor of approximately 15 compared with evacuated HCF and is estimated to be approximately 0.27 pJ per laser shot (for the energy region captured by the charge-coupled-device (CCD) camera chip). Increasing the pressure further leads to a progressive reduction of flux, and at 1.75 bar, this enhancement is reduced to approximately 1.5. Examining the cut-off behaviour, we find that the highest photon energies are achieved at 1.1 bar of Ne in the HCF. Beyond this pressure, the cut-off shifts to lower energies, and by 1.75 bar, the highest photon energies coincide with the carbon K-edge. At even higher pressures, no HHG flux is observed above the carbon K-edge, so these results are not shown here. Two fundamental contributions may be important for understanding these effects: the blueshift of the central wavelength of the driving field, which accompanies the formation of a multi-octave-spanning spectrum, and the possibility that very short transients could suppress high-energy recollision events27.
Fig. 3: Generation of attosecond SXR pulses with self-compressed light transients.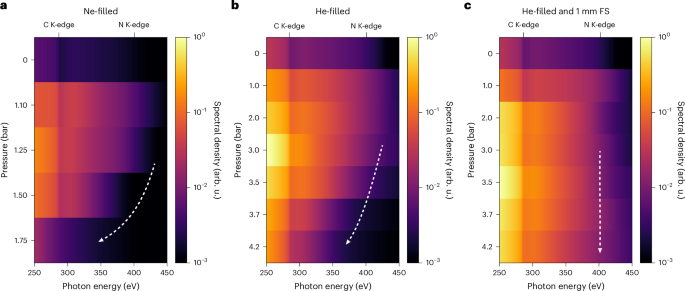
a, Measured HHG spectra after spectral broadening and self-compression in 530 μm core diameter HCF as a function of Ne pressure. b,c, Measured HHG spectra after broadening in 450 μm core diameter HCF as a function of He pressure without (b) and with (c) 1-mm-thick FS window inserted into the beam path before the HHG chamber. The recorded spectra were corrected for the transmission through a 150-μm-thick Al filter, the Jacobian of the wavelength-to-energy conversion, the camera’s quantum efficiency, the quantum yield and the grating efficiency. All spectra are presented on a logarithmic scale.
The influence of the central wavelength on the cut-off energy can be assessed using the intensity-weighted central wavelengths and the semi-classical model for the HHG cut-off energy26. Considering a peak intensity of 5.8 × 10¹⁴ W cm−2, as described in Methods, and given central wavelengths of 1,653 nm, 1,460 nm and 1,366 nm and durations of 11.5 ± 0.3 fs, 5.6 ± 0.4 fs and 2.5 ± 0.2 fs at Ne gas pressures of 1.25 bar, 1.75 bar and 2 bar, respectively, this results in a decrease in the cut-off energy from 495 eV to 392 eV, and further to 346 eV at 2 bar. However, this decrease in the cut-off energy is insufficient to account for the experimentally observed results.
To better understand the observed reduction, we thus compared the measured spectra with simulations based on the time-dependent Schrödinger equation (TDSE) shown in Extended Data Fig. 2. Detailed information on these calculations can be found in the ‘TDSE simulations’ section. Since the model does not include spatio-temporal reshaping of the driving field and phase-matching of the harmonics, it is intended only for qualitative comparison. These calculations were performed using the experimentally reconstructed field-resolved waveforms shown in Fig. 2b, maintaining a common peak intensity across all calculations. This approach aims to elucidate the effect of the pure pulse duration in the experimental observations in the HHG shown in Fig. 3a. We observe maximal cut-off energy above the nitrogen K-edge for a pressure of 1.25 bar in the HCF, which rapidly decreases with higher pressures, corresponding to shorter pulses for the HHG process. When the pulses reach the sub-cycle duration, the cut-off energy lies below the carbon K-edge, as illustrated in Extended Data Fig. 2c. Since the calculations were all performed with the same peak electric field (intensity) with averaging over all possible values of the carrier-envelope phase (CEP), the cut-off decrease observed in the calculations is clearly dominated by the reducing pulse duration, which shows that single-cycle pulses are the most efficient drivers when photon energies in the water window are desired, whereas sub-cycle pulses lead to cut-off energies that rapidly decrease with decreasing pulse durations. The main physical effect underlying these observations is the fact that deep sub-cycle transients are too short to efficiently drive both the ionization and the electron acceleration steps in the HHG process. The high nonlinearity of the ionization step requires a large electric field amplitude. For sub-cycle transients, the remaining field amplitude available to accelerate the electron is then no longer sufficient to reach the highest cut-off energies, which leads to a reduction of the cut-off.
A similar trend in the high-harmonic flux and cut-off energy is observed when the pulses are propagated in He instead of Ne. Extended Data Fig. 3 illustrates, in panel a, the spectra measured after the HCF, in panel b, the intensity of the envelope from the retrieved electric field, and in panel c, the corresponding measured SXR spectra.
As the pressure in the HCF increases, progressive spectral broadening and self-compression are observed. Owing to the lower nonlinearity of He compared with Ne, higher pressures are required to achieve similarly short pulse durations. In fact, sub-4 fs pulses are obtained only at pressures exceeding 4 bar.
Focusing on the effect of these compressed pulses on the HHG, we observe a progressive blueshift of the cut-off energy, similar to the results with broadening in Ne. In addition, when the pulses become shorter than 4 fs, efficient emission of high harmonics at the nitrogen K-edge is not observed. Specifically, this is achieved at 4 bar and 4.2 bar of He, when spectral broadening and self-compression generate pulses of 3.7 fs and 3.5 fs centred at 1,510 nm and 1,477 nm, respectively. Under these conditions, an integrated energy of 0.12 pJ per laser shot and 0.04 pJ per laser shot is estimated within the spectral window of CCD detection.
The presented configurations demonstrate the power of the self-compression scheme. Starting from idler pulses of 38 fs from an OPA, we reached pulse durations of half an optical cycle and spectra spanning more than 2 octaves. However, our results also indicate that these exceptionally short light transients generate a relatively low HHG flux in the spectral region between the carbon and nitrogen K-edges.
We therefore shift our focus from reaching the shortest pulse durations to optimizing the SXR photon flux and cut-off. For this purpose, we decreased the inner diameter of the fibre to 450 μm and used He as the nonlinear propagation medium.
We now study the performance of these pulses as drivers for HHG. Figure 3b shows on a logarithmic scale the HHG spectra as a function of the He pressure in the HCF.
We observe a significant overall increase in the detected photon flux compared with the 530 μm HCF filled with Ne. Specifically, the photon flux generated by pulses propagating through the 450 μm core diameter HCF filled with 3 bar of He is approximately 4 times higher than that obtained with the 530 μm HCF filled with 1.25 bar Ne at 284.5 eV. The estimated total energy of the integrated detected photon energy is approximately 1.1 pJ per laser shot at 3 bar. We attribute this enhancement to the generation of pulses at lower soliton number28, leading to more energy in the main envelope and less in the pedestals that intrinsically arise from the soliton self-compression, as shown in Extended Data Fig. 4. The highest photon flux is observed at 3 bar, with a driver of approximately 11 fs. With increasing pressures in the HCF, the pulses get shorter, which again leads to a decrease in the HHG flux and cut-off. Similar to the Ne-filled-HCF case (Fig. 3a), the cut-off energy is highest at 1 bar and decreases as the pressure in the HCF increases. By analogy with the Ne-filled-HCF case, this behaviour is associated with the decreasing pulse duration.
To counteract the positive chirp of a few-cycle pulse, bulk material with negative group velocity dispersion was inserted into the beam path before the HHG gas cell. Specifically, a 1-mm-thick FS window was chosen, as it exhibits negative group velocity dispersion over most of the multi-octave spectrum (with a zero-dispersion wavelength at 1.272 μm (ref. 29)). This addition improved the HHG flux and the cut-off energy. A comparison between Fig. 3b and Fig. 3c shows that the maximal flux is obtained at the higher pressure of 3.5 bar in the presence of FS compared with 3 bar in its absence.
We performed field-resolved measurements of the corresponding pulses, and the reconstruction, illustrated in Extended Data Fig. 4c, shows that 5.1 fs pulses are generated at a He pressure of 3.5 bar in the HCF after propagating through a 1-mm-thick FS window, corresponding to single-cycle pulses. This configuration enables high photon counts and favourable cut-off energy for the HHG spectrum while maintaining ultrashort mid-IR pulses. It also represents an optimal configuration for ATAS measurements. The ability to generate single-cycle pulses is particularly relevant for ultrafast studies involving strong-field light–matter interaction, as it confines the interaction to the single, most intense half cycle of the oscillating electric field if the waveform phase offset is approximately zero (corresponding to a cosine-type waveform).
To highlight the performance of our set-up in the SXR regime, we present, in Extended Data Fig. 5, a static measurement of N2O, demonstrating the beamline’s capability to resolve absorption spectra at the nitrogen K-edge.
Building on our investigation of HHG with self-compressed driving pulses, we now demonstrate the application of these ultrashort light transients to ATAS experiments. Specifically, we focus on the L2,3-edge of Ar, whose transient absorption features provide direct access to the temporal resolution of the experiment, as previously studied in ref. 30. Figure 4 presents ATAS two-dimensional (2D) maps recorded for different He pressures in the HCF: (a) at 2.2 bar, (b) at 3.2 bar and (c) at 3.8 bar. These pressures were selected to investigate the effects of two-cycle (a), near-single-cycle (b) and sub-cycle (c) IR pulses on the observed dynamics.
Fig. 4: ATAS with self-compressed light transients.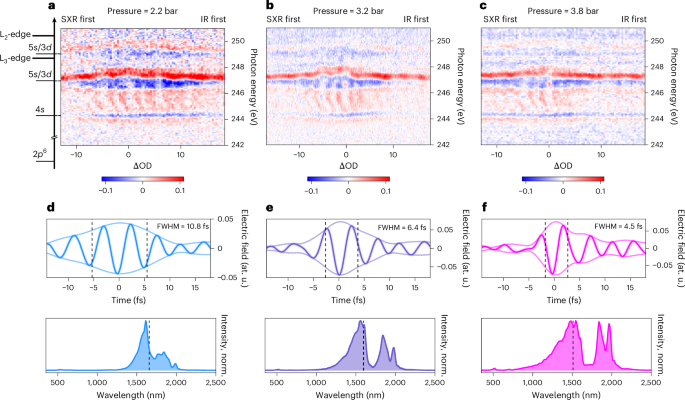
a–c, Measured ΔOD spectra of Ar obtained with self-compressed pulses following a 450 μm core diameter He-filled HCF at a pressure of 2.2 bar (a), 3.2 bar (b) and 3.8 bar (c). Reconstructed electric field waveforms of the IR pulses with CRIME algorithm (top panels) and the measured spectra (bottom panels) for the corresponding pressures, that is, 2.2 bar (d), 3.2 bar (e) and 3.8 bar (f), respectively. norm., normalised.
As reported in ref. 30, the ATAS measurements are dominated by the AC Stark shift of two autoionizing states with the configurations \(2{p}_{3/2}^{-1}4s\) and \(2{p}_{3/2}^{-1}5s/3d\). The AC Stark shifts of these two levels exhibit opposite trends: the former shifts towards lower energy, while the latter shifts towards higher energy during the overlap of IR and SXR pulses. In addition, it reflects the temporal structure of the pump pulses, which is composed of a short main pulse and a longer pedestal (extending beyond the delay range accessible by the experiment). The ATAS measurements confirm the progressive temporal compression as a function of the gas pressure within the HCF of the main pulse of the pump pulses. As illustrated in Fig. 4a–c, the AC Stark shift closely follows the main envelope of the pulses. In the transient absorption maps, a broad feature appears in the spectra between 244.1 eV and 246 eV, which is attributed to the formation of light-induced states. In agreement with ref. 30, this signal shows 2ω oscillations, distinctive fringes that beat with half the period of the IR pulse. This beating is visible in all three 2D maps and reflects the blueshifting of the IR pulse’s central wavelength owing to spectral broadening of the soliton self-compression scheme. A Fourier analysis done at each photon energy and integrated over the range from 244.1 eV to 246 eV shows that the oscillation periods are 2.7 fs at 2.2 bar, 2.5 fs at 3.2 bar and 2.3 fs at 3.8 bar. Doubling these periods of oscillation corresponds to IR wavelengths of 1,618 nm, 1,498 nm and 1,391 nm, respectively. The results of the Fourier analysis are shown in Extended Data Fig. 6, where the 2D maps illustrate the fast Fourier transform at each photon energy, whereas the top panel shows the fast Fourier transforms of the signals integrated over photon energies.
The extracted IR wavelengths from the period of the 2ω beating exhibit a blueshift that qualitatively aligns with the intensity-weighted wavelengths determined from the measured spectra: 1,657 nm at 2.2 bar (2 cycles), 1,598 nm at 3.2 bar (1.2 cycles) and 1,510 nm at 3.8 bar (sub-cycle regime). We notice that the central wavelengths extracted from the transient signal are systematically blueshifted relative to the corresponding spectral centroids. This shift is attributed to the propagation of the IR pulses through the He gas during the HHG process. This leads to additional spectral broadening and a blueshift of the field, as previously reported in refs. 31,32.
In the following, we present the reconstruction of the waveform phase offset of self-compressed light transients. Wiese et al.23 showed that the CRIME algorithm is sensitive to the phase of the laser-electric waveform. Building on this prediction, we show that the combination of self-compression, in situ TIPTOE technique and CRIME reconstruction algorithm can effectively retrieve the waveform phase offset of experimental sub-cycle pulses. For the realization of these measurements, we used light transients generated from a 530 μm core diameter HCF filled with 3.8 bar of He, using actively CEP-stabilized idler pulses as the input, as shown in Extended Data Fig. 7.
Figure 5a shows the measured relative ion yield (orange dots), with the orange shaded area indicating the standard deviation (σ) of the TIPTOE experimental trace, as a function of the delay between the strong pulse and the weak pulse. The blue curve shows the reconstructed relative ion yield. To assess the degree to which the relative ion yield is sensitive to the waveform phase offset, we applied a frequency-independent phase shift to the reconstructed phase of both weak and strong pulses, ranging from 0 rad to 3.14 rad. The resulting variation range is highlighted by the violet area. The fact that this variation exceeds the experimental uncertainty confirms that the reconstruction method can determine the waveform phase offset of the measured pulses.
Fig. 5: Measuring the waveform phase offset of light transients.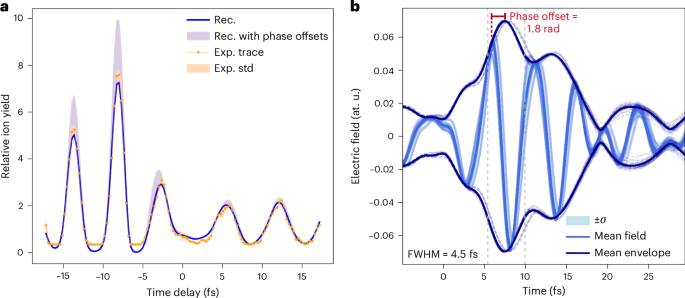
a, In orange dots, the measured relative ion yield between the strong and the weak pulses; in the orange area, the standard deviation (σ) of the measurements. In blue, the reconstructed one. The range of variation in the relative ion yield given by the phase shifts is shown by the violet area. b, Retrieved waveforms from the reconstructions with χ value below 1.7%. In light blue, the mean reconstructed waveform is shown, while the individual reconstructions are shown in more transparent colours. In dark blue, the mean envelope of the reconstructed electric field is depicted, while results from individual reconstructions are shown with dashed lines. The vertical dashed lines show the limit of the FWHM. Rec., reconstructed, Exp., experimental, std, standard deviation.
We performed 50 independent reconstructions of the same experimental TIPTOE trace (orange dots in Fig. 5a). From these 50 reconstructions, we selected those with a mean deviation between the experimentally recorded and the modelled relative ionization yield χ (ref. 23) below 1.7%. This criterion was set to exclude reconstructions exhibiting more than 35% variability from the optimal case, ensuring the selection of only the most consistent and reliable results. As shown in Fig. 5b, the reconstructed waveforms of the electric field are highly consistent, yielding a phase offset of 1.8 rad (defined with respect to the maximum of the envelope) with a σ of 0.3 rad. Since our ion-TIPTOE methodology cannot resolve the sign of the electric field, the waveform phase offset of 1.8 rad is defined modulo π.
Crucially, we show that these ultrashort transients can be measured in situ and in a phase-sensitive manner. This provides insight into the exact electric field driving strong-field dynamics, essential when investigating ultrafast electronic dynamics in atoms, molecules and condensed matter. The exact shape of the waveform indeed influences electronic coherences created by strong-field ionization12 or strong-field excitation8, as well as relative populations of the final states33. In addition, the characterization of pedestals inherent to few- and sub-cycle pulses is also a key asset for future attosecond experiments. Our approach thus combines sub-cycle temporal resolution, element specificity and field sensitivity in a flexible tabletop platform, opening opportunities for real-time studies of correlated and ultrafast electronic processes across the physical sciences.