
Cluster analysis
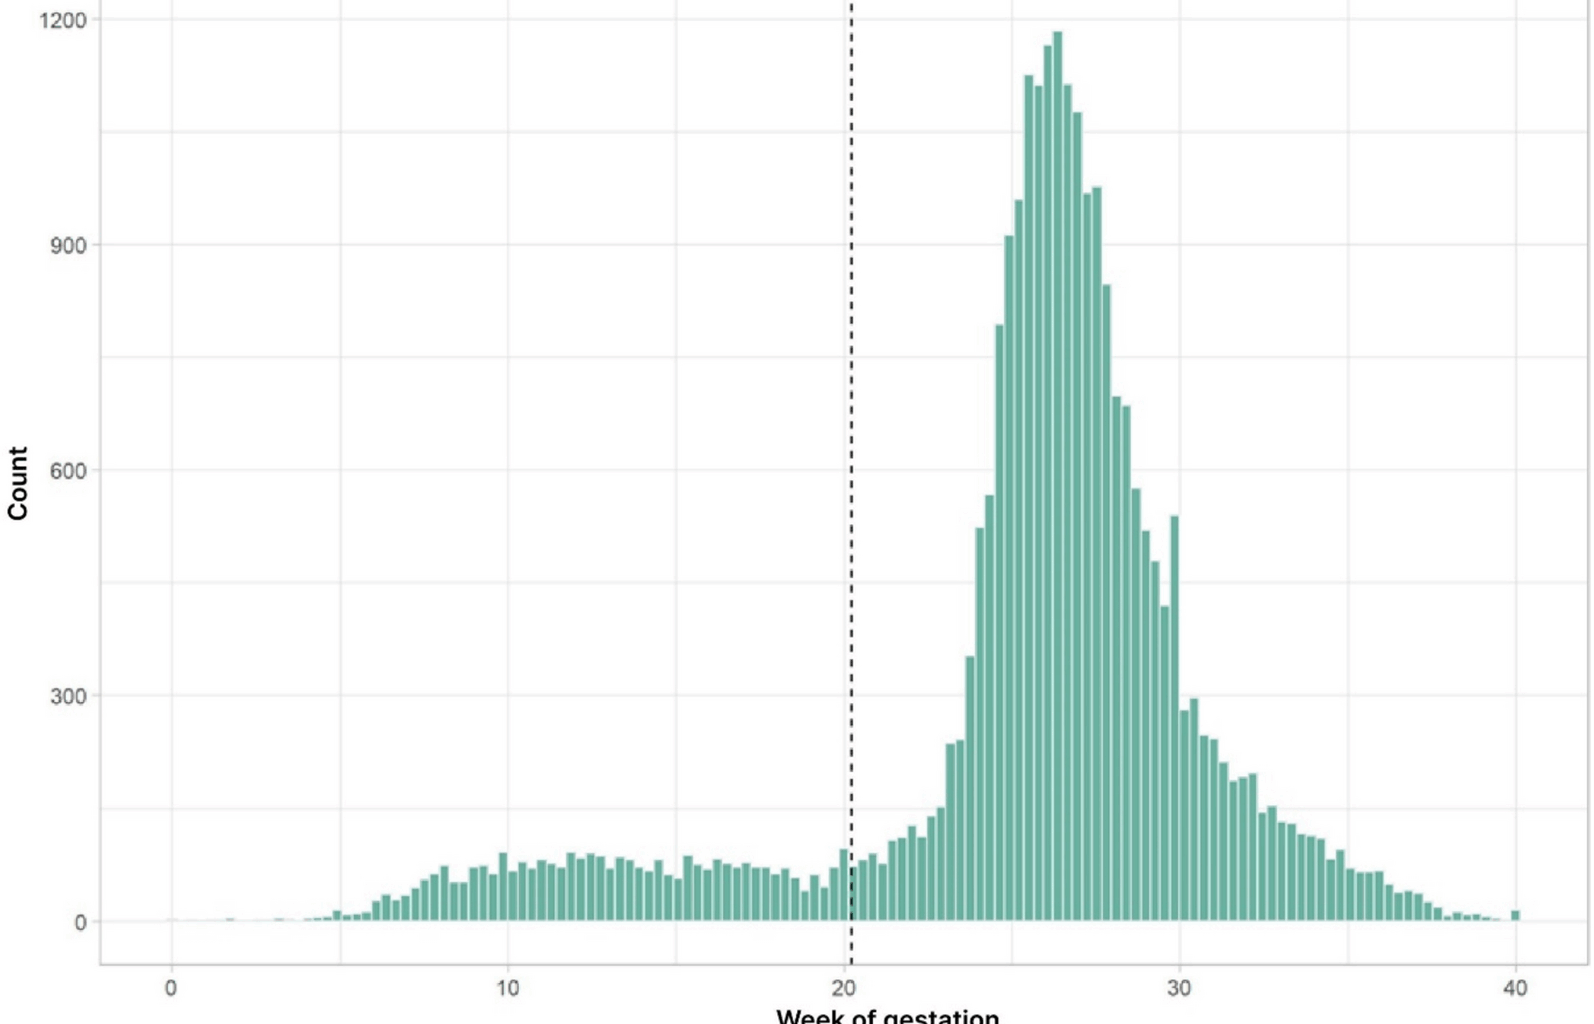
The frequency of GDM-diagnosis exhibits two distinct peaks of one around 12 and another of 27 weeks of pregnancy (Fig. 1). This observation allowed us to group all women with GDM in our data set into two distinct groups of either an eGDM or a sGDM. We used k-means clustering (k = 2 clusters) for the time of diagnosis to define a decision boundary, which was found to be approximately week 20.88 of pregnancy. Based on these observations we assigned all women with a GDM before week 20.88 as early GDM cases and all women diagnosed after this time point were considered as standard GDM. Altogether, we classified 1,639 patients as eGDM and 16,856 patients as sGDM.
Fig. 1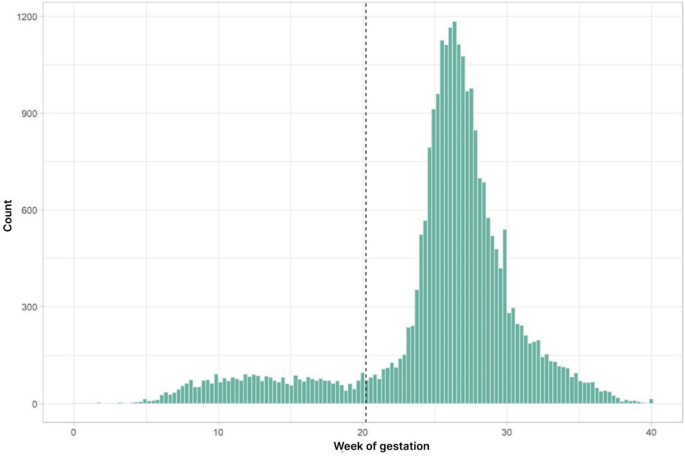
A histogram for the absolute frequency of GDM diagnosis as a function of pregnancy weeks. The women were grouped into two distinct sub-groups with an early and a late diagnosis using k-means clustering. The dashed line indicates this partition with the early/standard diagnosis group defined by a GDM diagnosis before/after week 20.88
Risk factors
We then compared maternal characteristics between the two clusters. These were balanced according to the discrimination of the cluster analysis (Table 1). Women with eGDM were more likely to present with a higher pre-pregnancy body weight (86.65 kg vs. 76.81 kg) and higher pre-pregnancy BMI (31.15 vs. 27.99 kg/m2). Weight appears to be one of the major risk factors according to our data, the eGDM group was 9.841 kg heavier prior to gestation compared to the sGDM counterpart. Maternal weight at the time of eGDM diagnosis however served no predictive value in our study.
Table 1 Maternal characteristics and laboratory results, by GDM type
The higher the body weight of the participants, the more likely the occurrence of eGDM (Cramers V = 0.136). The occurrence of eGDM increased almost linearly with the weight class of the pregnant women. The highes occurance of eGDM was observed in the weight class of obesity class 3 ((BMI > 40 kg/m2) n = 1093; eGDM 19.95%).
The fasting OGTT value was significantly higher in the eGDM cohort (eGDM: 98.064 mg/dl vs. GDM 94.663 mg/dl). Within the ranking of numerical variables, fasting glucose emerged as one of the strongest predictive values for eGDM manifestation. According to the Wilcoxon rank sum test, the effect size is 0.102, indicating a mild effect. The other OGTT values (1-h and 2-h values) showed a contrasting pattern and were consistently higher in participants with sGDM rather than eGDM. An eGDM diagnosis during pregnancy was also associated with a higher HbA1c of 5.22%. In comparison, individuals with sGDM had an average HbA1c of 5.194%. Among other variables, HbA1c appears to be a relatively weaker predictor for eGDM.
Maternal age differed insignificantly; women with eGDM were 0.601 years older compared to those with sGDM. Both groups had a mean age of 33 years. However, the difference is still too small to serve as predicative factor (very low effect size of 0.03).
Gravidity and parity were significantly higher in the eGDM cohort compared to the sGDM cohort. For 6284 Patients, it was their first pregnancy whilst a history of previous pregnancies was more common in the eGDM group (2.685) compared to the sGDM group (2.273). Therefore, parity was also increased in the eGDM cohort (eGDM: 1.270 vs. GDM 0.970).
One of the strongest associations with eGDM proved to be the previous history of GDM (Cramers V = 0.330). Of the 2.887 women diagnosed with a previous history of GDM, 831 developed eGDM (28.78%) compared to women without a previous history (4.67%). It was also the strongest predictive factor amongst the categorial variables.
Of the 5930 study participants with a positive family history of diabetes mellitus, 10.57% (n = 625) developed eGDM. Among 10,933 patients without a family history, 7.85% (n = 858) developed eGDM. According to the Cramers V test, the association to eGDM was 0.045, indicating no statistical association.
Prediction model for early GDM and Odds ratios
A binary logistic regression model for classifying pregnancies into eGDM versus sGDM was developed. A variable selection method identified nine predictor variables that, together, can predict early or standard GDM. These variables were included in the final logistic regression model, namely: BMI, maternal age, GDM in previous pregnancy, family history of diabetes mellitus, FPG, 1 h -and 2 h plasma glucose values, gravidity and parity (Table 2).
Table 2 Odds plot parameters making up the odds plot
We used odds ratios to quantify the predictive importance of each single variable (Fig. 2). For numerical variables, the odds ratio represents the change in risk for early versus standard GDM with a one-unit increase in the variable, when the other variables are kept constant. For binary variables, it shows the change in risk when the feature is present versus absent, when again all other variables are kept constant. Please note, that the odds ratios cannot directly be compared with each other, because a unit change in one variable has a different physical unit than a unit change in another variable.
Fig. 2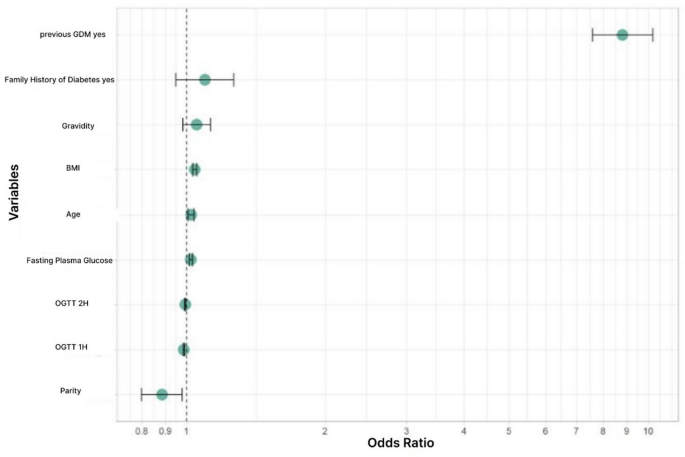
Odds Plot. Influence of increasing each variable by one Unit and therefore increasing the likelyhood of developing eGDM
GDM in a previous pregnancy (OR: 0.113; 95% CI 0.113–0.131) is significantly associated with a risk of developing eGDM. BMI (OR: 1.042; 95% CI 1.031–1.053) gravidity (OR: 1.052; 95% CI 0.982—1.127), FPG (OR: 1.022; 95% CI 1.014–1.030) and maternal age (OR 1.023; 95% CI 1.030–1.0394) are also associated with an increased risk of eGDM.
The odds ratios for a family history of diabetes mellitus (OR: 0.911; 95% CI 0.789—1.052), gravidity (OR: 1.052; 95% CI 0.982–1,127), parity (OR: 0.885), 1 h-plasma glucose level (OR: 0.988) and 2 h-plasma glucose level (OR: 0.994) were not significantly different from one at the 5% level in this multivariate logistic regression model. This indicates that these variables exhibit a high degree of variablity and are therefore not robust enough as markers for eGDM. However, when these variables were removed from the logistic regression model, the validation set accuracy of the prediction model decreases. This indicates that they still have some predictive value in addition to the variables with significant odds ratios. Therefore, we included them in the multivariate logistic regression model.
The classification performance of the resulting logistic was evaluated by a ROC curve indicating the tradeoff between sensitivity and specificity (Fig. 3). The area under the curve (AUC) of 0.83 (95% CI: 0.8027–0.857, sensitivity: 0.7680608, Ssecificity: 0.779) indicates a moderately good classification performance.
Fig. 3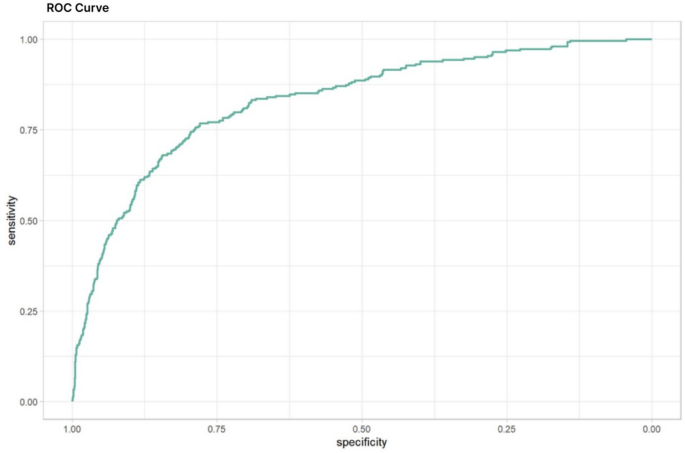
ROC Curve. The ROC curve for the logistic regression model, incorporating variables like BMI, age, prior GDM, family history of diabetes, fasting OGTT, 1-h and 2-h OGTT values, gravidity, and parity, achieved an AUC of 0.8298 (95% CI: 0.8027–0.857, Sensitivity: 0.7680608, Specificity: 0.779) indicating a moderately good predictive value
In summary, women with eGDM had higher pre-pregnancy body weight and BMI. They also had higher gravidity, parity, and a history of GDM in a previous pregnancy. The definition of eGDM as any GDM diagnosed before the 21 st week of gestation has now been validated by a robust dataset for the first time. A fasting plasma glucose level of 98 mg/dl [5,4 mmol/L] could serve as an effective screening tool for eGDM.