
It can be seen from the transient analysis presented in Fig. 3 that two exponential decay pathways play a significant role in describing the excited-state dynamics of the morpholine molecule following 250 nm absorption. Oliver et al. have previously reported that direct dissociation on the S1(3s/nσ*) potential energy surface to form H atom + excited morpholinyl \(\widetilde{{{{\rm{A}}}}}\) state radicals can only take place at excitation wavelengths <220 nm19. This pathway can therefore be ruled out in the present TRPEI measurements, even given the large (~20 nm FWHM) bandwidth of the 250 nm-centered DUV pulses generated using the RDW approach. At wavelengths >220 nm, Oliver et al. suggest that N–H bond fission instead occurs through a CI connecting the S1(3s/nσ*) excited-state surface to the S0 ground state, ultimately yielding ground \((\widetilde{{{{\rm{X}}}}})\) state morpholinyl radicals + H atom photoproducts. The extremely fast time constant extracted from our data (\({\tau }_{1}=7\pm 2\) fs) is therefore attributed to direct, ballistic passage through this CI via extension of the N–H bond, confirmed by our simulations as described below. As discussed shortly, however, this likely represents a lower bound for this process.
The second time constant seen in our transient data (\({\tau }_{2}=380\pm 10\) fs) may be assigned to the more “frustrated” pathway postulated by Oliver et al., in which excited morpholine molecules remain trapped on the S1(3s/nσ*) excited-state potential energy surface for a more extended period. The equilibrium structure of ground-state morpholine is pyramidal about the N atom center, and this geometry is initially preserved upon making a vertical (i.e., Franck–Condon) optical transition. In the explanation proposed by Oliver et al., the system evolves toward H atom + morpholinyl \(\widetilde{{{{\rm{A}}}}}\) state products following photoexcitation but does not pass through the CI connecting the S1(3s/nσ*) and S0 states unless the molecule acquires planarity about the amine moiety as the N–H bond extends. This prevents a fraction of the molecules from efficient decay via the CI and leads to a more gradual loss of S1(3s/nσ*) state population, as reflected in the slower time constant seen in our data (\({\tau }_{2}=380\pm 10\) fs).
To further investigate the above interpretation, the photoexcited dynamics were explored using trajectory surface-hopping simulations using XMS-CASPT2(2e,2o)/aug-cc-pVDZ for the electronic structure (see “Methods” section). All 233 trajectories that were run start in the S1(3s/nσ*) state, with 77% of these decaying to S0 within 500 fs and the other 23% remaining on the S1(3s/nσ*) potential surface throughout the simulations. The calculated classical adiabatic populations, shown in Fig. 6, reveal an evolution that correlates with two distinct photophysical pathways operating on two different timescales. The fastest of these is a direct decay pathway in which 18% of the trajectories undergo internal conversion to S0 in under 20 fs. In contrast, 59% decay on a significantly slower timescale, mapping onto the frustrated channel. By fitting the S1(3s/nσ*) population in a similar manner to the experimental data, we obtain bi-exponential behavior in the nonadiabatic dynamics with time-constants of \({\tau }_{1}=\) 30 ± 2 fs and \({\tau }_{2}=\) 465 ± 5 fs, in reasonable agreement with the lifetimes extracted from the TRPEI measurement. We note that the extension of the average N–H bond distance within the first 20–30 fs likely leads to a significant reduction in the photoionization cross-section as the S1 state changes from 3s to nσ* character (as expanded upon below)23,31,35. This may effectively lead to a slight shortening of the experimentally observed \({\tau }_{1}\) lifetime due to windowing. Furthermore, we note that the nuclear dynamics is treated classically in the simulations, thereby excluding nuclear quantum effects. Given the presence of a low barrier along the pathway from the S1(3s/nσ*) minimum to the S1/S0 minimum energy conical intersection (MECI, see “Methods” section), quantum tunneling could play a role in this system and contribute to the slightly shorter excited-state lifetimes in the experiment compared to the simulations.
Fig. 6: Classical adiabatic populations for the ensemble of surface-hopping trajectories.
The first excited state (blue, solid line) and ground state (red, dotted line) populations are shown for the duration of the simulations (500 fs) and are plotted with respect to the left-hand y-axis. The time at which trajectories ‘hop’ to the ground state is further illustrated by the histogram (gray bars), where each bin spans 5 fs and is plotted with respect to the right-hand y-axis. The green dashed line is a bi-exponential fit to the S1(3s/nσ*) population, yielding time-constants of \({\tau }_{1}=\) 30 ± 2 fs and \({\tau }_{2}=\) 465 ± 5 fs.
Moreover, our calculations unveil the structural dynamics driving these two distinct photochemical pathways by monitoring the two key internal coordinates that govern the excited-state dynamics in morpholine. These coordinates are identified as the N–H bond length and the pyramidalization angle formed by the intersection of the CNC plane with the N–H bond. We have selected a representative subset of trajectories to demonstrate the characteristic differences in the dynamics for the two channels, as shown in Fig. 7. First, there are trajectories that decay to the ground state in under 20 fs via the S1/S0 MECI, shown in panel a, that correspond to the fast decay pathway responsible for \({\tau }_{1}\). Second, illustrative trajectories that decay more slowly, corresponding to the slow frustrated pathway reflected by \({\tau }_{2}\), are displayed in panel b. In panel a, the trajectories start around the S0 minimum (55.12°, 1.02 Å) and evolve directly toward the S1/S0 MECI (−4.81°, 1.84 Å), bypassing the S1(3s/nσ*) minimum (−24.94°, 1.07 Å). In contrast, panel b shows trajectories that instead evolve toward the S1(3s/nσ*) minimum, and then continue to oscillate in the pyramidalization angle while being trapped behind the low potential energy barrier separating them from the CI, with average N–H bond distances at around 1.1 Å. Eventually, these trajectories cross the barrier on the S1(3s/nσ*) surface to access the CI seam with the ground state, leading to dissociation and decay to the S0 state. The different dynamics on display in these two sets of trajectories highlight the distinctions between the fast (\({\tau }_{1}\)) and the slow channel (\({\tau }_{2}\)). Furthermore, the fast decay is associated with the portion of the initially excited wavepacket that has sufficient momentum along the N–H bond to cross the potential barrier that shields the S1/S0 CI. This can be seen in panel c of Fig. 7, where the fast channel trajectories have larger initial velocity along the N–H coordinate. In contrast, the crossing of the barrier is more statistical in the slower frustrated channel, with comparatively weak correlation between the planarization angle and the propensity of the trajectories to cross the barrier, as seen in panel b.
Fig. 7: Evolution of N–H bond distance vs. the pyramidalization angle for the fast and the slow channels.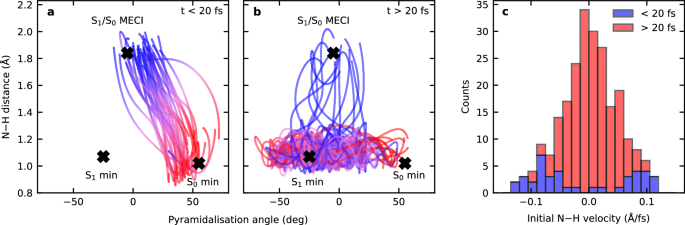
a, b Show traces for exemplary trajectories. The positions of the S0 minimum, S1(3s/nσ*) minimum, and S1/S0 MECI are also indicated. c Shows the distribution of initial velocities along the N–H bond distance for trajectories corresponding to the slow (red) and the fast (blue) channels.
To link the calculations more closely to the experiment, the structural evolution of these two key internal coordinates for the ensemble of trajectories on the S1(3s/nσ*) potential energy surface is shown in Fig. 8. The average N–H bond distance for the ensemble of trajectories is shown in panel a where an initial spike in this distance is observed at short timescales due to the large number of trajectories which dissociate in the fast regime (attributable to the decay pathway assigned to time constant \({\tau }_{1}\)). This distance then reduces again on a timescale of 100 fs or so before oscillating rapidly around 1.1 Å. The extension of the N–H bond also induces a significant contraction in the size of the 3s/nσ* molecular orbital, transitioning from predominantly diffuse 3s Rydberg character to a much more localized σ* orbital. For the pyramidalization angle, a sharp decrease is observed at short timescales, essentially switching between the equatorial and axial conformations of morpholine. After this, the pyramidalization angle increases again before oscillating around the S1(3s/nσ*) minimum. As the pyramidalization angle varies (with other coordinates held fixed at the minimum energy geometry), the diffuse nature of the S1(3s/nσ*) state is retained and moves with the relative orientation of the N–H bond. These properties on the excited state map well onto the observables measured in the experiment, which are mainly sensitive to the S1(3s/nσ*) population and dynamics.
Fig. 8: Temporal evolution of selected morpholine internal coordinates.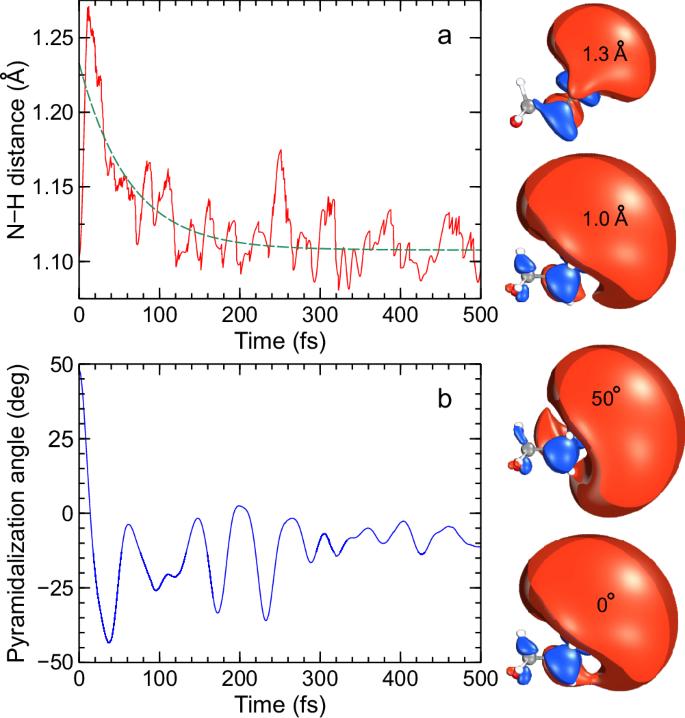
a Time dependence of the N–H distance for the ensemble of trajectories on the S1(3s/nσ*) potential energy surface. The S1(3s/nσ*) molecular orbitals (MOs) have a near-planar pyramidalization angle and show two selected N–H distances. b Time dependence of the pyramidalization coordinate. The MOs are now shown at a fixed N–H bond length for two different angular positions. The green dashed line in the upper panel shows a single-exponential fit to the data with a floating y-axis offset, and a time constant of \({\tau }_{{{{\rm{NH}}}}}=\) 63 ± 6 fs.
The data presented in Fig. 4 and Fig. 5 clearly reveal changes in PAD structure evolving on an intermediate timescale that sits in between the numerical \({\tau }_{1}\) and \({\tau }_{2}\) values that were extracted from transient photoelectron signals (and attributed to the excited-state population dynamics). Since the PAD reflects the electronic character of the state being ionized, this suggests a clear change in this property on a timescale of order 100 fs, with the obvious driver being the evolution of the average N–H bond length in the S1(3s/nσ*) state. This assertion is reinforced by a single-exponential fit to the average N–H bond length data presented in Fig. 8, which yields a time constant \({\tau }_{{{{\rm{NH}}}}}=\) 63 ± 6 fs. This is in good qualitative agreement with the average \({\tau }_{{{{\rm{\beta }}}}}\) of 115 ± 10 fs obtained from the temporal analysis of the angular experimental data. Furthermore, we note that the weak modulation in the various anisotropy parameters with time, as seen in Fig. 4, exhibits some resemblance to the oscillatory behavior seen in the pyramidalization angle plot of Fig. 8. We therefore tentatively suggest that periodic evolution of the morpholine geometry in this coordinate may be responsible for these more subtle changes in overall PAD structure. More detailed Fourier analysis of this aspect of the data is, however, inconclusive – although an expanded theoretical exploration of PAD anisotropy and the associated temporal evolution will form the basis of future investigations. Nevertheless, the excellent temporal resolution afforded by RDW-generated pulses in the DUV spectral region – coupled with the highly differential energy- and angle-resolved information present in our TRPEI measurements – brings detailed new insights to the excited-state dynamics of amine species. In this regard, we note that for the structurally related piperidine molecule (c-C5H11N), Klein et al. similarly invoked a picture of direct vs. frustrated dynamics to rationalize two distinct population lifetimes seen in a TRPEI study using 200 nm excitation36. However, that work was conducted with a cross-correlation of 160 ± 20 fs, which is over an order of magnitude larger than that used in the present study. Therefore, in that study, no clear distinction between the temporal evolution of the short-time population dynamics and the PAD structure could be resolved.
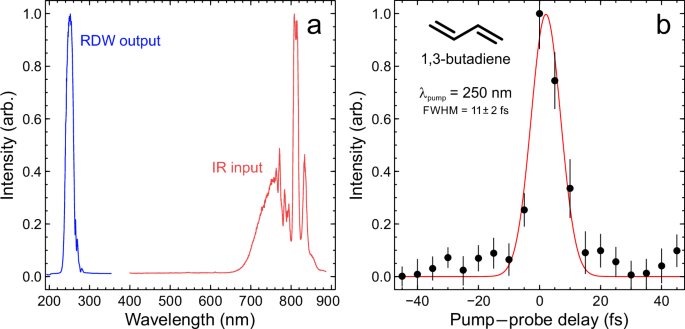
In summary, the excited-state excess energy redistribution dynamics operating in the morpholine molecule was investigated with extremely high temporal resolution using pump and probe pulses with central wavelengths of 250 nm and 800 nm, respectively. The 250 nm pulse was generated via RDW emission inside a helium-filled HCF, with the direct vacuum-integration of this output leading to a (1 + 3′) pump–probe instrument response function of just 11 ± 2 fs. Using the TRPEI technique, population dynamics associated with two different dissociation channels originating from the S1(3s/nσ*) excited state were resolved. The fast channel, exhibiting a time constant of just 7 ± 2 fs, was attributed to a ballistic H-atom dissociation through nonadiabatic crossing onto the S0 electronic ground state – although our supporting multireference electronic structure and surface-hopping molecular dynamics calculations indicate this is likely to be a lower bound. This arises due to an experimental windowing effect induced by rapid extension of the average N–H bond distance, and an associated reduction in photoionization cross-section as the S1 state transitions from 3s to nσ* character. The slower channel, with a time constant of 380 ± 10 fs, was assigned to a frustrated internal conversion process. This process traps the excited morpholine molecule on the S1(3s/nσ*) potential energy surface until the potential barrier shielding the CI to S0 can be crossed in an almost statistical manner. Our experimental and theoretical findings broadly confirm the direct and frustrated mechanisms originally proposed by Oliver et al. and reveal the key role of the potential barrier on the S1(3s/nσ*) state in controlling decay via the CI. Compared to the earlier hypothesis, the correlation between the planarization angle about the nitrogen heteroatom and internal conversion is weaker. Furthermore, the PAD data afforded by our TRPEI measurement reveals that the structural evolution of the morpholine molecule occurs on a distinct timescale to the population dynamics on the S1(3s/nσ*) state, with an approximate timescale of 100 fs that links to the N–H bond distance.
Our overall results provide new insight into the fundamental photophysics and photochemistry of the N–H chemical bond and clearly highlight the value of obtaining highly differential energy- and angle-resolved data when undertaking time-resolved spectroscopic measurements. More importantly, however, our investigation showcases the potential of optical sources based on the principle of RDW emission to advance the current state-of-the-art in ultrafast science. This is not just through the exceptional time resolution such sources offer, as demonstrated here, but also the potential to exploit broadly tuneable pulses down into the VUV region in a compact tabletop setup. We therefore anticipate that our work will provide an important stimulus for the wider use and further development of such novel sources for a range of spectroscopic applications spanning multiple scientific disciplines.