
Phase composition of the synthesized phosphors
Figure 2 displays a typical X-ray diffraction pattern of the SrAl2O4 powders produced after being synthesized at 1400 °C. The produced powder’s XRD patterns were measured and contrasted with monoclinic SrAl2O4 PDF standard cards (No. 74–0794).
Fig. 2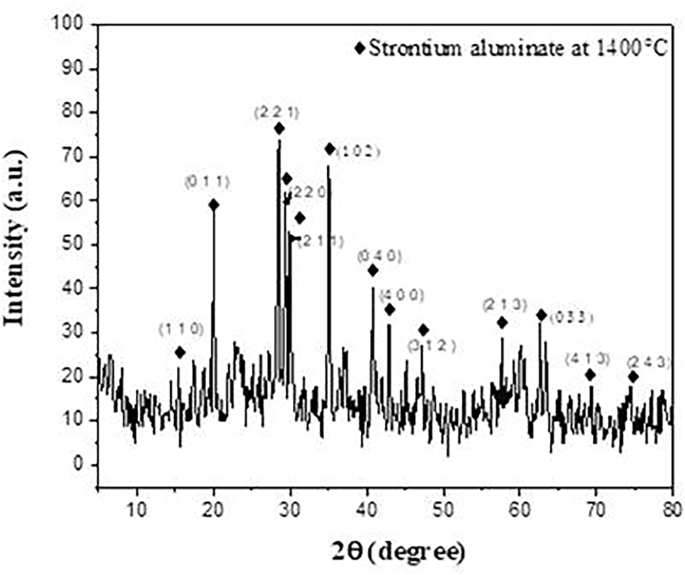
XRD patterns of SrAl2O4 fired at 1400℃
As can be observed, the XRD patterns mostly show the formation of monoclinic phase diffraction peaks of SrAl2O4, which is consistent with the earlier findings [30, 31], as depicted in Fig. 2. Furthermore, certain noise peaks may have formed as a result of the particles’ rapid heating and the great distance between them that decreases the rate of the reaction to occur. Later, in the second firing state, this unreacted phase is finished.
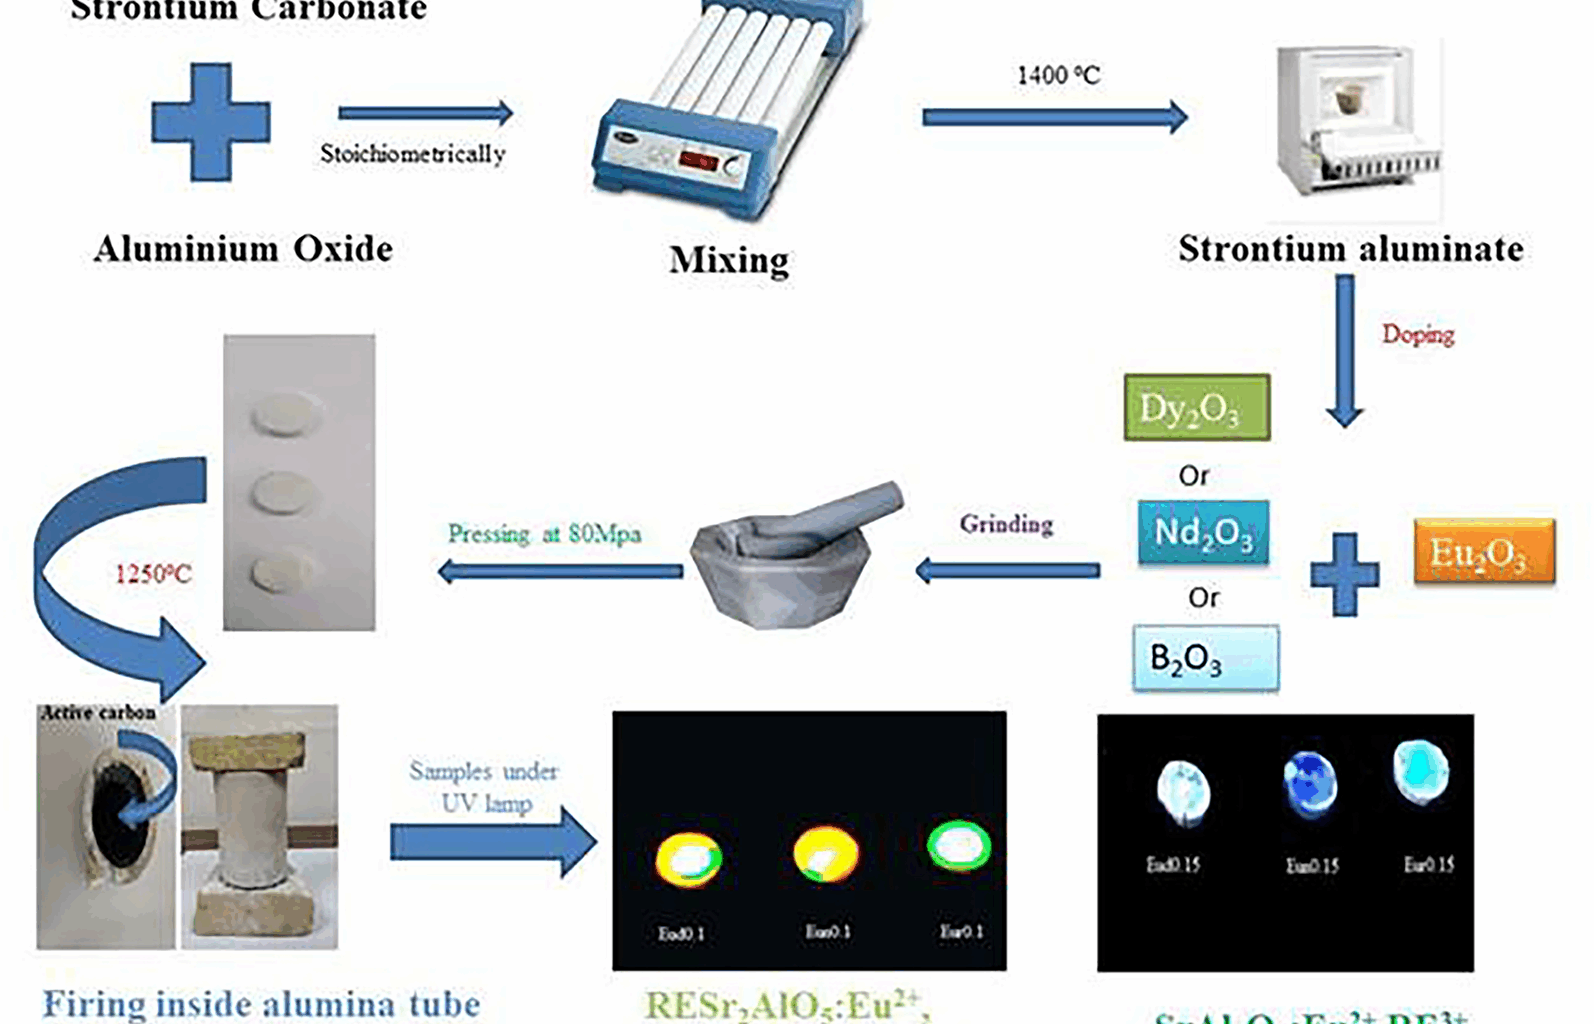
The interfacial interaction between SrCO3 and α-Al2O3 is responsible for the solid-state production of SrAl2O4 and occurs as follows:-.
At 1000 °C, SrO combines with Al2O3 to form SrAl2O4 in a locally reached 1:1 M stoichiometric ratio. This reaction is caused by strontium carbonate breaking down into SrO, which is shown as follows:
$${\text{SrO}}\,+\,{\text{C}}{{\text{O}}_{\text{2}}}\,=\,{\text{SrC}}{{\text{O}}_{\text{3}}}$$
(1)
$${\text{SrO}}\,+\,{\text{A}}{{\text{l}}_{\text{2}}}{{\text{O}}_{\text{3}}}\,=\,{\text{SrA}}{{\text{l}}_{\text{2}}}{{\text{O}}_{\text{4}}}$$
(2)
Conversely, SrAl4O7 was produced at temperatures more than 1000 °C, and this is ascribed to the chemical interaction between SrO and Al2O3 as a result of a locally developed 1:2 M stoichiometric relationship, as demonstrated by the following reaction:
$${\text{SrO}}~+~{\text{2A}}{{\text{l}}_{\text{2}}}{{\text{O}}_{\text{3}}}\, \to \,{\text{SrA}}{{\text{l}}_{\text{4}}}{{\text{O}}_{\text{7}}}$$
(3)
$${\text{SrA}}{{\text{l}}_{\text{2}}}{{\text{O}}_{\text{4}}}\,+\,{\text{A}}{{\text{l}}_{\text{2}}}{{\text{O}}_{\text{3}}}\, \to \,{\text{SrA}}{{\text{l}}_{\text{4}}}{{\text{O}}_{\text{7}}}$$
(4)
Nevertheless, this phase breaks down as follows, since it is not stable at this temperature:
At temperatures more than 1150 °C, the leftover SrO combines with Al2O3 to generate Sr3Al2O6, as demonstrated by the following reaction:
$${\text{3SrO}}\,+\,{\text{A}}{{\text{l}}_{\text{2}}}{{\text{O}}_{\text{3}}} \to {\text{S}}{{\text{r}}_{\text{3}}}{\text{A}}{{\text{l}}_{\text{2}}}{{\text{O}}_{\text{6}}}$$
(5)
$${\text{S}}{{\text{r}}_{\text{3}}}{\text{A}}{{\text{l}}_{\text{2}}}{{\text{O}}_{\text{6}}}\,+\,{\text{2A}}{{\text{l}}_{\text{2}}}{{\text{O}}_{\text{3}}} \to {\text{3SrA}}{{\text{l}}_{\text{2}}}{{\text{O}}_{\text{4}}}$$
(6)
By raising the temperature above 1200 °C, Sr3Al2O6 changes into SrAl2O4 [32,33,34].
In the XRD patterns (Fig. 3) for the Eud0.15, Eun0.15, and Eur0.15 samples, pure monoclinic phase diffraction peaks of SrAl2O4 predominate, consistent with the earlier observations. The absence of any other product or beginning material indicates that the precursor powders have a phase composition of low-temperature monoclinic phase (α-phase). As seen from Fig. 3, incorporating Nd3+ and B3+ ions enhances the formation of the SrAl2O4 phase rather than the Dy3+ ion.
Fig. 3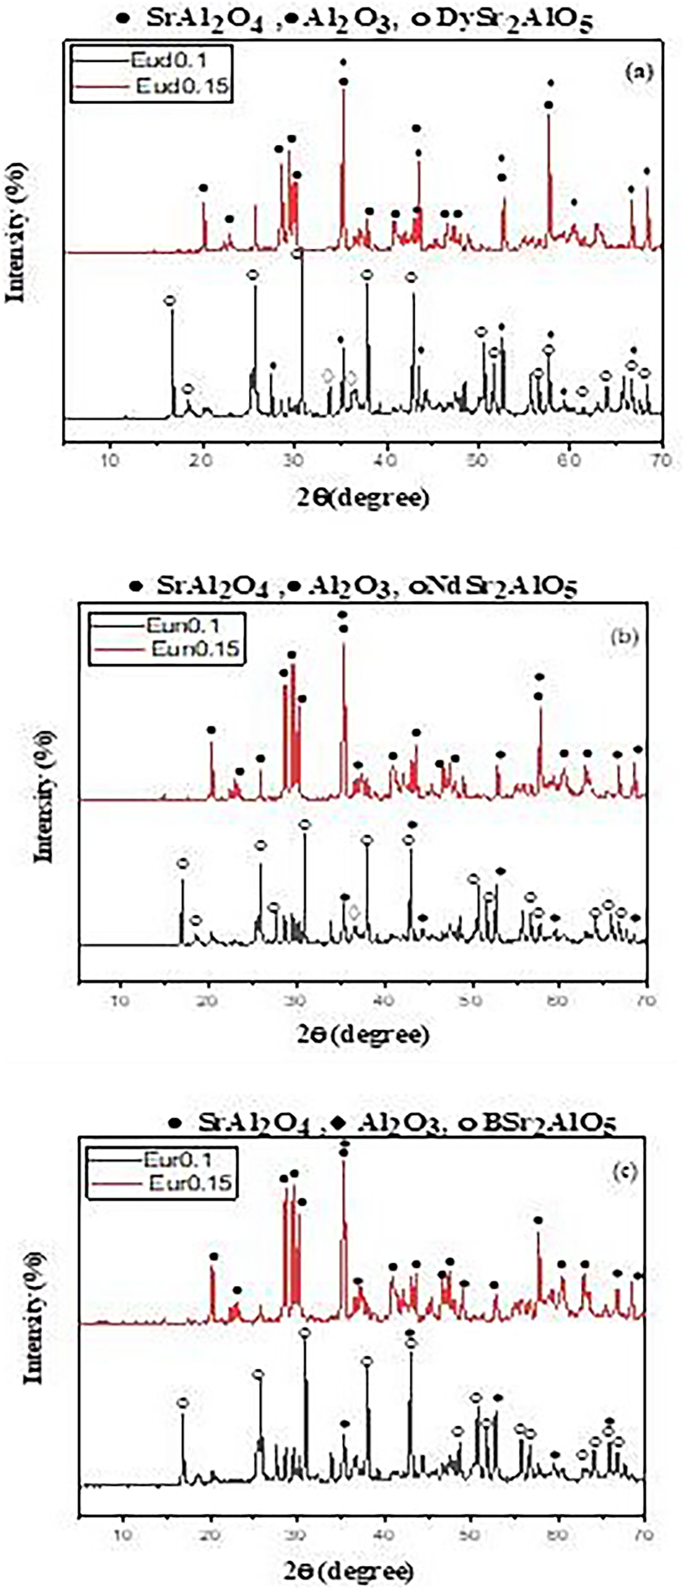
The XRD pattern of the prepared strontium aluminate samples fired under active carbon at 1250℃ in presence of different trivalent oxides
Therefore, the addition of rare earth ions in high percentages did not affect the host’s crystal structure and agglomerated. Rietveld refinement investigations [35] indicate that rare earth ions can substitute at all cationic sites when integrated into the crystal structure of SrAl2O4. The ionic radii of Al3+ 0.053 nm and Nd3+ (0.0983 nm cannot be replaced by Eu2+ (0.117 nm) due to the mismatch between each ionic radius. Eu2+/Nd3+ ions favor occupying Sr2+ sites (Sr2+=0.127 nm) [36]. SrAl2O4 is enhanced by Nd3+ ion addition rather than Dy3+ addition because Sr2+ and Nd3+ have ionic radii that are more similar than Dy3+ (Dy3+=0.091 nm) [37].
Songhak Yoon [38] explained the enhanced SrAl2O4 phase formation in the case of B2O3 introduction. He claimed that the B3+ ion caused the SrAl2O4 crystal lattice to shrink, resulting in a greater number of crystal defects, which is what allowed for the creation of SrAl2O4 hosts. Shanshan Yea [39] demonstrated a similar outcome, showing that B2O3 up to 2.5 mol% promotes the crystallization of SrAl2O4. This is because B3+ is much smaller than Al3+, which causes the lattice to compress and form additional flaws when B2O3 is added.
The decrease in the intensity of SrAl2O4 phases for patterns Eun0.1, Eud0.1, and Eur0.1 prepared with a low concentration of Eu rare earth element was observed in Fig. 3. A new phase called RESr2AlO5 (R = Nd3+, Dy3+or B3+ions) developed with small amounts of SrAl2O4 and aluminum oxide as the rare earth act as a dopant. The XRD pattern of RESr2AlO5 is similar to the EuSr2AlO5 XRD card (PDF 70-2197) [40]. The best intensity of RESr2AlO5 was observed for the sample containing Dy2O3 rather than Nd2O3 and B2O3.
Thus, the doping of calcined powder with a low amount of trimetal oxide (Dy2O3, Nd2O3, or B2O3) enhances the formation of SrAl2O4, as seen in Fig. 3, as its small amount is not sufficient to complete the reaction to form the luminescent structure RESr2AlO5. While in the case of a high concentration of trimetal oxide at the expense of Eu2O3 (Eud0.1, Eud0.1, and Eur0.1) and the presence of the weak reducing atmosphere, the reaction entirely occurred by forming the luminescent structure RESr2AlO5: Eu2+ (RE = Dy3+, Nd3+, B3+) beside SrAl2O4: Eu2+, RE3+.
Similar to this rapid formation of RESr2AlO5 with SrAl2O4, Wanping Chen et al. [41] used a high-temperature solid-state technique to manufacture La0.97Sr2−xCaxAlO5:0.03Eu. It was shown that when x = 1 is adjusted to x = 1.5, the product phase rapidly changes from La(Ca, Sr)AlO4 to LaSr2AlO5. Furthermore, P. J. Chaware [42] discovered that when oxidation occurred in an oxygen atmosphere, a comparable peak of SrAl2O4 formed with other peaks. This rapid change in our work could perhaps be due to the use of a weak reducing environment and the presence of SrO2 and Al2O3 in an amorphous phase that reacted with excess trimetal oxide (Dy2O3, Nd2O3, and B2O3) and formed the RESr2AlO5 compound with SrAl2O4.
FT- infrared measurements
The infrared transmission spectra of prepared phosphors fired at 1400˚C are shown in Fig. 4. The Fourier conversion Infrared spectra were captured within the 400–4000 cm− 1 wave number range. A series of absorption peaks in the 400–900 cm− 1 range revealed the monoclinic crystal structure of SrAl2O4. Al–O, Sr–O, and Sr–O-Al bond vibrations are linked to the metal-oxygen stretching frequencies in Fig. 4 that vary from 400 to 1000 cm− 1. Attributing the antisymmetric stretching bonds at 500 and 646 cm− 1 to the Sr-O vibrations is possible. The symmetric bonding of O-Al-O is most likely the cause of a band at 439 cm− 1 [43]. The high peak of the sample at 845 cm− 1 was linked to the formation of SrAl2O4 [44]. The absorption bands arise from the vibrations in CO3 − 2 between 400 and 1800 cm− 1, which in turn contribute to the vibrations of SrCO3 at 1443, 845, and 768 cm− 1, respectively, resulting in asymmetric and symmetric C–O stretching, out-of-plane bending, and in-plane bending. Furthermore, at 493 and 500 cm− 1, stretching vibrations of the distinctive Al–O and Al–O–Al bond peaks of Al2O3 are observed [45]. Broadband is seen in the spectra between 3320 cm− 1 and 3481 cm− 1 due to the free and hydrogen-bonded hydroxyl groups (OH−stretching vibrations).
Fig. 4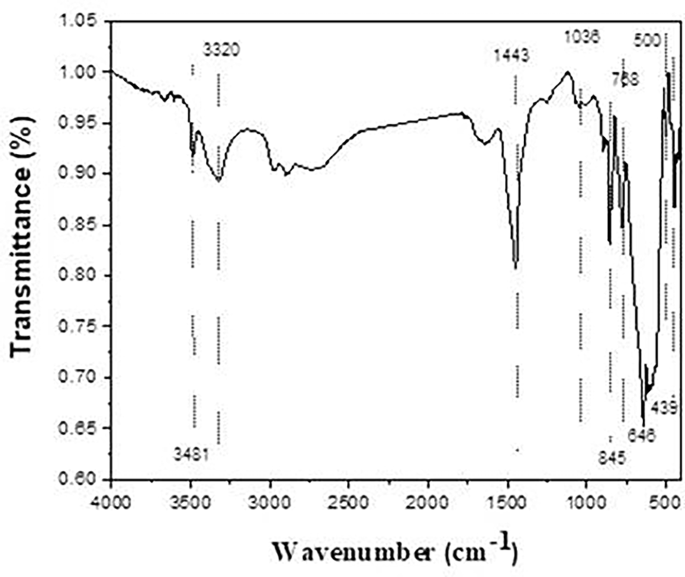
IR spectra of the prepared strontium aluminate fired at 1400℃
As shown in Fig. 5, the spectra of Eud0.15, Eun0.15, and Eur0.15 samples are similar in peaks with different intensities. The peak around 845 cm-1 [43, 46] still exists due to an excess of SrAl2O4 (which is confirmed with XRD). Al–O and Sr–O–Al bond vibrations are linked to metal oxygen stretching frequencies near 700–1000 cm–1 [43].
Fig. 5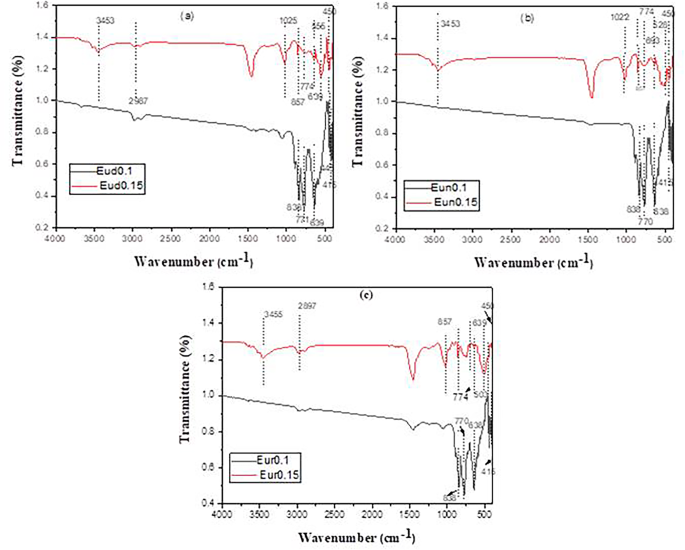
IR pattern of the prepared strontium aluminate samples fired under active carbon at 1250℃ in presence of different axides
The spectra of the Eud0.1, Eun0.1, and Eur0.1 samples (Fig. 4) show an intense vibration at around 1450 cm− 1 [47], which can be attributed to the stretching vibration of tetrahedral AlO4. This indicates that SrAl2O4 remains present in significant amounts, as observed and discussed in the XRD analysis. In addition, distinct peaks are observed between wavenumbers 1000 cm− 1 and 400 cm− 1, indicating the presence of metal-oxygen bonds. SrO at approximately 639 cm− 1, Al–O between 774 and 857 cm–1, and Al–O at 450 cm–1 are the representative values for the symmetric vibration of O–Al–O [48].
Microstructure of the prepared luminescent materials:-
Figure 6 shows the SEM micrographs for samples Eud0.1, Eun0.1, and Eur0.1 at different magnifications. The majority of them are different-sized faceted crystals.
The powders were in the shape of clusters, which resembled coral structures, as seen in Fig. 6 (Eud0.1) and (Eun0.1). It was observed that powders were all comparable to coral structures. Furthermore, a portion of the needle-like bulk phosphor started to stick to the large-grained bulk phosphor’s groove surface [49]. It was discovered that the small-sized, needle-shaped phosphors had essentially covered the surface of the large-particle pieces. Subsequently, the needle phosphors seemed to aggregate on the block phosphor surface, forming cluster needle formations with a uniform covering [49]. This needle shape refers to SrAl2O4 phosphor.
SEM examinations examined changes in the prepared phosphors (Eud0.15, Eun0.15, and Eur0.15). As shown in Fig. 7, some irregular particles appeared, along with some spherical and needle particles that belong to the formation of SrAl2O4 [50]. The needle particles surround the irregular particles in Fig. 7a, which belong to the SrAl2O4 phosphor.
Fig. 6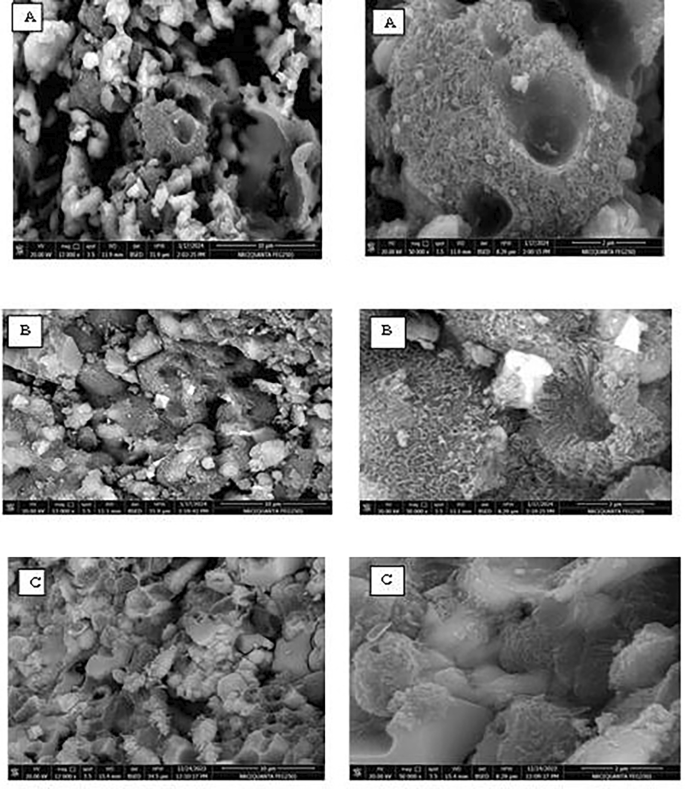
SEM of prepared phosphors (A) Eud0.1, (B) Eun0.1 and (C) Eur0.1 samples
Fig. 7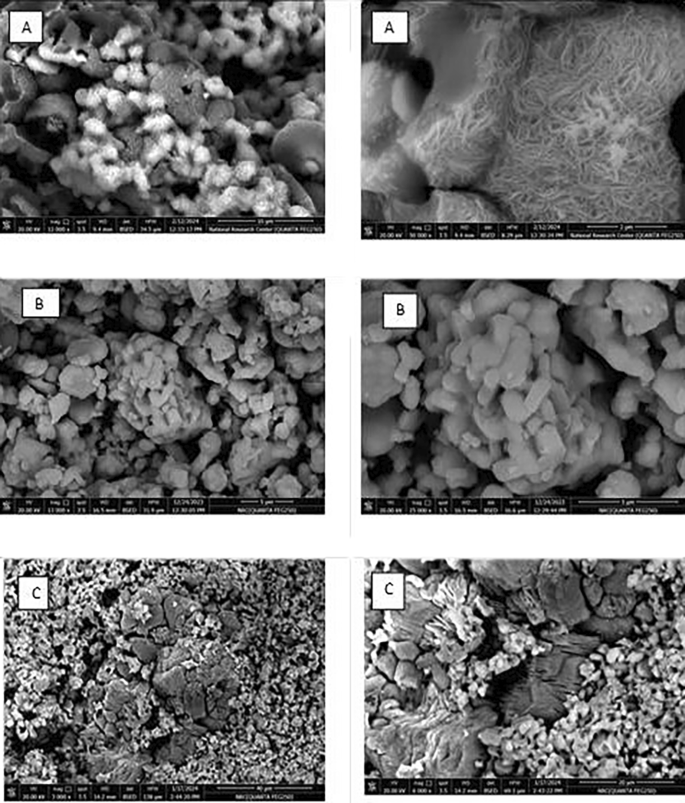
SEM of prepared phosphors (A) Eud0.15 (B) Eun0.15 and (C) Eur0.15 samples
That is confirmed by the photograph image of samples in Fig. 1, i.e., reddish-orange phosphorescence encircled by a green ring. The corresponding high-magnification SEM image reveals that the B2O3-containing sample has many tiny flakes [21]. These small plates overlapped with one another, creating compact sheet structures. When B2O3 is added, the particles’ morphology becomes more asymmetrical and has faceted edges.
Physical properties
Figure 8 displays the bulk density and apparent porosity of the fired-prepared samples. It was observed that the type of activator (Dy, Nd, or B elements) with the primary activator (Eu) significantly affected the apparent porosity and the bulk density differently as they were added in different weight ratios.
Fig. 8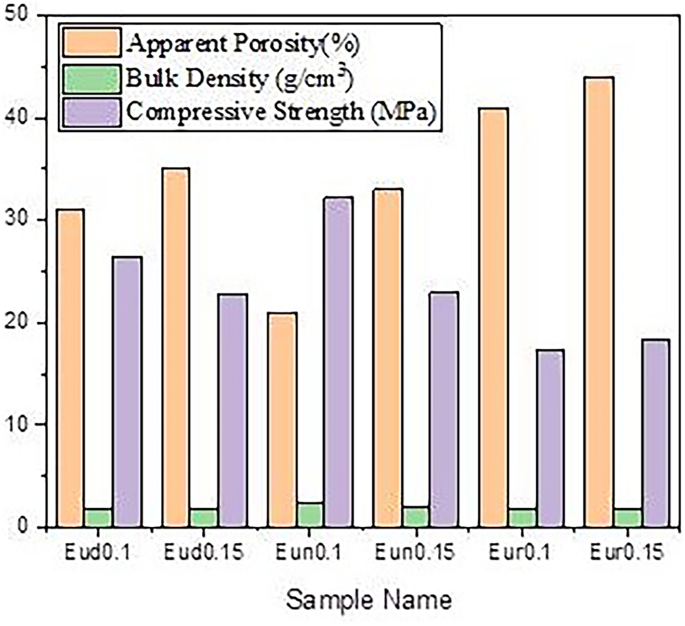
Apparent porosity, Bulk density and compressive strength of prepared phosphors samples
The apparent porosity of Eud0.1, Eun0.1, and Eur0.1 samples is smaller than that of Eud0.15, Eun0.15, and Eur0.15 samples. This results from the creation of some Al2O3 and SrAl2O4 between the RESr2AlO5 grain boundaries, which fill part of the pore regions.
Furthermore, a different reason why these might be less porous could be due to the difference in the crystal structure between RESr2AlO5 (RE: Dy, Nd, B) and the SrAl2O4 phase. This can be described as follows: although the crystal structure is similar to the spinel structure of AB2O4, strontium aluminate, or SrAl2O4, has a stuffed tridymite-type structure. The large size of Sr2+ (1.18 Å) may cause this behavior as it inhibits the formation of the spinel structure [51, 52].
Two crystallographic polymorphs exist for strontium aluminate, or SrAl2O4: hexagonal symmetry, the ideal, undistorted structure, which is stable above 650 °C, and monoclinic symmetry, which is stable below this temperature. Several authors prove that the transformation from the monoclinic phase (P21) to the hexagonal phase (P6322) is a reversible process [53]. To address the discrepancies in the data, Avdee et al. [54] conducted a thorough analysis of the structural behavior. They postulated a second-order transition to P6322 at 860 °C and a monoclinic → hexagonal phase transition at 680 °C, corresponding to the space group P63.
SrAl2O5 has a tetragonal structure with eight crystallographic sites. This structure reveals details about the doping of incoming activator ions and possibly the luminescent center of the host matrix. The three types of polyhedra that collectively make up the RESr2AlO5 crystalline structure are [R/SrO8, [SrO10], and [AlO4] units [55]. In this structure, the host R3+ ions are found at half of the 8 h crystallographic sites, generating an eight-fold coordination polyhedral unit known as [R(1)O8]. While Sr (3) occupies 4a positions and forms [Sr(3)O10] coordinated polyhedra, Sr(2) fills the other half of the 8 h atomic sites and forms [Sr(2)O8] polyhedra.
Similarly, Sr2+ has two distinct locations. In addition, four oxygen atoms are coordinated with Al to form the Al (4)O4 unit found in the 4b crystal locations. The O (5) and O(6) occupy the remaining 4c and 16 l positions, respectively [55].
Thus, the high porosity of Eud0.15, Eun0.15, andEur0.15 is attributed to SrAl2O4 having a hexagonal structure with low active sides, where (Eud0.1, Eun0.1, and Eur0.1 samples) exist in tetragonal structure with 8 crystallographic site in their structure (DySrAl2O5), that is significantly affected in coordination of their structure and subsequently on their porosity.
It has been discovered that samples containing Dy2O3 or Nd2O3 are less porous than those containing B2O3. This can be attributed to the radius of the element that fills pores. Dy+ 3 and Nd+ 3 cations have 0.0912 nm and 0.0983 nm, respectively, where B+ 3 has a smaller atomic radius equal to 0.001 nm [56], forming a more porous structure in the samples.
Compressive strength
The measured compressive strength of the fired sample is displayed in Fig. 8, and the result is consistent with the apparent porosity measurement. All the samples show low strength values. However, sample C, which has the lowest porosity and is doped with boron, has a higher result for compressive strength. For porous materials, an increase in total porosity generally decreases compressive strength [57]. This tendency is nearly universal. Previous research suggests that variations in the strength of the porous body caused by the growth of the grains increased the number of contacting sites inside the porous body. It takes center stage as the primary cause of the porosity shift. Furthermore, several academic publications [58, 59] claim that pores degrade mechanical properties. Because more significant defects cause more fractures in ceramic components than smaller ones, porous ceramics with more prominent pores are expected to have lower mechanical strengths than those with smaller pores, even in cases where porosity is the same.
Photographs of the samples
An LED chip-phosphor system can produce white light; various phosphorescence behaviors are seen when samples are exposed to LEDs. Samples Eud0.1, Eun0.1 and Eur0.1 showed reddish-orange phosphorescence behaviors encircled by a green ring, as shown in Fig. 1. This is because visible spectrum colors like red, green, and yellow are reemitted by the phosphor, which substantially absorbs ultraviolet (UV)-blue light (370–460 nm) from LED chips. Hence, the red-orange phosphor is associated with the existence of RESr2AlO5 and is surrounded by SrAl2O4: Eu2+, R3+ (R3+=Dy3+, Nd3+, or B3+) [60].
Regarding samples Eud0.15, Eun0.15, and Eur0.15, following exposure to LED, these samples exhibit blue-green phosphorescence behaviors (Fig. 1) associated with the production of SrAl2O4:Eu2+,R3+ phosphor [61].
Photoluminescence excitation and emission spectra:-
Photoluminescence spectroscopy, including fluorescence and phosphorescence, deals with the ability of the material to absorb and emit light due to electronic transitions. However, the emission process in phosphorescence involves intersystem crossing from excited singlet states to triplet states, followed by radiative relaxation to the ground state. While in fluorescence, radiative relaxation occurs directly from excited singlet states to the relevant ground states. Therefore, the phosphorescence process takes more time (10 –6 s to seconds) than that of the fluorescence process (10 − 9 to 10 –6 s). While fluorescence measurements reveal the main electronic transition, which is responsible for the emission of light, phosphorescence measurements show the material’s ability to store light energy. In the case of studying afterglow materials, both fluorescence and phosphorescence measurements are essential to understand the light emission process. Typically, phosphorescence spectra are measured with a delay time (in milliseconds) to distinguish them from fluorescence spectra and obtain pure phosphorescence spectra.
Figure 9 displays the fluorescence emission spectra of the prepared samples. For all samples, the emission spectra exhibit a broad band peaking at approximately 517 nm at the excitation wavelength of 365 nm. It is observed that the emission intensity of samples Eud0.1, Eun0.1, and Eur0.1 is higher than that of Eud0.15, Eun0.15, and Eur0.15. This may be due to the crystallization of SrAl2O4, with RESr2AlO5 as was indicated by XRD Fig. 2. As seen previously in the photograp images (Fig. 1), the complete green ring (Eu2+, B3+:SrAl2O4) is formed in this sample that surrounds the red-orange phosphor (BSrAl2O5).
Fig. 9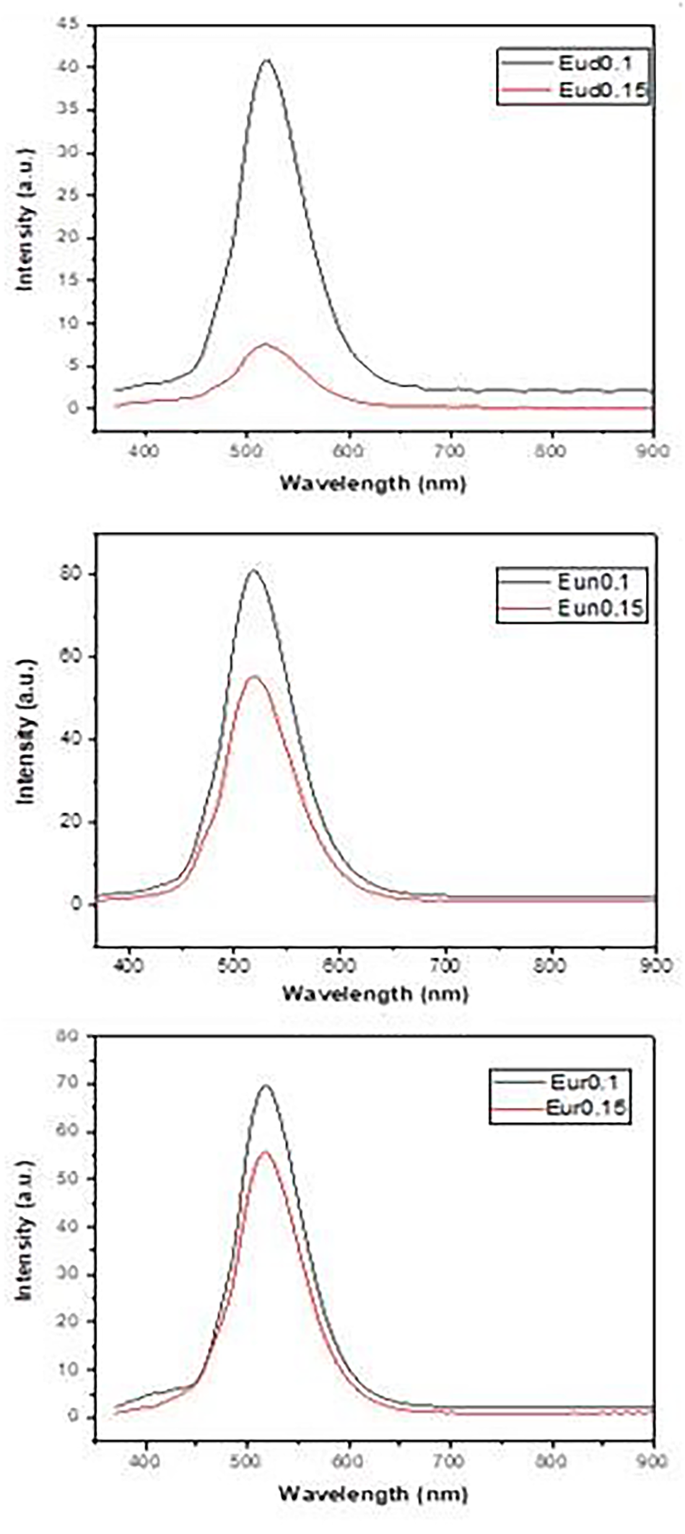
Emission spectra of the prepared samples
The excitation spectra in Fig. 10 exhibited the same manner as in the emission spectra, with a broad band peaking at about 365 nm. The excitation band is due to the electronic transition of Eu2+ ions 4f 7→4f65d1 as a result of the absorption of UV light at 365 nm [23, 62].
Fig. 10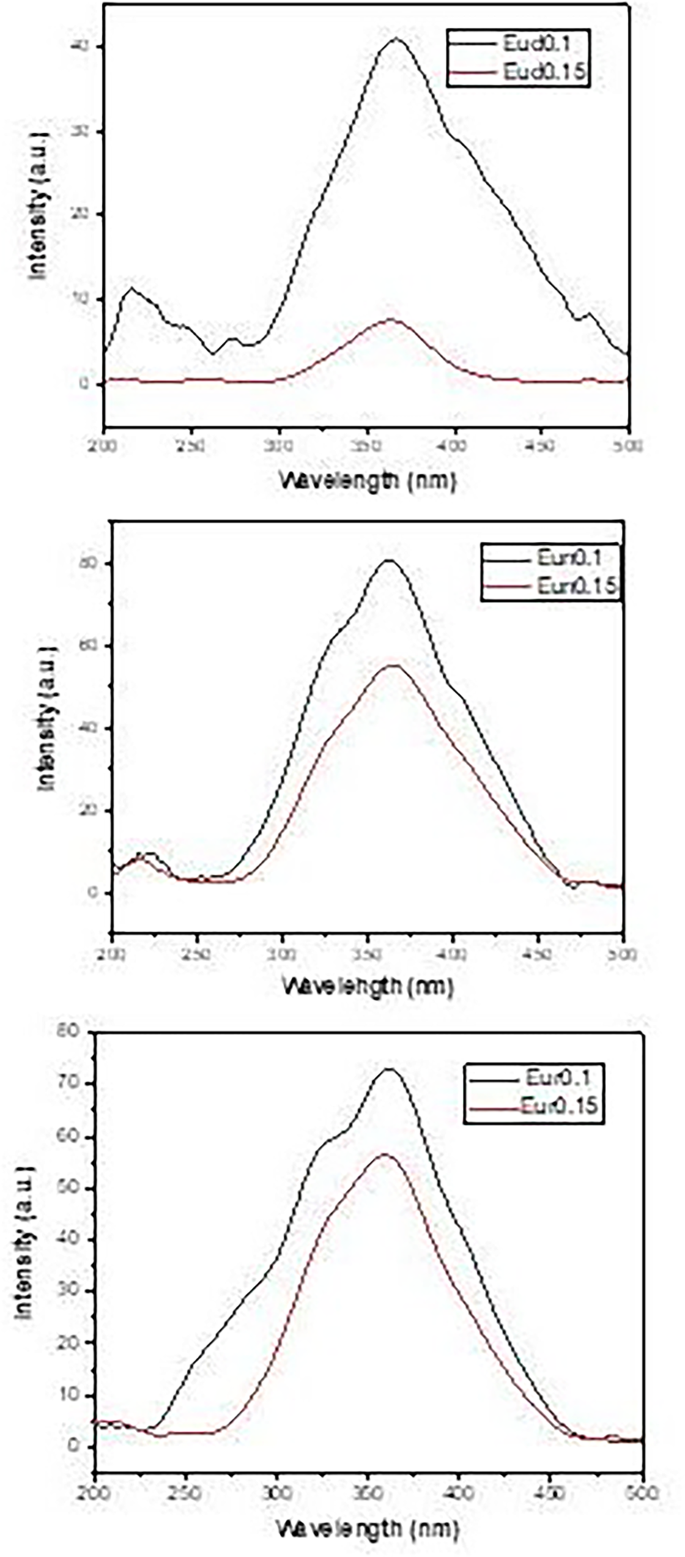
Excitation spectra opf the prepared samples
In all samples, Eu2+ ions are the luminescent emitters due to the 4f6 → 5d14f7 transition corresponding to Eu2+ ions and resulting in its green emitted color. The holes in the traps caused by the stimulation of UV light produced a lengthy afterglow. Holes are created from the 4f level to the valence band, and the electrons of Eu2+ ions in the 4f level are moved to the 5d level. A portion of the lattice’s open holes is carried to the conduction band and ensnared by dopants Dy3+, Nd3+, or B3+ hole traps. When UV radiation stops, some of the holes that the activator ions have taken from the valence ions are thermally released into the valence band and revert to the ground state of the Eu2+ ions, which causes the emission of green light. Consequently, by creating deep hole traps that lengthen the afterglow time, the Dy3+, Nd3+, or B3+ contribute significantly to the long afterglow process.
Substitution of Nd3+ or B3+ ions for Dy3+ ions caused no change in the shape of the emission peaks or their locations. Also, there was no change in the emission and excitation spectra of all the samples. The observed differences were the changes in luminescence intensity and the decay time of the afterglow curves, which indicate that the type of Dy3+, Nd3+, or B3+ ions is responsible for these changes.
Phosphorescence spectra after a 5 m sec delay time are shown in Fig. 11, which reveals the occurrence of a broad phosphorescent band at about 520 nm. The behavior of the phosphorescence intensity is nearly the same as the emission intensity, indicating that the electronic transition of Eu2+ (4f6 → 5d14f7) dominates the phosphorescence process.
Fig. 11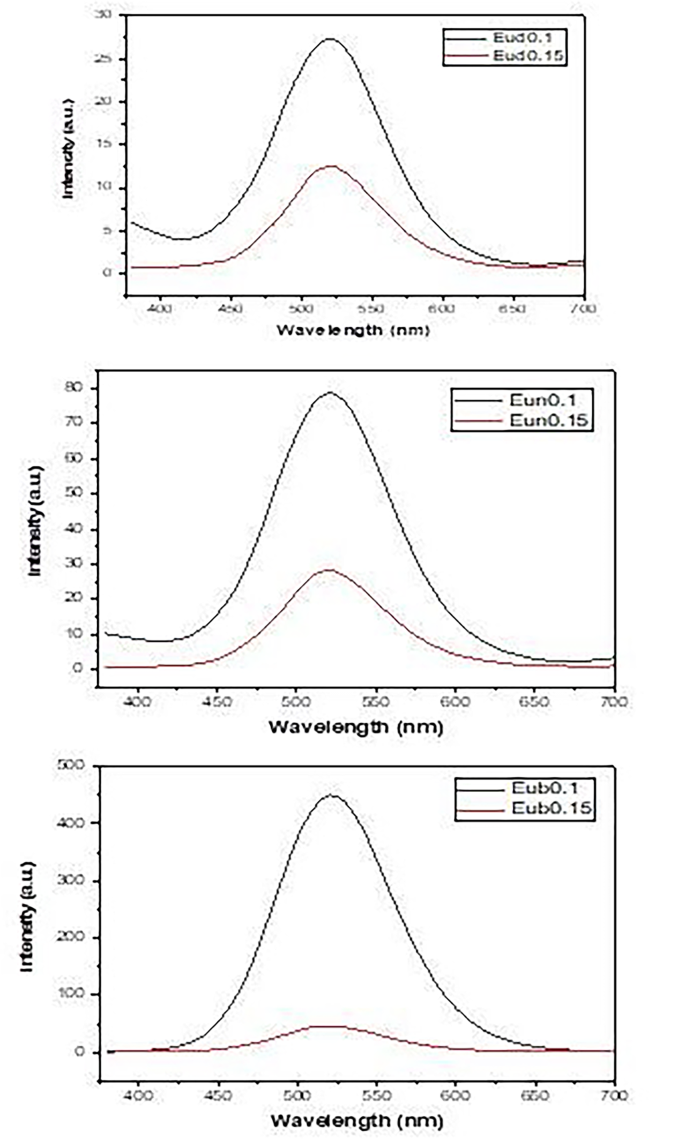
Phosphorescence spectra of samples fired under active carbon powder
Decay curves are shown in Fig. 12, which reveals the highest decay time (Table 2) values for samples containing Dy phosphor, then doped Nd and doped B in all concentrations.
Fig. 12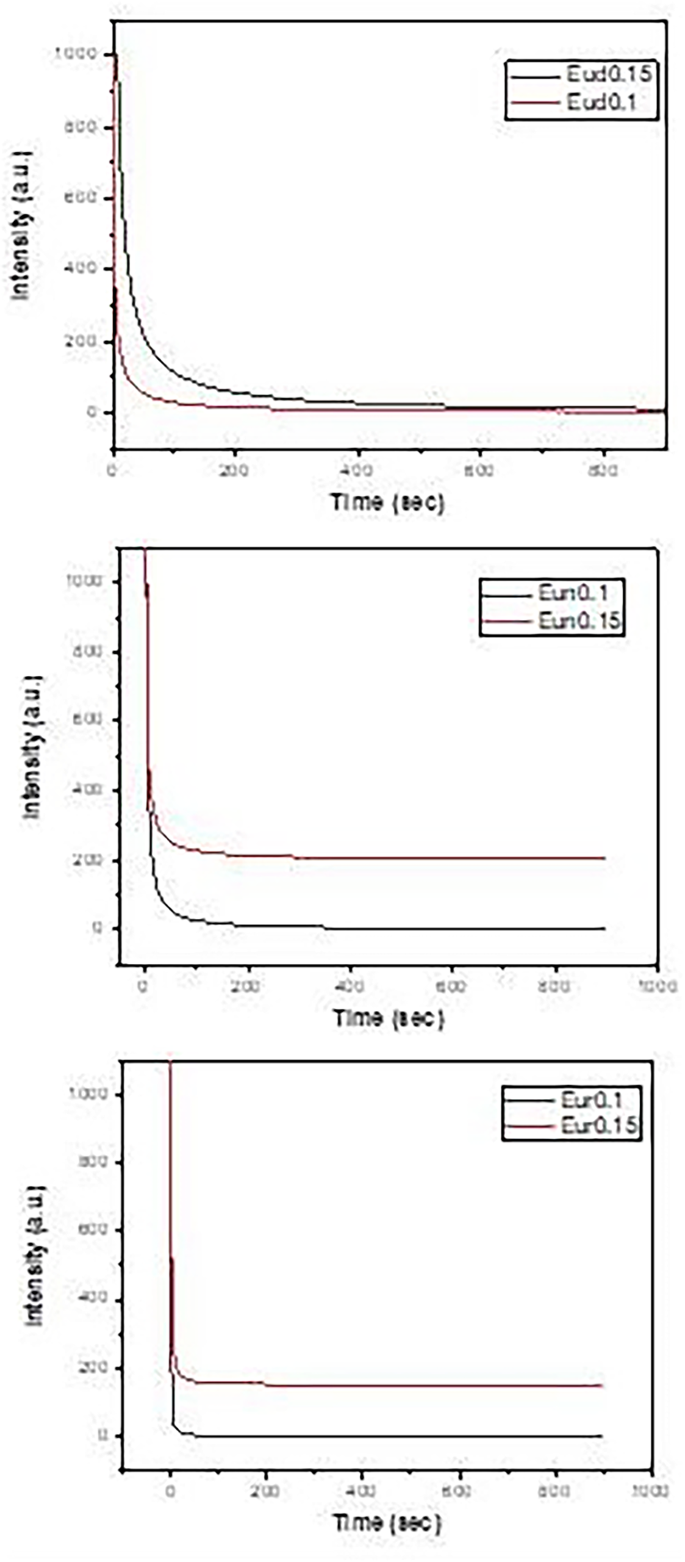
Decay curves of the prepared samples
Table 2 Lifetimes of phosphors samples fired under active carbon at 1250 °C
There are two main assumptions to explain the afterglow phenomenon of the co-doped SrAl2O4:Eu2+ phosphors. The first mechanism showed that UV irradiation induces a hole-type photoconductivity and hence suggested the existence of a hole trapping [63]. Upon UV illumination, the excitation transitions of Eu2+ 4f7 → 4f65d1 occur immediately, causing a large number of holes and electrons. The holes are transferred by the valence band and then trapped by Dy3+ ions to form Dy4+ ions. When the source of light is removed, the holes trapped by Dy3+ are thermally excited and transferred back to the excited state Eu1+ to form Eu2+, which leads to the long afterglow of the phosphors. This mechanism suggests that the long afterglow is mainly due to the trap levels and whether they were located at a suitable depth. It means that in a specific range of trap levels, the deeper trap depth can lead to a longer afterglow time. The second assumption proposed that the co-doped cation ions induce the formation of hole traps, accompanied by Sr2+ vacancies introduced according to charge compensation [64].
However, the afterglow is observed even if the co-doped cation ions are not added, which indicates that the co-doped ions are not necessarily hole traps. The hole traps are suggested to be formed by imperfections found in SrAl2O4:Eu2+. The Addition of the co-doped ions (Dy, Nd, B) will increase the Sr2+ vacancies by charge compensation. The mode of incorporation of Nd and Dy ions into the lattice is different from that of boron. Nd and Dy’s ions occupy likely Sr2+ ions sites, where their ionic radii are very close. On the other hand, boron ions occupy Al3+ ion sites and form Al-O-B bonds [65]. The present afterglow decay data showed that the samples co-doped with Dy and Nd have longer afterglow than those co-doped with boron, which is consistent with the second assumption. However, there is still the probability that the co-doped ions can act as hole traps because the afterglow process of these phosphors is a thermo-activated physical phenomenon in which charge carriers (electrons/holes) are released at well-defined temperatures characteristic of the trap depths [66]. Based on the previous discussion, the low emission intensity of SrAl2O4:Eu, Dy phosphors indicates the formation of deep hole traps by Dy3+ ions, which results in low emission intensity and also long afterglow time. In comparison, Nd3+ and B3+ ions form shallow hole traps, considering that Nd3+ ions are more efficient in the formation of deeper hole traps than B3+ ions.
In general, the Eud0.1, Eun0.1and Eur0.1 samples show improvement in emission, excitation, Phosphorescence and decay time behaviors may be due to RE is part of compound RESr2AlO5:Eu2+ (RE = Dy, Nd, B), As electron or holes may trap into a large compound which contributes to the sample’s energy-storage carrier performance [22].
It was observed that phase structure and crystallinity have a significant impact on luminescence intensity. In general, it is expected that more crystalline phosphors will be more luminescent and have fewer traps [67].
Phsosherance emission and excitation spectra of the prepared samples (Eud0.1, Eun0.1, and Eub0.1) that demonstrated long-lasting luminescent behavior, as determined by decay time results, allow it to be utilized in a variety of applications, including luminous paint, electronic instrument dial pads, writing and printing inks, automotive dials, panels, and plasma display phosphors, as well as safety indicators on emergency devices.