
Descriptive results
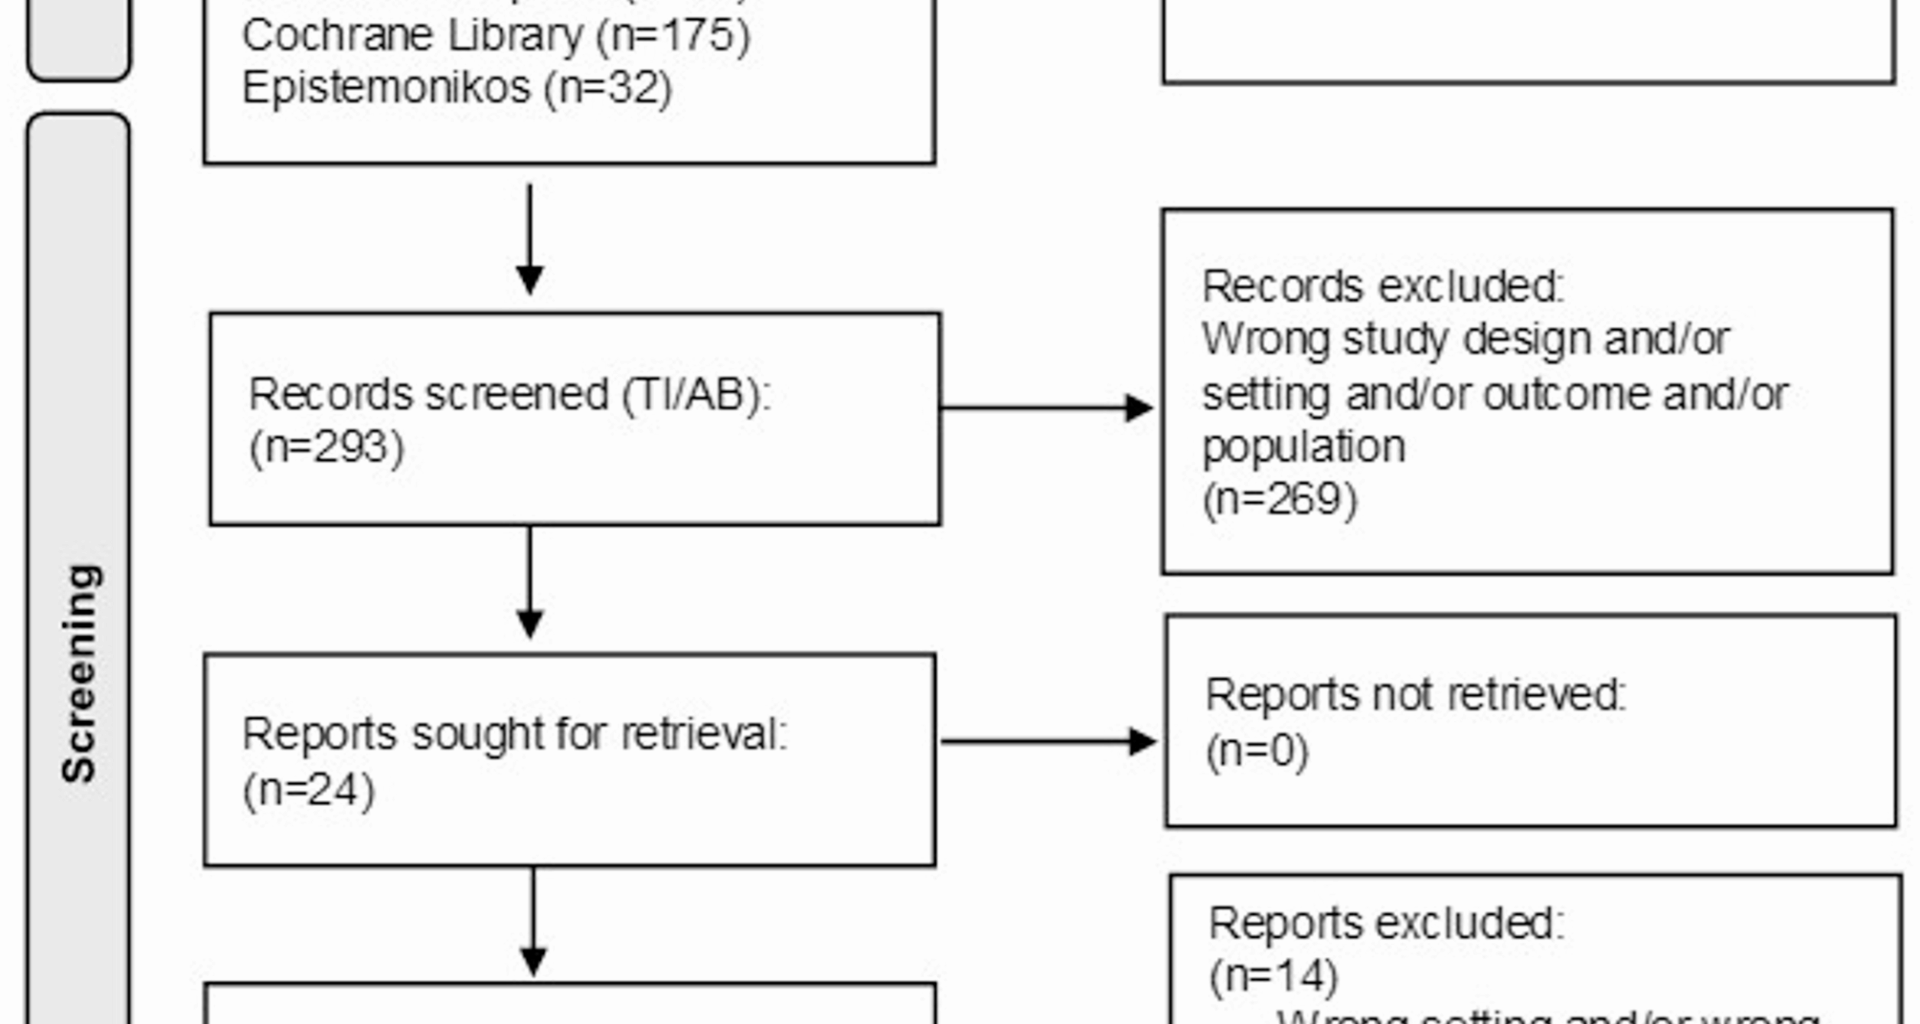
We identified 405 literature reviews with 364 primary studies in the five databases and removed 112 publications due to duplication. The reviews were published between 2012 and 2021. We excluded 269 publications after screening the titles and abstracts and reviewing the full texts of the remaining 24 publications. From these, we excluded 14 publications because of incompatible settings and/or outcomes (n = 8), study designs (n = 4), or languages other than English/German and/or the non-existence of the full text (n = 2). Finally, we included 10 reviews in a narrative synthesis. To avoid an overestimation of the results of the final sample, we also checked for duplicates at the primary study level wherever possible. The reviews primarily included quantitative studies but also some qualitative studies. We included one rapid review [30], one mixed studies review [31], one realist review [32], one systematic review and meta-analysis [33], three systematic reviews [7, 34, 35], and three scoping reviews [36,37,38].
The primary studies included in the reviews were mostly cross-sectional and longitudinal studies, focusing on natural green and blue spaces [7, 30, 31, 33,34,35,36,37]. Most of the included reviews have applied some quality appraisal. Table 2 provides an overview of the NBE categories mentioned in the studies. The JBI checklist was used to check the quality of the reviews [29]. The tool contains 11 questions regarding the quality of the included research syntheses. Two reviewers (JA, HW) scored the JBI questions independently, subsequently compared their results, and agreed on a common appraisal. We calculated the overall percentage of appraisal criteria met across all included studies, and findings were not weighted based on study quality. Table 2 shows the summary of the quality appraisal.
Table 2 Quality appraisal for included reviews using the Joanna Briggs Institute (JBI) critical appraisal toolNBE and cognitive/social health
We incorporated Cerin’s (2019) ecological model of cognitive health to classify NBE categories and examine their associations with health indicators [27]. Additionally, we introduced two new categories: ‘neighbourhood physical disorder’ and ‘wayfinding infrastructure’. Cognitive and social health were measured very heterogeneously in the primary studies of the included reviews, which was also emphasised in the reviews as a challenge to comparability. In most cases, the Mini-Mental State Examination (MMSE) was used to measure cognitive health. No standardised instruments were used for social health; instead, mainly qualitative methods on social networks or social support were conducted.
Natural green and blue spaces
Green and blue spaces include environments that are either naturally developed or artificially created, such as parks or forests (green spaces) or lakes and rivers (blue spaces) [1].
Objective associations between natural green and blue spaces and cognitive health
All included reviews reported findings regarding green and blue infrastructures [7, 30,31,32,33,34,35,36,37,38], and the results on the relationship between green and blue spaces and cognitive health can be described as consistent. Quantitative results predominantly showed positive associations between natural green/blue space and cognitive health, cognitive functioning/impairment, or dementia prevention. This applies to cross-sectional as well as longitudinal studies. Three reviews focused exclusively on the benefits of green space exposure on cognitive health, brain structure/function, and dementia prevention [30, 31, 35].
Several studies emphasised the positive effect of neighbourhood green spaces on cognitive health. For instance, Chen et al. (2021) showed that more green space, as well as the availability of parks during childhood, have positive effects on cognitive health in later life [34]. Gan et al. (2021) showed a positive association between the availability of natural environments within the neighbourhood and less cognitive decline [37]. Similarly, Kim et al. (2021) reported a positive correlation between the availability of parks in childhood and less cognitive decline at later ages [36]. In a meta-analysis, Zhao et al. (2021) pointed out positive associations between more residential greenness and better cognitive health [33]. Their analyses of cohort studies showed that more greenness resulted in a 4% decrease in the risk for cognitive impairment and dementia prevalence. However, Besser et al. (2017) reported that no association between increased neighbourhood park area and cognitive health in adults aged 45 years and older could be found [7].
Subjective experiences of PlwD and informal carers with natural green and blue spaces and social health
Qualitative findings indicated that access to natural areas (parks, walkways) can encourage PlwD to go outside, fostering social participation and providing opportunities for a sense of agency, self-worth, and independence [31]. Sturge et al. (2021) pointed out that changes in natural green/blue spaces might negatively affect PlwD by causing disorientation [38]. Keady et al. (2012) highlighted that housing impacts the well-being and quality of life for PlwD through its connection to nature and access to the outdoors, which offer sensory stimulation and social interaction opportunities [32]. Instead, Gan et al. (2021) noted that PlwD are less motivated to visit natural green and blue spaces if these include barriers [37].
In summary, both quantitative and qualitative data predominantly support the positive effects of natural green and blue spaces on cognitive and social health. However, some negative outcomes are reported, particularly concerning the motivation and orientation of PlwD in these spaces. Overall, the findings suggest a strong benefit of natural environments, though the design and accessibility of these spaces are crucial to maximising their positive impact.
Street network connectivity
Street network connectivity describes the ease or difficulty of navigating and reaching destinations within a neighbourhood. Better street network connectivity is characterised by fewer turns needed to access streets, integrated streets, mixed land use (library accessibility, sports venues, and food store availability), and fewer cul-de-sacs and dead ends [39]. Four reviews [7, 33, 36, 37] reported that better street network connectivity is associated with improved cognitive or social health.
Objective associations between street network connectivity and cognitive health
Besser et al. (2017) found street network connectivity to be positively associated with slower cognitive decline [7]. The review also emphasised an association with slower cognitive decline when there are wider footpaths and connections between streets. Another review indicated that road connectivity, combined with multipurpose facilities and pedestrian density, positively impacts cognitive health, particularly in immediate and delayed memory recall, visuospatial, construction, and language skills [36]. Zhao et al. (2021) also showed that higher street integration, combined with other NBE factors, benefits cognitive impairment and dementia prevention [33].
Subjective experiences of PlwD and informal carers with street network connectivity and social health
Qualitative findings by Gan et al. (2021) suggested that better street network connectivity leads to more frequent short outdoor walks and improved daily routine task performance [37], which are positively associated with mental well-being due to a sense of agency and social connection. Overall, the quantitative and qualitative findings suggest that enhancing street network connectivity not only facilitates easier movement within neighbourhoods but also promotes cognitive resilience and social engagement, thereby supporting healthier communities.
Mixed land use
Mixed land use describes the diversity and availability of local amenities [40]. Five reviews suggest [7, 32,33,34, 37] that mixed land use positively impacts cognitive or social health.
Objective associations between mixed land use and cognitive health
Quantitative studies by Besser et al. (2017) showed a positive association between higher land use mix and decreased odds of dementia [7]. Specifically, they found positive associations between neighbourhood availability of community centers or an increased number of blocks to community resources and a slower cognitive decline. Gan et al. (2021) also found positive associations between diverse land use, combined with the use of natural space, on cognitive health. Moreover, they showed a positive influence of accessibility to libraries and walkability in general on cognitive health [37].
Chen et al. (2021) reported positive associations of mixed land use with cognitive functioning, cognitive health, or slower cognitive decline in walkable neighbourhoods with accessible community resources [34]. In contrast, Zhao et al. (2021) found no benefits of better food store availability, library accessibility, and a land use mix for preventing cognitive impairment and dementia [33].
Subjective experiences of PlwD and informal carers with mixed land use and social health
Keady et al. (2012) and Gan et al. (2021) underlined the importance of connections to local shops and organisations in the neighbourhood of PlwD, as these facilitate social exchange and maintain independence [32, 37]. Overall, while mixed land use shows promise in enhancing cognitive and social health outcomes through improved access to amenities and community resources, further research is needed to better understand its nuanced effects across different populations and contexts.
Pedestrian and cycling infrastructure
Pedestrian and cycling infrastructure includes all pathways and bike paths within a specific area, considering factors such as quality (e.g. surface condition) and connectivity. The results of four studies [7, 33, 36, 37] predominantly suggested that there is a positive relationship between better pedestrian and cycling infrastructure and better cognitive status.
Objective associations between pedestrian and cycling infrastructure and cognitive health
Besser et al. (2017) found no association between faster cognitive decline and insufficient pedestrian infrastructure [7]. Kim et al. (2021) showed that better pedestrian infrastructure and road connectivity are associated with better maintenance of cognitive status [36]. The review of Zhao et al. (2021) identified several factors, such as the availability of more playgrounds, sports venues, food stores, libraries, higher neighbourhood walkability, and more sidewalk coverage, as preventive measures against cognitive impairment and dementia [33]. Another review identified a greater distance to cafes or post offices or a ‘poor micro-scale environment’ according to the Residential Environmental Assessment Tool (REAT) as risk factors for cognitive impairment and dementia prevalence [8].
Subjective experiences of PlwD and informal carers with pedestrian and cycling infrastructure and social health
According to Gan et al. (2021), the ability to go out for short or routine tasks without accompaniment positively influences mental well-being due to a sense of agency and social connection [37]. Additionally, walking has essential benefits for dyadic relationships (PlwD and their relatives), social exchange, and self-connections, and promoting feelings of belonging when ensuring a safe space [41]. The qualitative and quantitative findings underscore the importance of well-designed pedestrian and cycling infrastructure not only for enhancing mobility and accessibility but also for promoting cognitive health and fostering social interactions among people with MCI and PlwD.
Wayfinding infrastructure
Wayfinding infrastructure describes the available support to help individuals orient themselves in a specific area or city [42]. PlwD often struggle with orientation, and both familiar and unfamiliar environments can be challenging depending on the dementia stage [42, 43]. Three reviews examined this NBE domain (Gan et al. 2021, Keady et al. 2012, and Sturge et al. 2021). Most findings demonstrated a positive relationship between a good wayfinding infrastructure and cognitive or social health.
Objective associations between wayfinding infrastructure and cognitive health
Gan et al. (2021) noted that repaving pedestrianised shopping streets to differentiate them from typical streets and using text signage to locate public toilets are helpful for wayfinding [37].
Subjective experiences of PlwD and informal carers with wayfinding infrastructure and social health
Qualitative findings by Gan et al. (2021) indicated that anxiety or insecurity due to stressors such as noise or unexpected obstacles can reduce activity spaces and lead to social isolation [37]. Keady et al. (2012) highlighted that changes in the NBE, such as alterations in bus routes, can inhibit PlwD and lead to ‘out of place’ feelings [32]. Factors such as navigability, legibility, safety, and environmental attractiveness are crucial for PlwD to orient themselves in the neighbourhood. In general, the use of outdoor spaces is a fluid and changing experience for PlwD. Sturge et al. (2021) showed that PlwD often rely on traffic lights and pedestrian flows to feel safe in traffic situations [38]. They also prefer areas with limited traffic and clearly marked, timed, and controlled pedestrian crossings. Another important factor in the wayfinding of PlwD is that similar-looking houses or buildings make orientation difficult. In general, PlwD have more difficulties finding their way than older adults without dementia. Therefore, street signs and path directions are useful for wayfinding and maintaining independence and social connections. Overall, the availability of well-designed wayfinding infrastructure plays a crucial role in supporting cognitive health by reducing navigation challenges and enhancing confidence in familiar and unfamiliar environments alike. Furthermore, it contributes to social health by facilitating easier access to community spaces and maintaining a sense of independence and connection for PlwD and people with MCI.
Transport infrastructure
Transport infrastructure encompasses all public transport options available in a certain area. Effective public transport infrastructure is indicated by the availability of transport stops in close proximity, frequent departure times, and good connections to further public transport [44]. Overall, the findings of three reviews [7, 34, 38] suggested that the proximity of transport infrastructure is positively associated with cognitive health.
Objective associations between transport infrastructure and cognitive health
Besser et al. (2017) showed that transport infrastructure is positively correlated with slower cognitive decline when public transport stops are available [7]. The review by Chen et al. (2021) described negative associations between living closer to major roads and cognitive performance in later life [34]. However, they found positive associations between slower cognitive decline and accessible public transport, as well as good street connectivity and better cognitive health. No associations were found for several other indicators of transport infrastructure, such as cycling infrastructure, traffic safety, road tidiness, and handicap access.
Subjective experiences of PlwD and informal carers with transport infrastructure and social health
Sturge et al. (2021) pointed out that using public transportation can positively impact the self-confidence and independence of PlwD and indirectly benefit their social health [38]. However, public transport can also be stressful or scary when crowded.
In total, while transport infrastructure plays a critical role in supporting cognitive health by providing accessible and stress-free mobility options, its impact on social health among PlwD and their carers can vary depending on the quality of the transportation experience.
Density
Density refers to both population density and building density, primarily existing in urban areas [45]. Results regarding the domain density were found in four studies [7, 33, 34, 36].
Objective associations between density and cognitive health
Most studies showed negative associations between higher density and cognitive health or dementia prevalence. Besser and colleagues (2017) reported associations between density and cognitive health [7], and found in one study that worse cognitive health was related to a more natural environment within the neighbourhood area, interpreted as an indicator of lower population density. Two other studies in this review found no associations between population density and cognitive health. Chen et al. (2021) presented four studies showing positive cross-sectional associations between urbanity (higher density) and better cognitive health and various cognitive subdomains [34]. However, two studies found no association between cognitive function and higher density. Kim et al. (2021) defined density as residential density and showed four studies suggesting that limited living space increases the risk of developing dementia or MCI [36]. They also found no differences in the risk of developing dementia between older adults living in rural and urban regions. Limited activity space, particularly in economically unequal neighbourhoods, increases the risk of developing dementia. The review also showed that among people living in confined spaces, 13.9% developed Alzheimer’s Disease (AD). These proportions increased to 21% when the analysis was adjusted for age, sex, education, and race. A meta-analysis by Zhao et al. (2021) summarised 35 studies and found that living in rural areas (lower population density) was associated with a higher risk of dementia and cognitive impairment. However, the quality of the included studies was rated as low [33].
In summary, while some studies suggest a negative impact of higher density on cognitive health and dementia risk, others show mixed or even positive associations. Factors such as living space constraints and neighbourhood characteristics also play significant roles.
Neighbourhood physical disorder
Neighbourhood physical disorder, reported in two reviews [7, 34], describes factors such as vandalism, neglected buildings, and vacant land, which can lead to insecurity and feelings of being lost [46, 47].
Objective associations with neighbourhood physical disorder/ neighbourhood aesthetics and cognitive health
The quantitative results mainly showed that neighbourhood physical disorder negatively influences cognitive performance. Besser et al. (2017) reported a positive correlation between the deterioration of public spaces and faster cognitive decline [7]. Chen et al. (2021) found positive associations between poorer cognitive performance and perceived neighbourhood physical disorder [34]. They also reported that living in well-maintained neighbourhoods was associated with slower cognitive decline and better cognitive performance in old age. In addition, living in an aesthetic and pleasant neighbourhood was positively associated with better cognitive performance in old age. The review found no associations between cognitive health and objective composite measures of neighbourhood physical disorder. All in all, the reviews show that enhancing neighbourhood aesthetics and maintenance potentially contributes to better cognitive health outcomes in aging populations, highlighting the importance of urban planning and community development in promoting cognitive well-being.
The results on the NBE and cognitive or social health show some inconsistent findings, which may be explained by the multiple mediating effects of the associations between NBE and cognitive/social health. As the ‘simplified ecological model of cognitive health’ by Cerin (2019) [27] shows, there are also internal factors, such as brain and cardiovascular health or genetic impacts, that influence cognitive health that need to be considered.
Summary of evidence
Tables 3 and 4. summarise the results of the included reviews using traffic light logic, following the recommendations of the JBI (2014) [29]. In addition, one to three plus signs were added for better readability. Table 3 shows the synthesised qualitative results. The results highlighted in green (three plus signs) indicate positive effects of the individual NBE categories, and the results highlighted in yellow (two plus signs) indicate contradictory results. Results highlighted in red (one plus sign) indicate negative effects. The evidence presentation of the quantitative studies deviates slightly from the JBI recommendation, as the primary studies are not primarily intervention studies. In this case, the green color indicates that there are already significant results that show a positive association between the NBE category and cognitive health or dementia prevention. Yellow indicates that there are still no precise or predominantly contradictory results (with considerably mixed results) for an association between the NBE category and cognitive health or dementia prevention. Red indicates that there are no significant results (regardless of the directional connection).
Table 3 Summary of evidence from qualitative reviewsTable 4. Summary of evidence from quantitative reviews
It should be noted that the meaning of colours differs between qualitative and quantitative evidence, as the “red” category represents negative effects in qualitative syntheses but non-significant results in quantitative analyses. This distinction was intentionally maintained to ensure interpretative clarity within each evidence type while preserving overall visual consistency across tables.
An additional colour to display significant negative associations was not included, as these were very rare in the included reviews. According to the JBI guidance for umbrella reviews, the traffic light system is intended to provide a clear and simplified summary of the overall strength and consistency of evidence rather than to detail all possible directions of effect, which are better discussed narratively in the text. This approach avoids overemphasising findings based on limited evidence and keeps the visual summary balanced and transparent. The synthesised findings and evidence assessment column differ in their presentation due to the JBI standards. The qualitative evidence is listed by individual theses per author. The quantitative evidence is presented according to summarised findings and across authors.
Table 4 is not based on numerical values but on an overall qualitative assessment of the main conclusions and key findings.