
Ethics statement
Ethical approval was obtained from University of Gondar, School of Biomedical and Laboratory Science College of Medicine, and Health Science Ethical Review Board (SBMLS 2640/13). Permission was obtained for the samples to be used in the study [36]. Informed consent was used to request voluntary agreement from healthy controls.
Study design, site, and population
A cross-sectional study was conducted using serum samples from AFI patients at UoGCSH, Amhara National Regional State, Ethiopia. The samples were collected from adults (> 15 years) diagnosed with AFI as defined by the inclusion criteria (axillary temperature of at least 37.5 °C and symptoms lasting no more than 7 days) [36]. Pregnant women, patients with chronic diseases such as diabetes mellitus and hypertension, patients with acute injury or trauma, and patients who had taken antibiotics within 2 weeks before sample collection were excluded. Each serum sample was tested via two lateral flow POCTs (qualitative and semiquantitative PCT measurement) and one quantitative semiautomatic POCT. Additional newly collected control samples from apparently healthy volunteers (n = 25) were used to characterize PCT levels in the normal population in the study area. Owing to the absence of a reliable gold standard to verify bacterial infections and the unavailability of standard PCT references, a composite reference was created by integrating the results from all three testing methods. A sample that tested positive for all tests, was considered a positive reference, and other results were considered negative according to this reference test.
Samples and study procedures
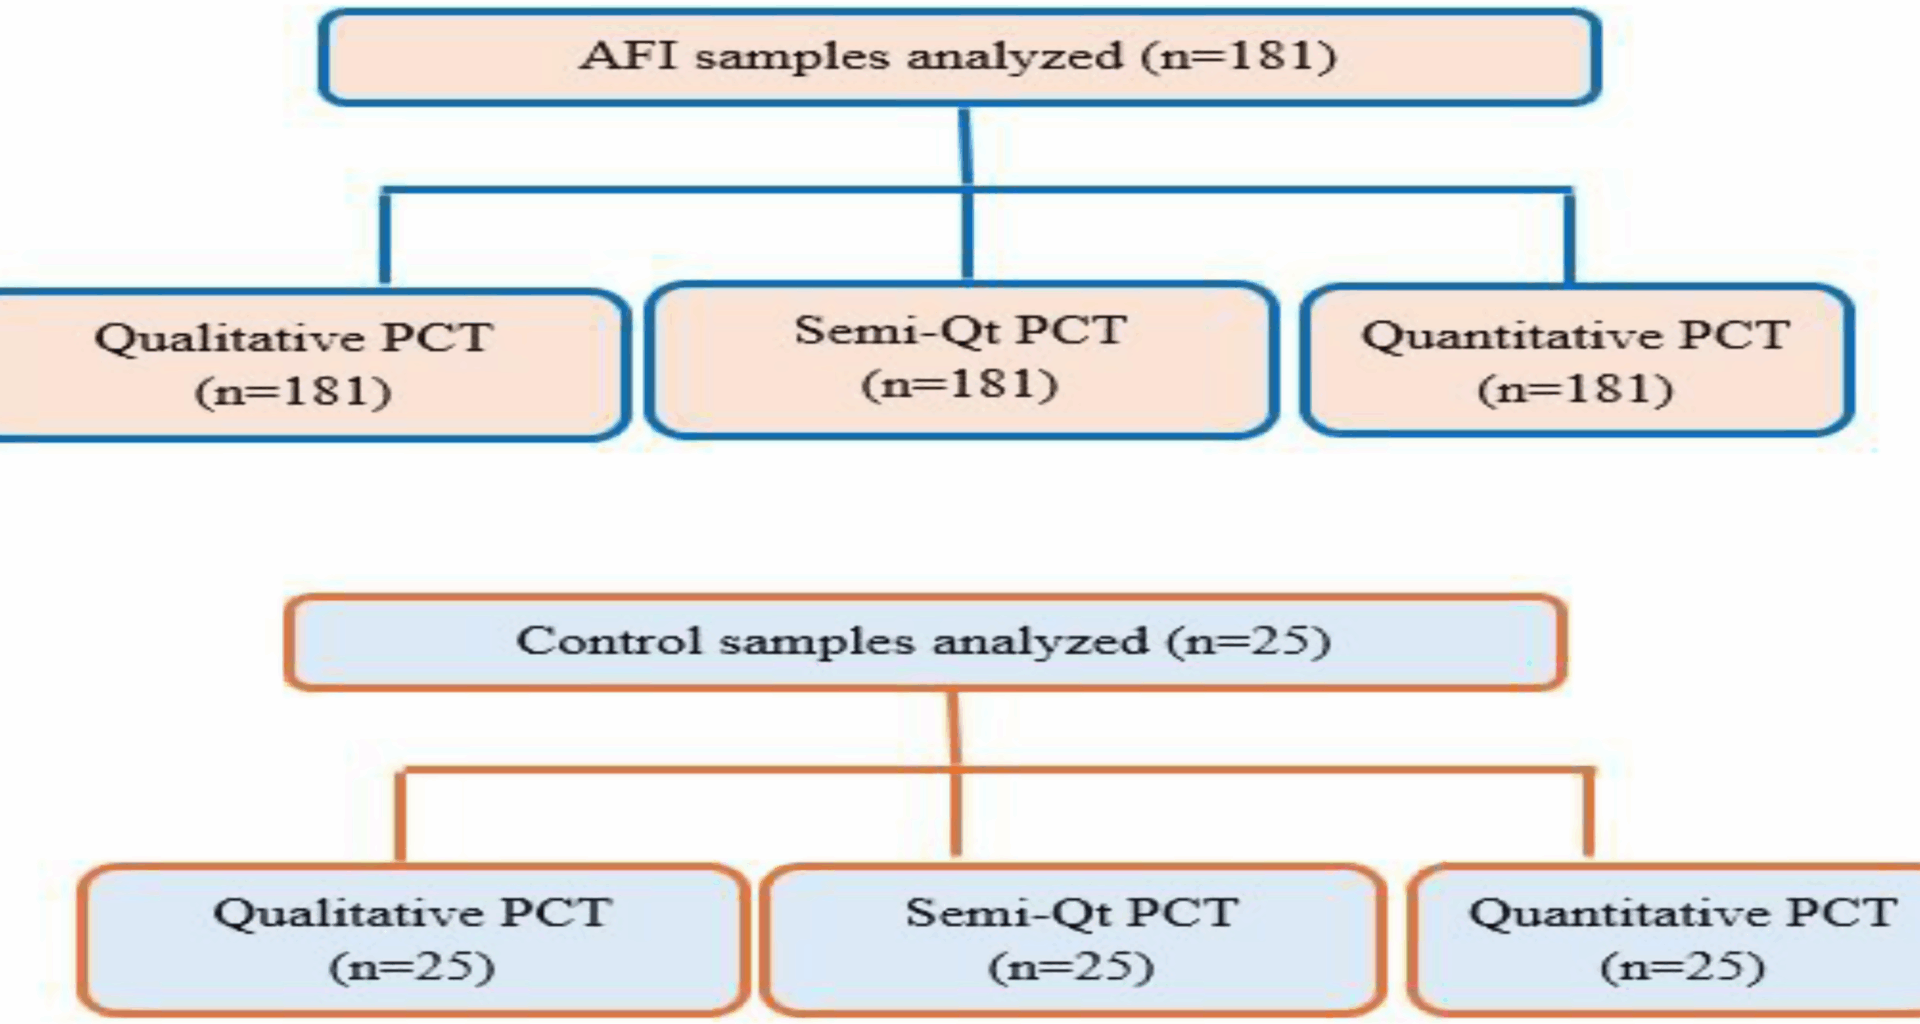
A total of 181 stored serum samples were used. These samples originated from a study on the etiology of acute fever carried out at UoGCSH and were collected in the 2018/19 project [36]. The samples were kept at -80 °C for one year. To ensure the integrity of stored samples, the temperature logs, functionality of the alarm system, and components of the freezer were monitored daily. Since this study utilized leftover aliquots of serum from a previous set of 200 samples, sample volume was used as an inclusion criterion for the current study, and 19 samples with insufficient volume to perform all three PCT tests were excluded. The appropriateness of the sample size was checked using power analysis and sample size (PASS) software version 25.0.2 for diagnostic accuracy studies. The calculation considered 80% power, 0.05 type I error rate, and the prevalence of the disease under investigation. The prevalence of bacterial proportion among AFI cases (5%) was taken from an etiologic study done in the study area [36]. Using this method, the minimum sample size required for the study was 163. Batch testing was subsequently performed to prevent frequent freeze-thaw cycles. For qualitative and semiquantitative rapid diagnostic tests (RDTs), two independent observers who were blinded to the microbiologic results from the original study read results. A total of 10 bacterial isolates were identified from the microbiologic results. Eight isolates, including 4 Staphylococcus aureus, 2 Klebsiella pneumoniae, 1 Micrococcus spp., and 1 Enterobacter cloacae were detected through aerobic culture. Additionally, 2 Rickettsia typhus isolates were identified via PCR. The samples were tested for malaria and viral infections, and a total of 21 malaria infections were detected by microscopy and/or rapid diagnostic test (RDT). A total of 14 acute dengue virus (DENV) infections were identified using NS1 antigen testing, IgM ELISA, or RT-qPCR. Photos of each RDT result were also captured to be used as a consensus for disagreements. The flow diagram/test strategy for each laboratory testing method is shown in Fig. 1.
Diagnosis of bacterial infectionqPCR for Rickettsia and Borrelia species
DNA extraction was performed from 300 µL of whole blood by using a Maxwell 16 extraction device, and qPCR was carried out to detect typhus group (TG), scrub typhus group (STG), and Borrelia spp. The qPCR protocols used were described in TG [37], STG [38], and Borrelia spp [39]. qPCR targeting human hemoglobin-beta (HBB) was performed to assess the efficiency of DNA extraction and to assess its inhibition ability as described previously [40].
Blood culture
Aerobic blood culture was performed using 8–10 ml of blood per bottle in two bottles. The blood culture bottles were maintained at an incubation temperature of 37 °C for 7 days. Following visual signs of bacterial growth (gas production, hemolysis, and turbidity), Gram stain and subculturing procedures were performed to identify the bacteria [36]. The growth of bacteria, including Corynebacterium species, Cutibacterium acnes, Micrococcus species, coagulase-negative staphylococci, and Bacillus species, is considered a contaminant [41].
Fig. 1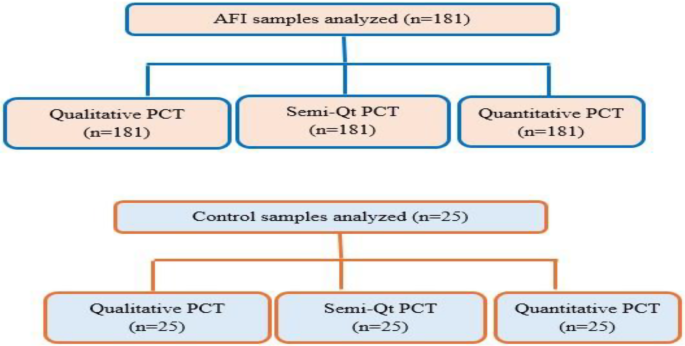
Overview of the flow chart for the laboratory test methods used during the study. AFI: acute febrile illness, PCT: procalcitonin, Semi-Qt: semiquantitative
Procalcitonin laboratory testsQualitative procalcitonin test
Serum PCT levels were measured via the Bio panda PCT Rapid Test (Biopanda, England). This test is a novel test method based on a lateral flow chromatographic immunoassay for the qualitative detection of PCT from 25 µl of blood plasma or serum [42]. The test region is precoated with an anti-PCT antibody and PCT in the sample reacts with this antibody to produce a red line. The red line indicates a positive result (PCT ≥ 1 ng/ml), whereas its absence indicates a negative result (PCT < 1 ng/ml), according to the manufacturer.
Semiquantitative procalcitonin test
Serum PCT levels were measured semiquantitatively via the NTBIO® Procalcitonin (PCT) Rapid Test Kit (Ntbio Diagnostics, Canada). PCT-specific monoclonal antibodies are conjugated with colloidal gold on the conjugate pad while another set is immobilized on the test line region. Eighty microliters of serum is added to the sample pad, where PCT interacts with the colloidal gold-conjugated antibodies and travels toward the test window, where it is captured by immobilized antibodies, resulting in the formation of a visible red band at the test regions (T1, T2, and T3). The line on T3 corresponds to PCT between 0.5 and 2.0 ng/ml, the line on both T2 and T3 correspond to PCT 2.0–10.0 ng/ml, and the line on (T1, T2, T3), corresponds to PCT > 10 ng/ml. The positive cut-off was 0.5 ng/ml. Thus, the appearance of a red line at one or more test regions indicates positive results, whereas their absence indicates a negative result. A control line is included to control the internal process [43].
Quantitative procalcitonin test
A Bio panda PCT FIA (fluorescence immunoassay) rapid test cassette (Bio panda, England) was used to detect PCT via a fluorescence immunoassay. Briefly, 50 µl of serum was added, and the sample moved through the strip from the sample pad to the absorbent pad. PCT in the sample will attach to anti-PCT antibodies conjugated with fluorescent microspheres. The complex will be captured by the capture antibodies coated on the nitrocellulose membrane (test line). The PCT concentration in the sample is directly proportional to the fluorescence signal intensity captured on the T line. The cut-off value for this test method was 0.5 ng/ml. According to the fluorescence intensity of the test and product standard curve, the concentration of PCT in the sample can be calculated via the Bio Panda Fluorescence Immunoassay Analyser to determine the PCT concentration in the sample according to the manufacturer’s instructions [44].
Data analysis
Analysis was performed via SPSS version 26 and Graphpad prism 5. Descriptive data were presented as frequency and percentages. Diagnostic agreements between PCT test methods and the reference test were evaluated using kappa statistics. The chi-square test was used to analyse categorical variables for PCT outcomes. The sensitivity and specificity of the PCT test methods were calculated using the composite test as a reference. Receiver operating characteristic (ROC) curves were plotted, and the accuracy of each test method in predicting bacterial infection was evaluated by calculating the area under the ROC curves. In terms of test accuracy, areas under the curve (AUCs) of > 0.9 were considered excellent; 0.8–0.9, very good; 0.7–0.8, good; 0.6–0.7, average; and < 0.6, poor [45]. P-values ≤ 0.05 were considered statistically significant.