
MALDI-TOF MS analysis showed lung deposition and distribution of BLM after IN administration
To evaluate the relevance of the IN administration route for inducing IPF, 6 twelve-week-old C57BL/6 J male mice received a single IN instillation of BLM at 5 mg/kg in 50 µl. Quantification of BLM in murine biological tissue was performed after MALDI-TOF calibration with the same BLM solution used for the treatment.
Figure 1A shows that the BLM signal intensity follows a linear trend in the concentration range from 0.01 to 1 µg/µl, also confirming that there is no reduction in the BLM signal in the presence of biological tissue (lung). The spectrum confirmed a 90% purity of the BLM solution used for treatment (Fig. 1A – lower panel).
Fig. 1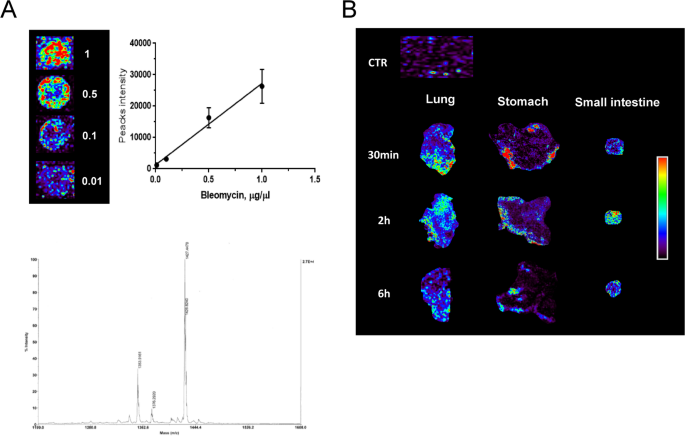
MALDI-TOF images of BLM distribution in mouse biological tissues. A Linear regression obtained with different concentrations of BLM (1, 0.5, 0.1, 0.01 µg/µl) spotted on CTR lung tissue section and acquired with the same conditions used for the tissue sections (upper panel). Representative spectrum with the indication of the molecular weight of the BLM solution (lower panel). B Representative images of BLM distribution in the mouse lung, stomach, and small intestine at different time points after treatment. The colored bar on the side indicates the concentration of BLM in the different biological tissues: blue for the lowest concentration, red for the highest concentration. The biological tissue background of the saline-treated mouse is indicated as CTR
Tissue from saline-treated control animals exhibited the same background value as shown in the CTR image. MALDI imaging demonstrated that BLM reached the lung following IN instillation. 30 min post-administration, a detectable drug signal was already present in the peripheral lung regions. By 2 h, the signal had diffused throughout the lung parenchyma. Detectable levels of BLM persisted within the lung up to 6 h post-administration. Analysis of gastrointestinal tissue revealed the early presence of BLM in the stomach at 30 min. In contrast, the small intestine showed a delayed kinetic profile, with predominant BLM signal emerging at 2 h post-instillation. Notably, both the stomach and small intestine exhibited no diffuse signal at the final time point (Fig. 1B).
Poorly invasive intranasal administration of BLM induced a reliable induction of IPF in C57BL/6 J-treated mice
The study was conducted in 20 twelve-week-old C57BL/6 J male mice receiving a single IN instillation of BLM (5 mg/kg) or 4 with the same volume of sterile saline solution under ketamine/medetomidine anesthesia. BLM directly penetrating from the nostrils and rapidly moving through the larynx, tracheal duct, and bronchus was able to deeply impact, inducing a weight loss of 30% in the first two weeks, followed by slow weight recovery (Fig. 2A, B). Since BLM-treated animals also showed typical signs of general distress, such as marked piloerection, hunched posture, and inactivity, more specific parameters ascribable to pulmonary deficit were evaluated by plethysmography analyses (Fig. 2C-J). In BLM-treated mice, the Ti exhibited a significant gradual increase following administration, consistently surpassing that of the control group throughout the study period (Fig. 2C). Fibrotic mice showed a significant increase in Te by day 7 post-treatment, which subsequently decreased gradually to levels comparable to the controls by day 21 (Fig. 2D). BLM demonstrated a depressive effect on the chrono component of respiratory drive, evidenced by a persistent and gradual increase in Ti, accompanied by a rapid rise in Te, and subsequent normalization of the expiratory cycle. Interestingly, BLM-treated animals exhibited a marked increase in Vt from 0.16 to 0.28 by day 7 (Fig. 2E), accompanied by a similar trend in VE (Fig. 2F). This increase may be attributed to prolonged Ti and/or heightened breathing effort caused by BLM-induced acute lung damage. As expected, the RR decreased in the BLM-treated mice, persistently maintaining a significantly lower level compared to the controls (Fig. 2G). This reduction is primarily due to changes in lung mechanics and compensatory adjustments. It clarifies the deep association between the three parameters and their reliability in elucidating a respiratory discomfort typical of IPF. In Fig. 2 (H-J), the trends of Ti/Te, PIF, and PEF showed no differences between the two groups. This outcome was expected, as these parameters typically change in the presence of major airway obstruction [29]. In IPF, airway involvement occurs primarily at the level of small airways, with evidence of air trapping when going from functional residual capacity to residual volume [30, 31].
Fig. 2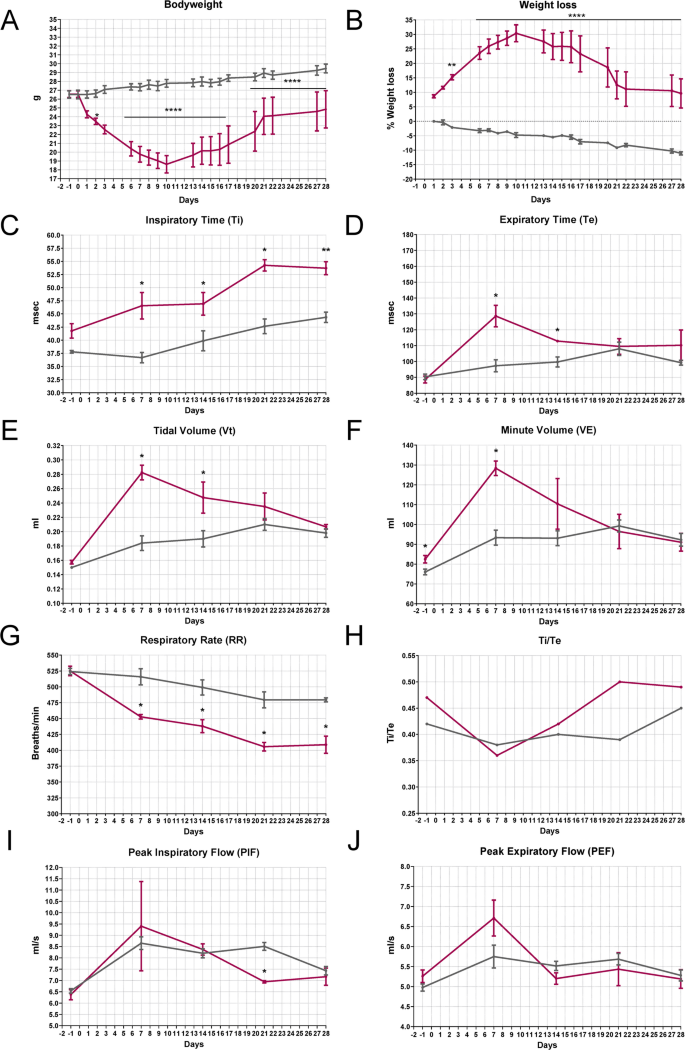
Health status in BLM-induced lung injury mouse model—Plethysmography (IN—5 mg/kg). A Bodyweight and B) weight loss in C57BL/6 J mice treated via single IN administration with BLM (red line) or vehicle (grey line). The data were analyzed using Two-Way ANOVA followed by Šidák’s test. *p ≤ 0.05, **p ≤ 0.01, ****p ≤ 0.0001. C-J) Effect of BLM on Ti (msec), Te (msec), Vt (ml), VE (ml), RR (breaths/min), Ti/Te, PIF (ml/s), and PEF (ml/s) in C57BL/6 J mice. Control animals are represented by the grey line (n = 5); BLM-treated animals are represented by the red line (n = 4). Data are reported as mean ± SE. The data were analyzed using the non-parametric Mann–Whitney U test comparing the parameters with the CTR group at each time point, *p ≤ 0.05, **p ≤ 0.01
A deep investigation of lung tissues at different time points has been undertaken to make a correlation between clinical and pathological features characterizing IPF models. Histological evaluation by H&E staining revealed a slight to moderate infiltration of inflammatory cells, including macrophages and neutrophils, at 7 days post-instillation, indicating an initial lung injury and acute inflammation (Fig. 3A). During disease progression, a rapid infiltration of cells into the lung parenchyma is observed. This infiltration did not present a homogeneous diffusion but is rather characterized by areas of high infiltration, interspersed with areas in which the cytoarchitecture is maintained. This pattern of alteration is consistent with the BLM model already described and also recapitulates some aspects of acute inflammation that can be detected by radio-diagnostic in patients. Over time, despite no repeated BLM inhalations, the migration of circulating cells into the lungs increases, peaking between days 14–21 post-treatment (Fig. 3A, H&E panel—arrows). At the end of the follow-up, at 28 days after BLM instillation, the lung parenchyma appears less congested, which is consistent with the type of insult and with the high capacity to respond in young animals.
Fig. 3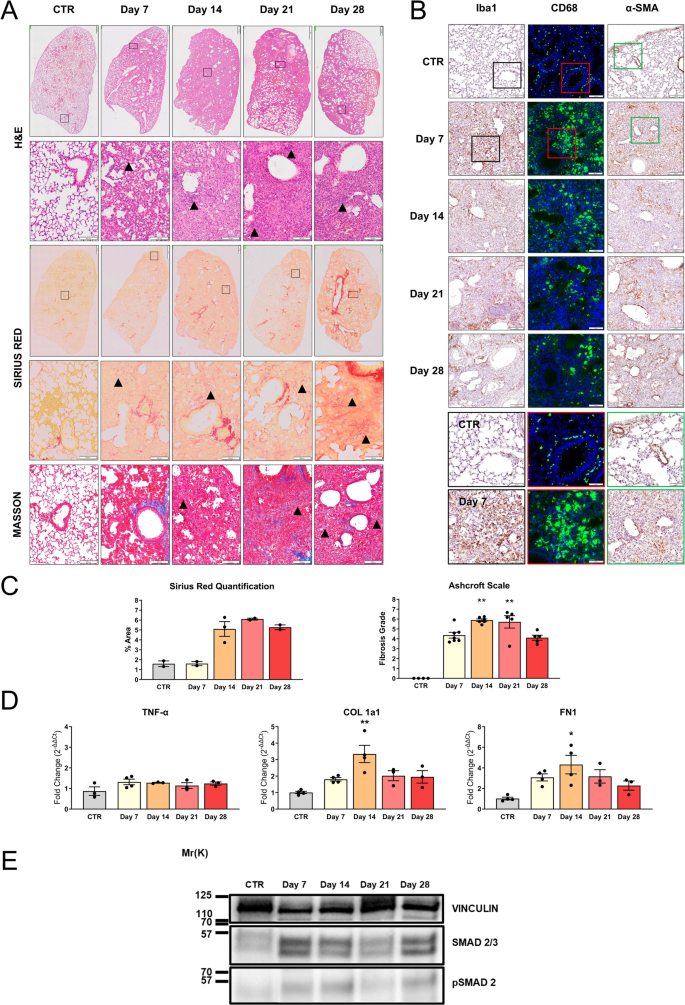
Histopathological characterization in BLM-treated animals (IN—5 mg/kg). A) Histopathological evaluation by H&E staining (upper panel), Sirius Red staining (middle panel), and Masson’s trichrome (lower panel) of lungs of vehicle mice (CTR) or treated with BLM after a single IN administration. Representative images of lung sections of animals sacrificed at 7, 14, 21, and 28 days after the treatment are reported. Scale bar = 500 µm (upper panel) – 100 µm (lower panels). B) IHC for Iba1 (left panel), CD68 (green—middle panel), and α-SMA staining (right panel) of lungs of CTR or treated with BLM. Representative images of lung sections of animals sacrificed at 7, 14, 21, and 28 days after the treatment are reported, scale bar = 100 µm. The boxed areas (Iba1 black, CD68 red, α-SMA green) in CTR and day 7 sections are shown at higher magnification in the right panel, scale bar = 50 µm. C) Histopathological quantification of Sirius Red staining in lung section (left graph) and representation of Ashcroft scale grade (right graph) obtained by Masson’s trichrome analysis of lungs of CTR or treated with BLM. Data are reported as mean ± SE. The data were analyzed by Kruskal–Wallis test followed by Dunn’s test. Significant differences compared to the CTR are reported, **p ≤ 0.01. D) mRNA expression of TNF-α, COL 1a1, and FN1 was evaluated by RT-qPCR in the lungs of mice (n = 3 per group) treated with BLM and sacrificed at different time points. Genes were normalized on β-ACT, and the 2−ΔΔCt method was employed for relative quantification on an external calibrator. Data are reported as mean ± SE and were analyzed with Kruskal–Wallis test followed by Dunn’s test. Significant differences compared to the CTR are reported, *p ≤ 0.05, **p ≤ 0.01. E) SMAD 2/3 and pSMAD 2 expression in the lungs from CTR mouse at days 7, 14, 21, and 28 of treatment obtained with WB
To better characterize the cellular composition and lung infiltrates, immunohistochemical analysis for Iba1, a marker of alveolar, interstitial, and circulating macrophages, and CD68, a marker of macrophage lysosomes, was performed. Macrophage infiltration into the lungs was significantly greater in the BLM group as compared to the controls, at 7, 14, and 21 days (Fig. 3B). Notably, positive cells for both macrophage markers showed an irregular shape, indicating their activated state compared to the round shape in the control group. We proceeded to investigate the alveolar fibrosis with two markers, Sirius Red and Masson’s trichrome, on serial sections (Fig. 3A). Both stainings showed severe expanded alveolar and interstitial fibrosis and abnormal collagen deposition. PF and disruption of normal lung architecture occurred particularly from 14 to 28 days (Fig. 3A—Sirius Red panel—arrows). Masson’s trichrome distinguishes between pre-existing collagen fibers (in dark blue) from those in neoformation (in light blue). Two different quantitative parameters were analyzed using ImageJ software to assess the extent of fibrosis: collagen deposition and the percentage of positive Sirius Red staining. As shown in Fig. 3C, the collagen deposition quantification revealed no difference at 7 days compared to the control group. This confirmed that the inflammatory phase occurs in the first week post BLM administration, where ECM is not yet highly produced. From days 14 to 28, an accumulation was observed in the lungs, reaching a peak signal at 21 days following BLM administration. Thus, between 7 and 14 days, a transition phase characterized by fibroproliferation, in which mesenchymal, inflammatory, and epithelial cells activate fibrotic repair pathways, and established fibrosis occurs at 3 weeks post-induction. After 28 days, the fibrotic changes slightly decreased (Fig. 3C). Since collagen deposition indicates increased stiffness in the ECM, remodeling of the lung architecture, and deterioration of lung functions [29], we considered correlating these findings with a parameter of lung damage through the Ashcroft scale. It assigns different fibrosis scores by evaluating histological sections stained with Masson’s trichrome. As reported in Fig. 3C, analysis of the degree of fibrosis of lung sections of control animals showed a predominantly normal lung architecture. At 7 days, a strong increase in score was noted with mild fibrotic changes, alveolar septa with nodular formations, and single fibrotic masses. PF, with large contiguous confluent fibrotic masses, was most evident between 14 and 21 days after BLM administration and became less severe at 28 days.
Myofibroblasts, possessing contractile properties and expressing α-SMA, play a pivotal role in excessive collagen deposition and tissue remodeling [2, 32]. Thus, histological analysis of lung sections from BLM-treated mice revealed extensive α-SMA expression at all time points, suggesting strong fibroproliferation and the presence of collagen-producing areas. In control lungs, the expression of α-SMA was found exclusively around blood vessels (Fig. 3B).
To complete the BLM animal model characterization, gene expression analysis was conducted. Tumor necrosis factor alpha (TNF-α), an inflammatory cytokine also important in the initiation of fibrotic changes, has been tested. As illustrated in Fig. 3D, no significant up-regulation of this inflammatory gene was detected. Regarding the key fibrotic markers, collagen 1a1 (COL 1a1) and fibronectin 1 (FN1) [2, 33], crucial in ECM composition, were also assessed (Fig. 3D). In this context, a diverse gene expression modulation pattern emerges. On day 7 post-administration, both genes showed a slight increase in expression compared to the untreated group, indicating a response to alveolar damage stimuli. At 14 days post-administration, a significant peak was observed and corresponds to the transition to the fibrotic phase characterized by fibroproliferation and ECM synthesis. This signal tended to decrease in subsequent time points. Then, a partial restoration to the physiological conditions occurred (21–28 days). Furthermore, WB analysis of total lung protein lysates from mice under each experimental condition revealed that the expression of SMAD 2/3, a marker of TGF-β1 pathway activation and indicative of a pro-fibrotic stimulus, was increased as phosphorylated SMAD 2 (pSMAD 2) starting from day 7 post-treatment. The increase was further enhanced at day 14, and then remained stably elevated, though slightly increased compared to control, at days 21 and 28 in mice treated with 5 mg/kg BLM (Fig. 3E).
BLM dose reduction does not alter the IPF induction but reduces the animal distress of treated animals
To adhere to the principle of minimizing distress and the number of animals required for a statistically reliable sample, we aimed to identify a lower dose that can recapitulate the hallmark characteristics of the most common animal model of PF, while being less invasive compared to IT BLM administration. The data reported in this paragraph refers to the study with a single IN dose of BLM 3 mg/kg. The treatment induced a maximum weight loss of 25% in the first two weeks, followed by slow weight recovery (Fig. 4A, B). Other signs of distress in BLM-treated mice included mild piloerection, labored breathing, and decreased activity, but they maintained interaction with the environment and cage mates. The macroscopic analysis of the lungs in BLM-treated mice revealed scattered lesions within regions that appeared normal, while dark lesion areas were visible across multiple lobes, bilaterally. Plethysmography data showed that BLM-treated mice (orange line) exhibited a statistically significant increase in Ti after 7 days of treatment, along with a significant reduction in RR and an increase in Vt (Fig. 4C, E, G). These results suggest the onset of acute lung injury, characterized by increased respiratory drive and respiratory effort, which resulted in a higher Vt due to relatively preserved lung compliance, similar to the soft exudative phase of lung injury. By 21 days after low-dose BLM administration, most parameters (Ti, Te, VE, PEF, RR, Ti/Te) indicated partial recovery of lung function in treated mice. The trend toward reduced inspiratory capacity and Vt, even if not statistically significant, suggests the early development of a restrictive ventilatory pattern consistent with reduced lung compliance. This observation aligns with the pathophysiological changes seen in the early stages of PF, where lung stiffening due to parenchymal remodeling limits alveolar expansion. These subtle yet clinically relevant findings indicate the onset of structural changes in the lung parenchyma, which are sufficient to alter normal respiratory mechanics. Such changes could underscore the transition from acute lung injury with relatively preserved compliance to a more chronic, fibrotic phase characterized by restrictive physiology.
Fig. 4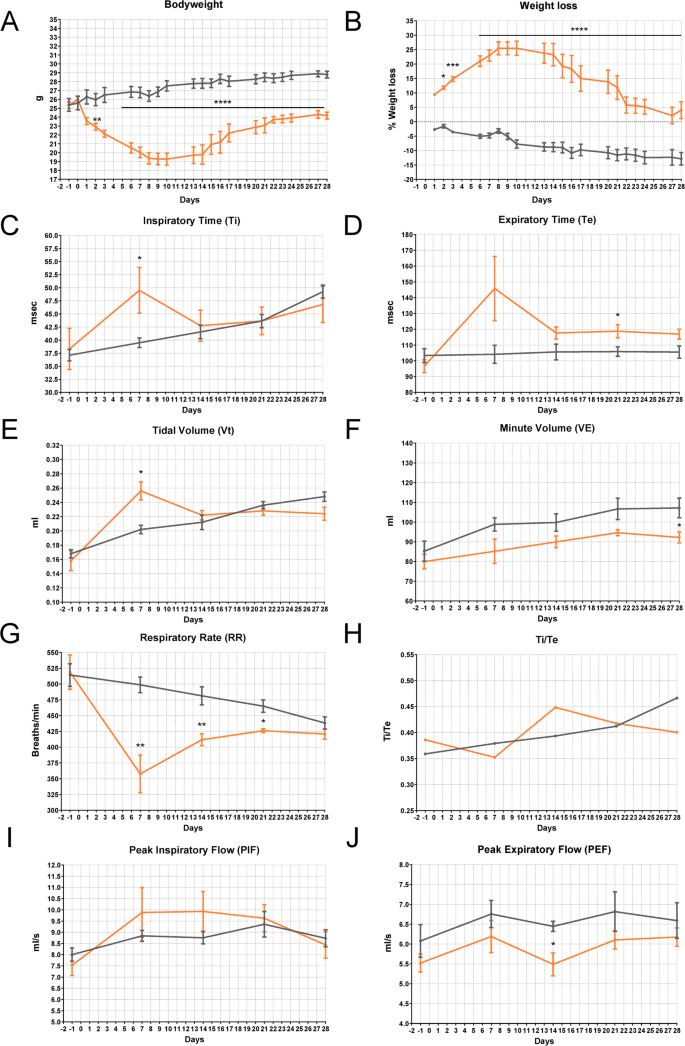
Health status in BLM-induced lung injury mouse model—Plethysmography (IN—3 mg/kg). A Bodyweight and B) weight loss in C57BL/6 J mice treated via single IN administration with BLM (orange line) or vehicle (grey line). The data were analyzed using Two-Way ANOVA followed by Šidák’s test. *p ≤ 0.05, **p ≤ 0.01, ***p ≤ 0.001, ****p ≤ 0.0001. C-J Effect of BLM on Ti (msec), Te (msec), Vt (ml), VE (ml), RR (breaths/min), Ti/Te, PIF (ml/s), and PEF (ml/s) in C57BL/6 J mice. Control animals are represented by the grey line (n = 5); BLM-treated animals are represented by the orange line (n = 5). Data are reported as mean ± SE. The data were analyzed using the nonparametric Mann–Whitney U test comparing the parameters with the CTR group at each time point, *p ≤ 0.05, **p ≤ 0.01
Histopathology revealed at 7 days post-treatment, inflammatory cell infiltrates that persisted even in the latter time points, as highlighted in H&E sections (arrows) shown in Fig. 5A. This inflammation was constantly detected throughout the disease progression, involving the entire lung parenchyma from days 14 to 21 after BLM administration, not significantly differing from that observed in animals treated with the higher dose. The Sirius Red staining and its quantification (Fig. 5A, C) showed notable fibrosis at 21 days post-instillation. The percentage of Sirius Red-positive area was similar to that observed in animals treated with a higher dose of BLM (Fig. 3C). As expected at 28 days, the fibrotic changes tend to resolve and improve toward a more normal state of the lung parenchyma. This phenomenon is well-documented in the literature and represents one of the main differences compared to the human pathology, where PF typically does not resolve [18, 34]. Regarding the key factors involved in the inflammatory and fibrotic processes, a similar pattern was observed across all markers analyzed by immunohistochemistry (Fig. 5B) and histopathological quantification at both doses (see S.I. Figure S1A, B).
Fig. 5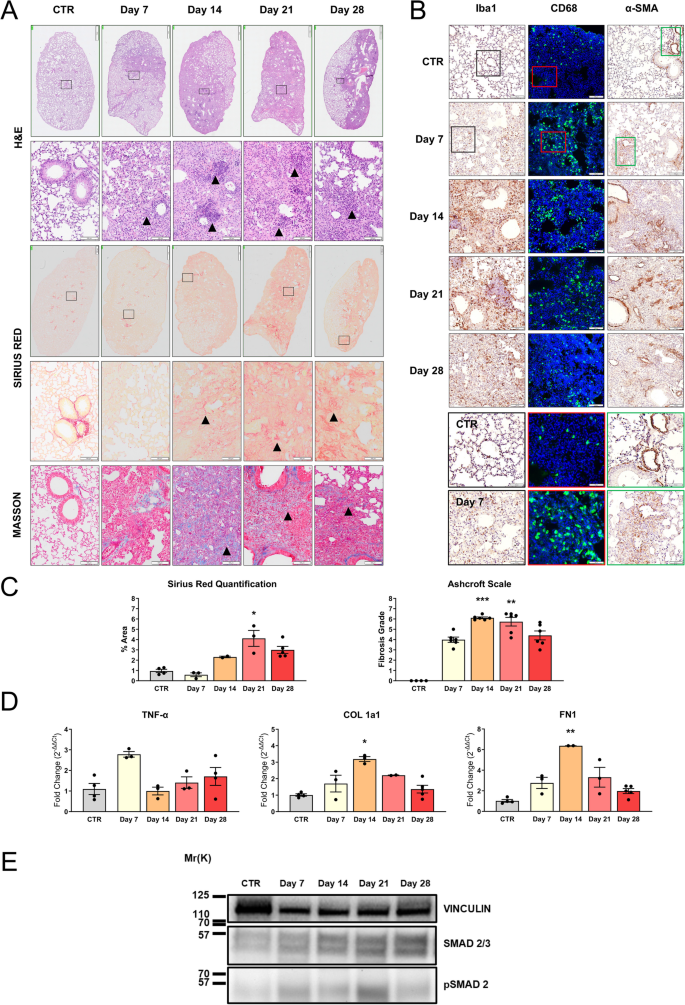
Histopathological characterization in BLM-treated animals (IN—3 mg/kg). A Histopathological evaluation by H&E staining (upper panel), Sirius Red staining (middle panel), and Masson’s trichrome (lower panel) of lungs of vehicle mice (CTR) or treated with BLM after a single IN administration. Representative images of lung sections of animals sacrificed at 7, 14, 21, and 28 days after the treatment are reported. Scale bar = 500 µm (upper panel) – 100 µm (lower panels). B IHC for Iba1 (left panel), CD68 (green—middle panel), and α-SMA staining (right panel) of lungs of CTR or treated with BLM. Representative images of lung sections of animals sacrificed at 7, 14, 21, and 28 days after the treatment are reported. Scale bar = 100 µm. The boxed areas (Iba1 black, CD68 red, α-SMA green) in CTR and day 7 sections are shown at higher magnification in the right panel, scale bar = 50 µm C) Histopathological quantification of Sirius Red staining in lung section (left graph) and representation of Ashcroft scale grade (right graph) obtained by Masson’s trichrome analysis of lungs of CTR or treated with BLM. Data are reported as mean ± SE. The data were analyzed by Kruskal–Wallis test followed by Dunn’s test. Significant differences compared to the CTR are reported, *p ≤ 0.05, **p ≤ 0.01, ***p ≤ 0.001. D) mRNA expression of TNF-α, COL 1a1, and FN1 was evaluated by RT-qPCR in the lungs of mice (n = 3 per group) treated with BLM and sacrificed at different time points. Genes were normalized on β-actin, and the 2−ΔΔCt method was employed for relative quantification on an external calibrator. Data are reported as mean ± SE and were analyzed with Kruskal–Wallis test followed by Dunn’s test. Significant differences compared to the CTR are reported, *p ≤ 0.05, **p ≤ 0.01. E) SMAD 2/3 and pSMAD 2 expression in the lungs from CTR mouse at days 7, 14, 21, and 28 of treatment obtained with WB
Gene expression of TNF-α, COL 1a1, and FN1 through Real-Time PCR showed a peak in COL 1a1 and FN1 expression at 14 days from BLM administration, whereas TNF-α expression peaked at day 7, although it was not significantly different from control animals (Fig. 5D). The latter result could reflect the pathogenesis of IPF, where an inflammatory phenotype with the secretion of TNF-α precedes the onset and development of fibrosis with the deposition of aberrant ECM proteins such as COL 1a1 and FN1. A similar upregulation of pSMAD 2 expression found with the higher dose was observed in mice treated with 3 mg/kg BLM, at day 7 (Fig. 5E). These results showed significant lung impairment by IN administration of 3 mg/kg BLM, suggesting that this protocol has the potential to finely tune the extent of fibrosis and the degree of lung impairment, with reduced animal distress.
Further BLM dose reduction to improve animal welfare does not induce IPF
In line with the objectives of this study to develop a reliable animal model while adhering to the principles of the 3Rs, and based on the results presented in the previous paragraphs, the final step involved a further reduction in the BLM dose. The same experimental scheme used previously was followed with a dose of 1 mg/kg of BLM. Except for a slight weight loss in the first week in BLM-treated mice, a similar trend was observed between the two groups. The treatment caused a maximum weight loss of 10% during the first week, followed by rapid recovery. Notably, from day 14 after administration, there was a full restoration to normal weight, followed by a physiological weight gain (Fig. 6A, B). The functional analysis using the plethysmograph did not highlight any significant alterations in many respiratory parameters (Te, Vt, VE, PEF, and Ti/Te), except for a reduction in RR exclusively at 7 days post-administration. This finding aligns with an adaptive response characterized by decreased RR and increased respiratory effort, as reflected by elevated PIF shortly after the injury.
Fig. 6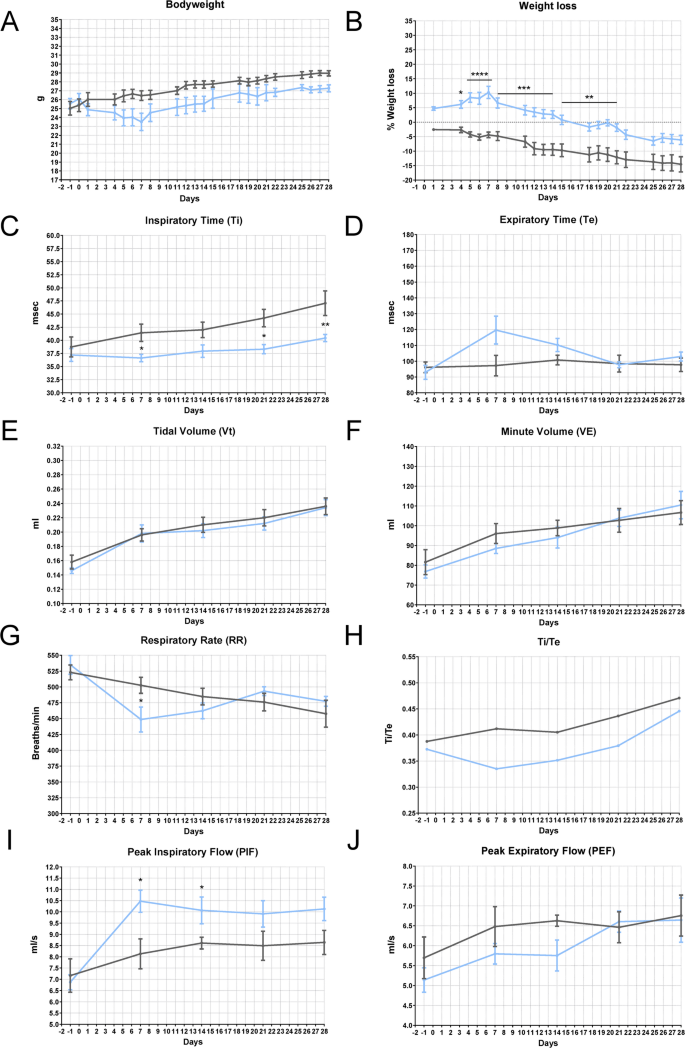
Health status in BLM-induced lung injury mouse model—Plethysmography (IN—1 mg/kg). A) Bodyweight and B) weight loss in C57BL/6 J mice treated via single IN administration with BLM (light blue line) or vehicle (grey line). The data were analyzed using Two-Way ANOVA followed by Šidák’s test. *p ≤ 0.05, **p ≤ 0.01, ***p ≤ 0.001, ****p ≤ 0.0001. C-J) Effect of BLM on Ti (msec), Te (msec), Vt (ml), VE (ml), RR (breaths/min), Ti/Te, PIF (ml/s), and PEF (ml/s) in C57BL/6 J mice. Control animals are represented by the grey line (n = 5); BLM-treated animals are represented by the light blue line (n = 5). The data were analyzed using the nonparametric Mann–Whitney U test comparing the parameters with the CTR group at each time point, *p ≤ 0.05, **p ≤ 0.01