

Introduction
Endometrial cancer (EC) is one of the most common gynecologic malignancies worldwide. GLOBOCAN 2020 reported nearly 417,000 new cases (approximately 2% of all cancers) and approximately 97,000 deaths or 1% of cancer-related mortality []. The incidence of EC is expected to rise over the next decade [,]. Notably, its standardized incidence in low- or middle-income countries in Asia has been increasing annually, approaching that of high-income countries [].
Accurate staging based on the International Federation of Gynecology and Obstetrics (FIGO) system is essential for guiding surgical decisions [,]. Overtreatment can cause unnecessary complications, while undertreatment increases the risk of disease progression [].
Among the FIGO parameters, the depth of myometrial invasion (MI) is particularly critical. Tumors with MI of ≥50% (FIGO stage IB) require more extensive surgery, including pelvic lymphadenectomy []. However, preoperative assessment of MI predominantly relies on transvaginal ultrasonography and magnetic resonance imaging (MRI) [], with diagnosis precision highly dependent on the radiologist’s expertise [-]. Studies have highlighted concerning levels of interobserver variability, with Cohen κ values ranging from 0.43 to 0.67 across institutions [].
Advances in artificial intelligence (AI) offer promising solutions [], and interest in EC applications is growing []. Li et al [] leveraged 2 machine learning (ML) models—an ensemble classifier with automated hyperparameter optimization and least absolute shrinkage and selection operator regression—integrating clinical and MRI features to achieve an area under the receiver operating characteristic curve (AUROC) of 0.97 for histological prediction. This approach reduces reliance on intraoperative frozen section pathology and demonstrates the potential of ML for noninvasive preoperative evaluation. Similarly, Zhu et al [] first quantified MI using the geometric relationship between the uterus and the tumor, laying a more rational basis for region segmentation and texture feature extraction. These findings further exemplify the superiority of ML in radiographic feature analysis. Several studies have also explored radiomics-based ML models for detecting MI in EC [,]. However, most studies are limited by small sample sizes and lack systematic validation. In the systematic review conducted by Di Donato et al [], only 5 studies specifically addressed MI, highlighting the scarcity of robust evidence. He et al [] also reported a few MI-focused studies but did not evaluate the influence of different ML models on outcomes. At present, no reliable evidence exists to verify the effectiveness of radiomics-based ML models in detecting MI in EC. To bridge this gap, we conducted a systematic review and meta-analysis to evaluate the diagnostic performance of these models in identifying deep MI in EC. Our findings aim to support the development of reliable, noninvasive diagnostic tools for preoperative assessment.
MethodsStudy Registration
Our study followed the PRISMA (Preferred Reporting Items for Systematic Reviews and Meta-Analyses) guidelines. The protocol was registered on PROSPERO (CRD420250625797).
Eligibility CriteriaInclusion Criteria
The inclusion criteria were as follows: (1) participants were patients diagnosed with EC; (2) study designs were case-control, cohort, or cross-sectional studies; (3) the study developed a complete ML model for predicting MI in EC; and (4) the study was published in English.
Exclusion Criteria
The exclusion criteria were as follows: (1) unpublished conference abstracts; (2) studies that conducted only risk factor analyses without developing a complete ML model; (3) studies that lacked key model performance evaluation metrics, such as AUROC values, C-statistics, sensitivity, specificity, accuracy, precision, confusion matrices, F1-scores, or calibration curves; and (4) studies that performed only univariate predictive accuracy analyses.
Data Sources and Search Strategy
PubMed, Cochrane Library, Embase, and Web of Science were comprehensively searched. The final search was conducted on November 26, 2024. Medical Subject Headings terms and free-text keywords were used, with no restrictions on location. The search strategy is detailed in Table S1 in .
Study Selection and Data Extraction
The identified articles were uploaded to EndNote (Clarivate) for reference management. After duplicate removal, titles and abstracts were screened to identify potentially eligible studies. Full texts were subsequently retrieved and assessed according to the eligibility criteria. Before data extraction, a standardized form was developed, capturing the following information: first author; publication year; study setting; study design; number of MI cases and training cases with MI; total number of cases and validation cases; model type; variables used for modeling; AUROC values; number of true positives, false positives, true negatives, and false negatives; sensitivity; specificity; precision; and overall accuracy. Study selection and data extraction were conducted independently by 2 reviewers, with disagreements resolved through discussion or consultation with a third reviewer.
Study Quality Assessment
The radiomics quality score (RQS) was used to assess study quality and risk of bias. This tool consists of 16 items (maximum score: 36) covering domains such as image protocol quality, multiple segmentations, phantom study on all scanners, imaging at multiple time points, feature reduction or adjustment for multiple testing, multivariable analysis with nonradiomic features, detection and discussion of biological correlates, cutoff analyses, discrimination statistics, calibration statistics, prospective study registration in a trial database, validation, comparison to gold standard, potential clinical utility, cost-effectiveness analysis, and open science and data sharing. Two investigators independently conducted the RQS assessment, with discrepancies resolved through discussion or adjudication by a third reviewer.
Synthesis Methods
The meta-analysis of diagnostic performance was conducted using a bivariate mixed-effects model applied to 2×2 contingency tables from validation datasets. This model accounts for both fixed and random effects while incorporating the intrinsic relationship between sensitivity and specificity. For studies without explicit 2×2 data, contingency tables were reconstructed using reported sensitivity, specificity, precision, and accuracy (refer to the following formula):
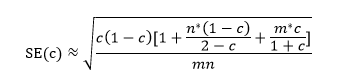
where c denotes the C-statistic, n denotes the number of observed events, and m denotes the total sample size.
The model provided pooled estimates of sensitivity, specificity, positive likelihood ratio (PLR), negative likelihood ratio (NLR), diagnostic odds ratio (DOR), and the area under the summary receiver operating characteristic curve (AUSROC) with corresponding 95% CIs. Publication bias was assessed using the Deeks funnel plot, and clinical applicability was evaluated through the Fagan nomogram. Subgroup analyses were carried out according to model type. Statistical significance was defined as P<.05.
ResultsStudy Selection
We retrieved 3525 records through a comprehensive database search, of which 912 (26%) duplicates and 2087 (59%) studies irrelevant to the subject of our investigation were removed. The titles and abstracts of the remaining 526 studies were screened, and 25 (5%) studies containing the keywords “EC” and “MI” were shortlisted. After a full-text review, 6 (24%) of the 25 studies were excluded for not aligning with the research objectives, leaving 19 (76%) studies for inclusion in the meta-analysis [,,-,-] ().
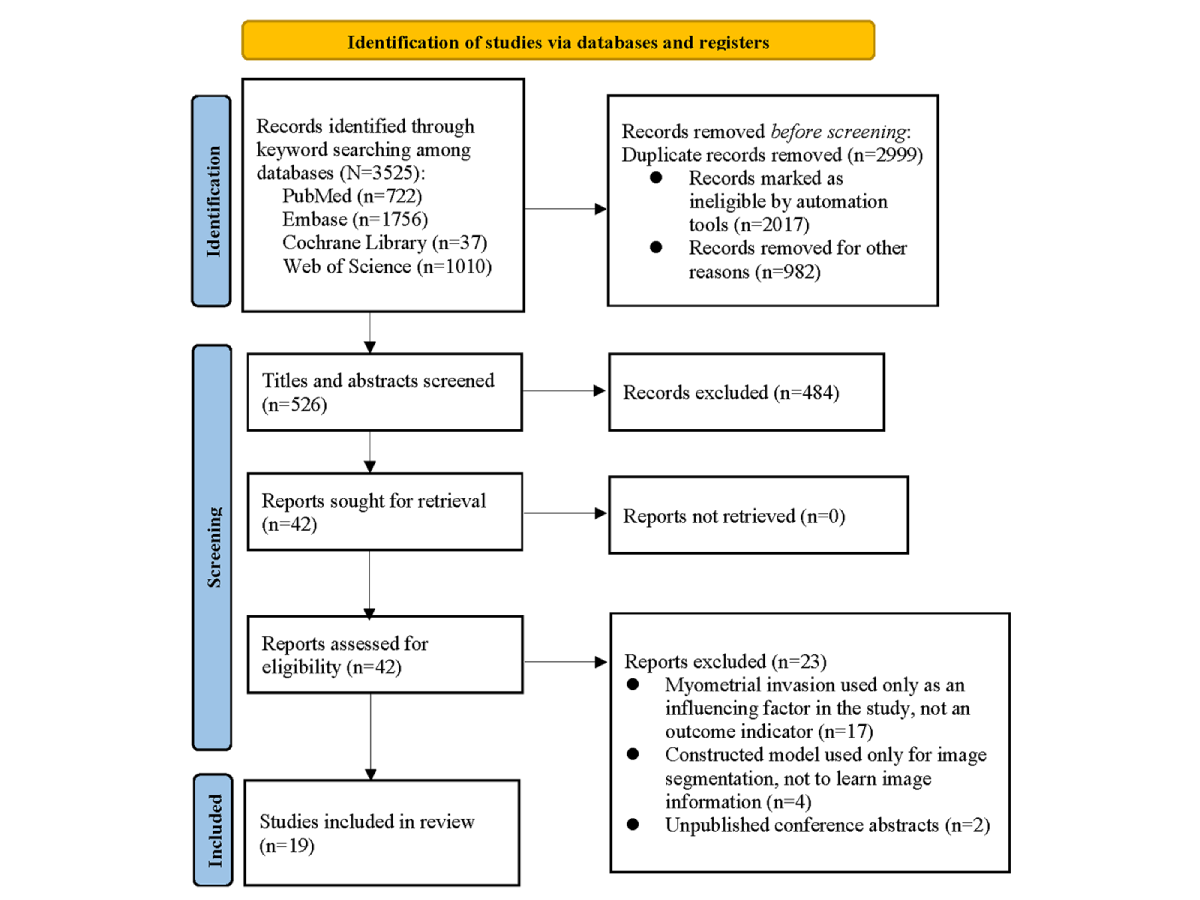 Figure 1. Flow diagram of study selection. Study Characteristics
The eligible studies, which were published between 2019 and 2024, comprised 4373 patients with EC, of whom 1221 (28%) had identifiable MI. All studies defined MI as an infiltration depth greater than 50%. Of the 19 studies, 4 (21%) used multicenter cohorts for validation, while the remaining 15 (79%) relied on randomly selected samples. Regarding modeling approaches, 5 (26%) of the 19 studies applied deep learning (DL) algorithms, and 14 (74%) used ML techniques. Of the 19 studies, 17 (89%) used MRI-based radiomic features, 1 (5%) incorporated apparent diffusion coefficient parameters, and 1 (5%) used ultrasound radiomic features as input variables ().
Table 1. Baseline characteristics of the included studies (n=19).Study; countryStudy settingDefinition of MIaMI cases, nTotal cases, nMI cases in the training set, nTotal cases in the training set, nValidation set generation methodMI cases in the validation set, nTotal cases in the validation set, nImaging modalityChen et al [], 2020; ChinaSingle centerMI >50%9953057313Random samplingDataset 1: 24; dataset 2: 18Dataset 1 :79; dataset 2: 138MRIbDong et al [], 2020; ChinaSingle centerMI >50%1972—c24Random sampling—48MRIHan et al [], 2020; ChinaSingle centerMI >50%44163——Random sampling——MRIJiang et al [], 2023; ChinaSingle centerMI >50%3515824110Random sampling1148MRILi et al [], 2023; United KingdomMulticenterFIGOd IB—495292413Random sampling1482MRILiu et al [], 2024; ChinaMulticenterMI >50%206609 I:1289144509Internal validation and external validationDataset 1: 31; dataset 2: 31Dataset 1: 95; dataset 2: 95UltrasoundMao et al [], 2023; ChinaSingle centerMI >50%651344596Random sampling2038MRIQin et al [], 2022; ChinaSingle centerFIGO IB2234812243Random sampling10105MRIRodríguez-Ortega et al [], 2021; SpainSingle centerMI >50%6214346107Random sampling1636MRIStanzione et al [], 2021; ItalySingle centerMI >50%17541443Random sampling311MRIXiong et al [], 2023; ChinaSingle centerMI >50%7115450108Random sampling2146MRIZhu et al [], 2021; ChinaSingle centerMI >50%1979——Multicenter——MRIZhao et al [], 2022; ChinaMulticenterMI >50%6916346107Multicenter2356MRIFang et al [], 2024; ChinaSingle centerMI >50%7919855138Random sampling2460MRIMa et al [], 2023; ChinaSingle centerMI >50%9529249204Random sampling3188MRIMiccò et al [], 2022; SwitzerlandMulticenterMI >50%601245098Multicenter1026MRILefebvre et al [], 2022; CanadaMulticenterMI >50%791574394Multicenter3663MRIZhang et al [], 2021; ChinaSingle centerMI >50%5321053210———MRIOtani et al [], 2022; JapanSingle centerMI >50%12720095150Random sampling3250MRI
aMI: myometrial invasion.
bMRI: magnetic resonance imaging.
cNot applicable.
dFIGO: International Federation of Gynecology and Obstetrics.
Study Quality Assessment
Several domains were not fully addressed in the included studies, resulting in partial scores in the quality assessment. Factors such as the high cost of MRI examinations and poor patient adherence to repeated scans limited reproducibility. None of the studies collected imaging at multiple time points. Most (14/19, 74%) were single-center studies, and repeated scans on different devices were rarely feasible due to equipment costs. Device-related differences were not assessed in any study, resulting in zero points for interscanner variability. Furthermore, none of the studies reported prospective protocols or registration in publicly accessible databases. The vast majority of the studies (18/19, 95%) did not examine vendor-specific dependencies or biological correlates. Potential clinical utility was not assessed in 16 (84%) of the 19 studies, and calibration statistics were missing in 15 (79%) studies, while 12 (63%) did not perform multivariable analyses incorporating nonradiomic clinical features. Of the 19 studies, 14 (74%) omitted threshold effect analyses, and 4 (21%) did not disclose open science practices or share datasets. The final quality assessment based on the RQS is shown in .
The RQS assessment also highlighted substantial deficiencies across the included studies. Many of the studies (n/N, %) lacked preliminary experiments, making certain items difficult to score. The included studies all lacked preliminary experiments, making it difficult to score certain items. Differences in imaging protocols across devices were generally not addressed. Notably, RQS scoring for validation methods ranges from −5 to +5 points, with negative points assigned when no validation is performed. Multicenter studies receive higher scores, but such studies are scarce due to data barriers, contributing to lower overall RQS scores.
Table 2. Quality assessment of the included studies (n=19) based on the radiomics quality score (RQS; maximum score: 36).StudyRQS itemTotal scoreProportion of maximum RQS (%)
1a2b3c4d5e6f7g8h9i10j11k12l13m14n15o16p
Chen et al [], 20201100−100010020002617Dong et al [], 20201100000010020200719Han et al [], 20201100000020020001719Jiang et al [], 20231100000110020001719Li et al [], 202311000101100300021028Liu et al [], 202411100100100402001131Mao et al [], 20231100000010020001617Qin et al [], 20221100010010020000617Rodríguez-Ortega et al [], 20211100000010020001617Stanzione et al [], 20211100000020020001719Xiong et al [], 20231100000110020002822Zhu et al [], 20211100000010020002719Zhao et al [], 202211000101210302011336Fang et al [], 20241100000021020001822Ma et al [], 202311000111210210001131Miccò et al [], 20221100010010030001822Lefebvre et al [], 20221100000010030001719Zhang et al [], 202111001000120200021028Otani et al [], 20221100010010020001719
aImage protocol quality.
bMultiple segmentations.
cPhantom study on all scanners.
dImaging at multiple time points.
eFeature reduction or adjustment for multiple testing.
fMultivariable analysis with nonradiomic features.
gDetection and discussion of biological correlates.
hCutoff analyses.
iDiscrimination statistics.
jCalibration statistics.
kProspective study registration in a trial database.
lValidation.
mComparison to gold standard.
nPotential clinical utility.
oCost-effectiveness analysis.
pOpen science and data sharing.
Meta-AnalysisAll Results
We analyzed 17 diagnostic contingency tables to assess the performance of ML models in identifying MI in EC. The pooled sensitivity and specificity were 0.79 (95% CI 0.73-0.83; I²=31.39%) and 0.83 (95% CI 0.79-0.86; I²=48.58%), respectively. The pooled PLR, NLR, DOR, and AUSROC were 4.5 (95% CI 3.5-5.8), 0.26 (95% CI 0.20-0.34), 17 (95% CI 11-28), and 0.89 (95% CI 0.00-1.00), respectively ( and ), indicating low heterogeneity and relatively high predictive accuracy.
The Fagan nomogram (Figure S1 in ) showed that a positive model prediction corresponded to a 66% posttest probability of MI, while a negative prediction corresponded to a 90% probability of absent invasion. The Deeks funnel plot revealed no significant publication bias (P=.31; Figure S2 in ).
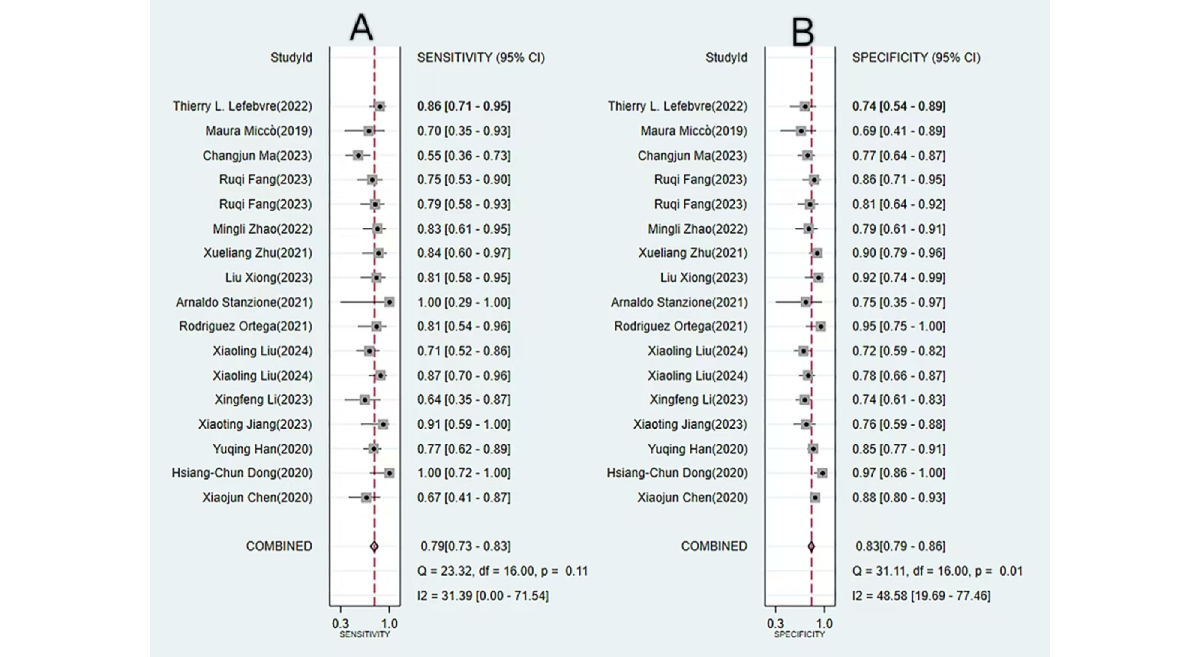 Figure 2. Forest plots of pooled sensitivity and specificity for machine learning–based prediction of myometrial invasion in endometrial cancer. Both plots demonstrate minimal heterogeneity, indicating a high degree of consistency across the included studies. (A) Forest plot depicting the pooled sensitivity from the meta-analysis. (B) Forest plot depicting the pooled specificity. [, , , , , , , , -].
 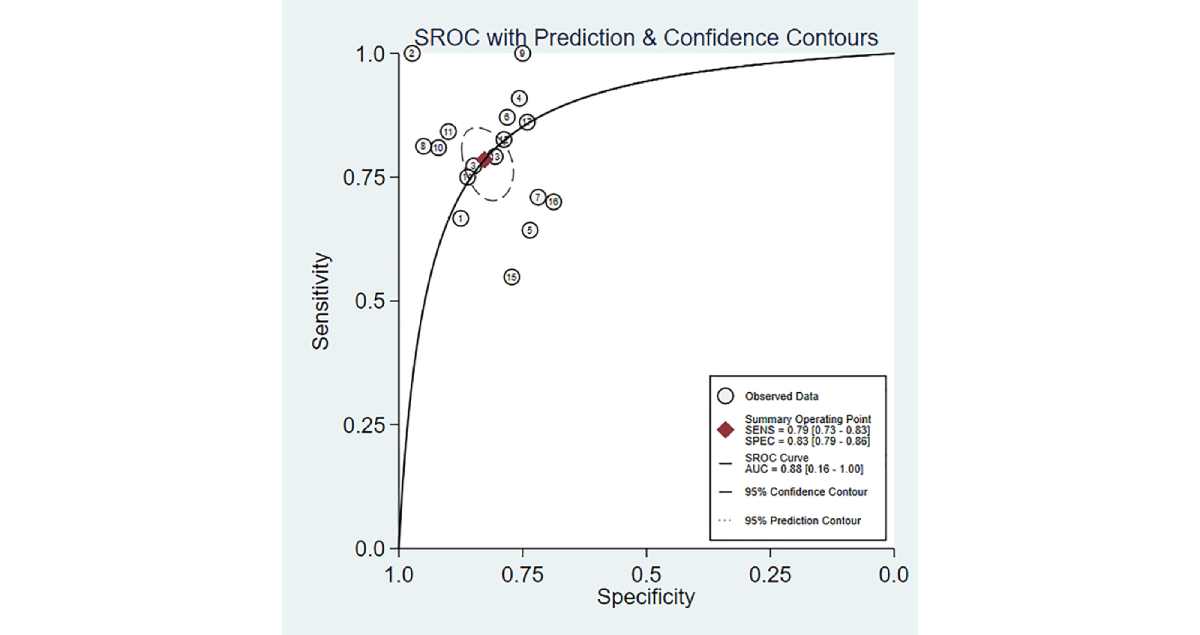 Figure 3. Area under the summary receiver operating characteristic curve (AUSROC) with prediction and confidence contours for machine learning–based prediction of myometrial invasion in endometrial cancer. AUSROC values fitted from the study estimates indicate no threshold effect. DL Results
The diagnostic performance of DL models for detecting MI in EC was evaluated across six 2×2 contingency tables. The pooled sensitivity and specificity were 0.81 (95% CI 0.71-0.88; I²=41.7%) and 0.86 (95% CI 0.76-0.92; I²=71.9%), respectively. The pooled PLR, NLR, DOR, and AUSROC were 5.6 (95% CI 3.2-9.8), 0.22 (95% CI 0.14-0.36), 25 (95% CI 10-64), and 0.89 (95% CI 0.00-1.00), respectively, indicating comparatively high predictive accuracy (Figures S3 and S4 in ).
The Fagan nomogram showed that a positive DL prediction corresponded to a 50% posttest probability of true MI, whereas a negative prediction corresponded to an 82% probability of true absence (Figure S5 in ). The Deeks funnel plot suggested significant publication bias (P=.04; Figure S6 in ).
Conventional ML Results
The diagnosis performance of conventional ML (CML) models for detecting MI in EC was assessed using 11 diagnostic 2×2 contingency tables. The pooled sensitivity and specificity were 0.77 (95% CI 0.69-0.83; I2=33.26%) and 0.81 (95% CI 0.77-0.85; I2=29.12%), respectively. The PLR, NLR, DOR, and AUSROC were 4.1 (95% CI 3.2-5.4), 0.28 (95% CI 0.20-0.39), 15 (95% CI 9-25), and 0.86 (95% CI 0.00-1.00), respectively, indicating low heterogeneity and relatively favorable predictive accuracy (Figures S7 and S8 in ).
The Fagan nomogram showed that a positive model prediction corresponded to a 50% posttest probability of true MI, whereas a negative prediction corresponded to an 82% probability of true absence (Figure S9 in ). The Deeks funnel plot revealed insignificant publication bias (P=.79; Figure S10 in ).
DiscussionKey Findings
Current ML approaches for detecting deep MI in EC primarily rely on MRI-based radiomics and demonstrate favorable diagnostic performance. Across all included studies, the pooled sensitivity and specificity were 0.79 (95% CI 0.73-0.83) and 0.83 (95% CI 0.79-0.86), respectively. DL models achieved a sensitivity of 0.81 (95% CI 0.71-0.88) and a specificity of 0.86 (95% CI 0.76-0.92), whereas CML models achieved a sensitivity of 0.77 (95% CI 0.69-0.83) and a specificity of 0.81 (95% CI 0.77-0.85).
Comparison With Previous Studies
Previous studies have also explored the use of MRI-based radiomics for assessing MI in EC. Di Donato et al [] reviewed MRI-based radiomics studies in EC; of 5 studies on MI, 4 were excluded due to missing AUROC values, validation cohorts, or essential diagnostic data. The pooled sensitivity and specificity in the remaining study were 0.743 (95% CI 0.607-0.844) and 0.816 (95% CI 0.740-0.874), respectively, although the limited sample may reduce generalizability. He et al [] evaluated ML-based radiomics for preoperative EC assessment, encompassing high-grade lesions, lymphovascular invasion, lymph node metastasis, and deep MI. For MI-specific models using radiomic features, the sensitivity and specificity were 0.80 (95% CI 0.74-0.84) and 0.81 (95% CI 0.76-0.86), respectively, but the impact of model differences on performance was not discussed. CML requires manual image segmentation, feature extraction, and model training, making it labor intensive and subject to interoperator variability. By contrast, DL automatically identifies features from imaging data, reducing workload and variability. Future studies should compare CML and DL performance and explore their clinical applicability. Many previous studies were single-center studies with small samples, whereas our meta-analysis included 19 studies from multiple regions, comprising 4373 patients with EC, enhancing the generalizability of ML for MI detection.
ML is a data-driven methodology that enables predictive or classification tasks through model training. Both CML and DL are subfields of ML, but they differ markedly in terms of model architecture and learning paradigms []. CML relies on manually extracted clinical features (eg, blood pressure and glucose levels) and uses interpretable models such as support vector machines, random forests, or logistic regression. By contrast, DL automatically extracts high-dimensional imaging features without manual intervention, achieving superior performance with large datasets and complex patterns but exhibiting a “black box” nature []. Given the methodological and practical distinctions between CML and DL in clinical research, our study examined their diagnostic performance separately. The pooled sensitivity and specificity indeed differed between the 2 approaches.
Modeling Variables
Current ML models typically incorporate clinical features, genetic markers, and laboratory parameters; however, this study specifically focused on MRI-based radiomics. Owing to its noninvasive nature and high spatial resolution, MRI remains indispensable for EC diagnosis, MI assessment, recurrence monitoring, and personalized treatment []. The combined application of multiparametric MRI, incorporating T2-weighted imaging, diffusion-weighted imaging, and dynamic contrast-enhanced sequences, has further enhanced diagnostic performance. When applied in an integrated fashion, this approach consistently yields sensitivity and specificity exceeding 80%, substantially outperforming any single sequence modality alone [].
Most studies derive features from manual radiologist segmentation, which is subjective and may result in the loss of critical texture information. By contrast, DL integrates segmentation and feature extraction within the training process, preserving data integrity and improving accuracy. Our study found that DL also outperformed manual radiologist assessment in both sensitivity and specificity.
Selecting an appropriate modeling approach is challenging due to differences between CML and DL. CML requires manual encoding of variables such as age, FIGO stage, and tumor grade; moreover, MRI images must be segmented manually before feature selection and model training. This multistep process risks losing critical texture information. By contrast, DL automates lesion segmentation and predictive modeling, maximizing feature retention and improving accuracy. Nonetheless, CML retains the advantage of interpretability. In clinical contexts, using interpretable variables remains crucial for models that not only predict outcomes but also clarify their association with underlying clinical parameters.
Challenges in Translating Radiomics Into Clinical Practice
Although MRI-based radiomics shows promise for detecting MI in EC, substantial challenges remain before clinical implementation. DL excels in image recognition and decision-making, but its “black box” nature limits trust and adoption. While inputs and outputs are observable, the internal reasoning remains largely opaque, raising potential ethical concerns. Explainable AI offers a path forward, helping bridge theory and clinical practice; for example, saliency maps can highlight the regions driving model decisions, while simple interpretable models can approximate complex “black box” reasoning in specific contexts. In terms of datasets, most of the included studies (14/19, 74%) adopted a single-center design, with training and validation sets typically generated through internal random splits of a single dataset (eg, 7:3 or 8:2). Although such studies may produce models with favorable performance, the generalizability and clinical applicability of these models remain questionable due to the common absence of external validation using multicenter datasets. This limitation fundamentally undermines the robustness of the pooled results in this review and highlights the challenges faced by ML models trained on single-center data in achieving broader applicability.
Future Directions for Clinical Translation
The favorable diagnostic accuracy demonstrated by DL and radiomics in assessing MI in EC delineates a clear pathway for their integration into clinical workflows. These models are most likely to be applied as adjunctive tools within the existing preoperative MRI workflow rather than as stand-alone systems; for example, a DL-based automated algorithm could process MRI images in the background and provide radiologists with a quantitative risk score for deep MI. This would compensate for the limitations of subjective visual assessment; reduce interobserver variability; and enhance diagnostic confidence, particularly for less experienced clinicians.
The integration of such models holds promise for addressing critical bottlenecks in current patient care. One important application lies in improving preoperative risk stratification. By accurately identifying patients at high risk for deep MI, lymphovascular space invasion, or lymph node metastasis, these models can assist clinicians by (1) providing objective evidence to support the recommendation of lymphadenectomy, thereby optimizing surgical planning; and (2) potentially reducing the need for invasive diagnostic procedures in patients at low risk. Combining imaging features with clinical indicators (eg, age and BMI) will be crucial for developing robust multivariable prediction models that capture the complexity of clinical decision-making.
To realize this clinical value, future research must shift from mere technical validation to prospective evaluation in real-world clinical settings. Key steps include demonstrating workflow compatibility, assessing the impact on radiologists’ performance and decision-making (eg, through reader studies), and ultimately establishing whether the use of such models translates into improved patient outcomes. Addressing challenges related to model interpretability and generalizability across different MRI scanners will be essential for widespread adoption.
Strengths and Limitations of the Study
ML provides comprehensive and systematic evidence for assessing deep MI. Our meta-analysis included 4373 patients with EC, thereby enhancing the objectivity of the study. The pooled results revealed high accuracy and specificity, underscoring the potential clinical utility of ML-based approaches. However, several limitations must be acknowledged. First, although analyses based on both CML and DL approaches were carried out, only a small proportion of studies used external validation cohorts, which possibly compromises the application of our findings. Second, this analysis is constrained by the limited volume of available literature. In particular, high-quality studies focusing on DL methods remain relatively scarce, which may partially affect the interpretation of the generalizability of DL models and constitutes another limitation that warrants attention. We anticipate that future validation studies dedicated to DL will provide new evidence that can be incorporated into subsequent analyses, thereby strengthening the robustness of our conclusions. Third, the RQS assessment indicated that the included studies generally scored low. Methodological flaws, such as the lack of external validation and the failure to account for differences among scanning devices, may have led to biased and overly optimistic diagnostic performance reported in the studies. Although the performance metrics we pooled were favorable, they might not fully represent the true performance of these models in clinical practice. Fourth, the vast majority of studies (14/19, 74%) lacked independent external validation, implying that the pooled performance metrics may be overly optimistic and that reproducibility remains unproven. The single-center design of most of the studies (14/19, 74%) and the failure to account for interscanner variability may further affect the interpretation of results. These common limitations reflect not only the shortcomings of individual studies but also broader challenges in EC radiomics, particularly in data sharing, multicenter collaboration, and methodological standardization. Therefore, the universality of these models across different MRI devices, patient populations, and clinical settings remains unverified, which constitutes a key obstacle to the clinical translation of these models. Finally, publication bias was observed in the DL subgroup analysis (Deeks funnel plot: P=.04), suggesting that the high performance reported for DL models may be overestimated. This bias may stem from several factors: a publication preference for positive results, whereby studies with superior performance or favorable outcomes are more likely to be published; a tendency toward reporting successful cases involving complex or novel preprocessing pipelines or model architectures; and limited data and code sharing, which restricts reproducibility and makes negative or neutral results less likely to be validated and published.
Clinical Translation and Digital Health Policy Prospects
The results of this study highlight the significant potential of radiomics-based ML for the preoperative assessment of MI in EC. However, to promote the application of these models in clinical practice, some problems need to be addressed, such as workflow integration, ethical issues, and regulatory requirements and data policies.
Workflow Integration
The most feasible application of these ML models is as an auxiliary decision-making tool for radiologists; for example, the models can be integrated into the hospital system to automatically provide quantitative risk scores for MI and visualize decision areas when the physician reviews MRI images. This human-machine collaborative model can not only compensate for the biases of subjective visual assessment, improving diagnostic consistency, but also free physicians from repetitive tasks, allowing them to focus on the analysis of complex cases.
Ethical Issues
Ethical issues arising from the opacity of AI models must be addressed. The “black box” nature of DL models makes it difficult to understand their decision-making logic, which severely hinders the establishment of clinical trust and complicates the determination of responsibility in cases of misjudgments. Therefore, integrating interpretable AI models is one of the main directions in the future; for example, techniques such as saliency maps can visually highlight the image features driving model decisions, making the decision-making process transparent to physicians.
Regulatory Requirements and Data Policies
Regulatory requirements and data policies form the foundation for large-scale application. Regulatory agencies require strong prospective multicenter trial evidence to approve such AI tools for clinical practice. At the same time, the process of collecting large-scale data for model training must take into account the protection of patient privacy. Reasonable regulation and data policies are necessary for building diagnostic models with strong generalizability, in line with ethics and regulations.
Conclusions
Radiomics-based ML models (especially DL models) demonstrate strong diagnostic potential for the noninvasive prediction of MI in EC. However, current evidence, mainly derived from single-center, retrospective studies that have only performed internal validation, remains preliminary. Major challenges such as limited generalizability, the “black box” nature of DL, and potential publication bias have hindered the immediate application of radiomics-based ML models in clinical practice. In the future, it is imperative to conduct large-scale, prospective, multicenter external validation studies and integrate these models into clinical workflows. However, before such tools can be adopted in routine clinical practice, it is essential to address their interpretability and demonstrate their practical impact on clinical decision-making and patient prognosis.
This research was not supported by any specific grant from funding agencies in the public, commercial, or not-for-profit sectors.
All data generated or analyzed during this study are included in this paper and its supplementary information files.
WJ was responsible for methodology, formal analysis, software, writing the original draft, validation, and visualization. HW was responsible for conceptualization and reviewing and editing the manuscript. YC was responsible for supervision, data curation, and project administration. All authors commented on previous versions of the manuscript. All authors have read and approved the final version.
None declared.
Edited by J Sarvestan; submitted 10.Jun.2025; peer-reviewed by H Zhang, P Wu; comments to author 25.Aug.2025; revised version received 15.Sep.2025; accepted 07.Oct.2025; published 27.Nov.2025.
©Wanhao Jiang, Huali Wang, Yumeng Cui. Originally published in the Journal of Medical Internet Research (https://www.jmir.org), 27.Nov.2025.
This is an open-access article distributed under the terms of the Creative Commons Attribution License (https://creativecommons.org/licenses/by/4.0/), which permits unrestricted use, distribution, and reproduction in any medium, provided the original work, first published in the Journal of Medical Internet Research (ISSN 1438-8871), is properly cited. The complete bibliographic information, a link to the original publication on https://www.jmir.org/, as well as this copyright and license information must be included.