
Sample collection
We used the Mycobacterium abscessus laboratory strain ATCC-19977, the avirulent Mycobacterium tuberculosis strain H37Ra and the auxotrophic M. tuberculosis strain mc27000 (H37Rv ΔpanCD ΔRD1)68. Clinical M. abscessus isolates were obtained from respiratory samples (sputum or bronchoalveolar lavage fluid) collected from patients with pulmonary M. abscessus infection as described previously40. All work with clinical M. abscessus isolates and avirulent M. tuberculosis strains was conducted in a biosafety level 2 (BSL-2) facility, in accordance with institutional biosafety regulations. Included patients came from all major cystic fibrosis centres in the United Kingdom, the Republic of Ireland (Dublin), Sweden (Gothenburg), Denmark (Copenhagen and Skejby), the Netherlands (Nijmegen) and Australia (Queensland). M. abscessus isolates were retrieved from the original mycobacterial growth indicator tubes (MGIT) or, if otherwise unavailable, from subcultured isolates. The study was approved in England and Wales by the National Research Ethics Service (12/EE/0158) and the National Information Governance Board (ECC 3-03 (f)/2012) and in other centres by respective local review boards.
Bacterial growth assessments
All consumables are provided in Supplementary Table 4. Planktonic growth rates and the lag times of M. abscessus isolates were assessed following suspension in nutrient-rich media. Approximately 105 c.f.u.s of M. abscessus were inoculated in 2.5 ml of Middlebrook 7H9 medium (supplemented with 0.4% glycerol, 10% OADC [oleic acid, albumin, dextrose, catalase] and 0.05% Tween 80) in 15 ml glass tubes, which were then incubated at 37 °C with 150 r.p.m. orbital shaking. Optical densities (OD565) were measured with a densitometer (DEN-1B; Biosan) and quantified in McFarland units. OD565 readings were performed every 12 h for a minimum of 5 days until the readings stabilized for at least 24 h (change in McFarland less than 0.5). Background-corrected OD565 measurements were used to fit Gompertz functions to estimate growth rates, where N is the number of bacteria at a given time (t), with A representing carrying capacity (maximum population size), B the initial growth factor affecting displacement along the y axis and C, the growth rate constant. Lag times were calculated from the fitted Gompertz function and the known inoculum size.
$$N\left(t\right)=\,A{e}^{-B{e}^{-{Ct}}}$$
(1)
Given that conventional formulas are imprecise when considering that the growth rate is a proportion of the carrying capacity per time69, we calculated the growth rate (µ) with the following equation:
$$\mu =C\,\frac{\mathrm{Lambert}W\left(\frac{A}{e{N}_{0}}\mathrm{ln}\left(\mathrm{ln}\left(\frac{A}{{N}_{0}}\right)\right)\right)}{\mathrm{ln}\left(\mathrm{ln}\left(\frac{A}{{N}_{0}}\right)\right)}$$
(2)
The lag time (λ) was calculated as:
$$\lambda =-\mathrm{ln}\left(\mathrm{ln}\left(\frac{A}{{N}_{0}}\right)/B\right)/C$$
(3)
Drug susceptibility testing
Antibiotic resistance was quantified using MICs, following the Clinical Laboratory Standards Institute (CLSI; M24 3rd edition) guidelines70. B.W. received training at the National Center for Mycobacteria, Zürich (Switzerland), to align with standard clinical microbiology practices. M. abscessus isolates were cultured in Middlebrook 7H9, supplemented with 0.4% glycerol, 10% OADC and 0.05% Tween 80, for 3 days and then diluted in PBS to a McFarland standard of 0.5. A 140 µl aliquot of this suspension was mixed into 14 ml cation-adjusted Mueller–Hinton broth (CAMHB) to achieve an approximate density of 106 c.f.u.s ml−1. Antibiotics were tested in log2-fold concentration steps at the following ranges: amikacin (0.25–512 µg ml−1), azithromycin (3.9 ng l−1–512 µg ml−1), cefoxitin (0.5–256 µg ml−1), clarithromycin (3.9 ng l−1–512 µg ml−1), clofazimine (7.8 ng ml−1–16 µg ml−1), imipenem (0.13–56 µg ml−1), linezolid (0.25–128 µg ml−1), minocycline (15.6 ng ml−1–256 µg ml−1), moxifloxacin (15.6 ng ml−1–32 µg ml−1) and tigecycline (15.6 ng ml−1–8 µg ml−1). For each experiment CAMHB was freshly prepared. Antibiotics and CAMHB were added to 96-well plates to reach a volume of 50 µl per well. After mixing, the 50 µl bacterial suspension was added to each well to obtain a final bacterial concentration of ~5 × 10⁵ c.f.u.s ml−1. Each plate included growth and media control wells. Mycobacterium peregrinum (ATCC-700686) MICs were assessed for quality control in each experimental batch. Plates were sealed and incubated at 30 °C and visually evaluated for growth after 3–5 days once growth was visible in the growth control wells. Azithromycin and clarithromycin conditions were reassessed after 14 days of incubation to evaluate inducible macrolide resistance. MICs were recorded as the lowest drug concentration preventing visible mycobacterial growth. For further analyses, we used either log2-transformed MIC values or applied previously reported M. abscessus resistance breakpoints (clarithromycin MIC ≥ 8 µg ml−1; amikacin MIC ≥ 64 µg ml−1 (ref. 71)).
M. tuberculosis drug susceptibility testing was done analogous to M. abscessus, except that M. tuberculosis isolates were cultured in 5 ml of Middlebrook 7H9 broth, supplemented with 0.4% glycerol, 10% OADC and 0.05% Tween 80 in 50 ml tubes (M. tuberculosis mc27000 was additionally supplemented with 100 µg ml−1 pantothenate), and that MIC plates were assessed after 14 days. Bedaquiline, clofazimine, delamanid, ethambutol, linezolid, moxifloxacin, pretomanid, rifampicin, rifapentin, SQ109 and sutezolid were assessed in log2-fold concentration steps between 2 ng ml−1 and 64 µg ml−1, whereas isoniazid and pyrazinamide were assessed between 4 ng ml−1 and 128 µg ml−1.
C.f.u.-based time–kill kinetics
M. tuberculosis mc27000 was cultured in 10 ml of Middlebrook 7H9 broth supplemented with 0.4% glycerol, 10% OADC, 0.05% Tween 80 and 100 µg ml−1 pantothenic acid. Cultures were incubated at 37 °C with shaking (150 r.p.m.) until mid-log phase, then washed and resuspended in PBS before incubation at 37 °C for 14 days. PBS-starved bacteria where standardized to ~107 c.f.u.s ml−1, and 180 µl was dispensed into 96-well U-bottom-plates. Individual drugs or drug combinations were added (30 µl) to achieve maximum therapeutic blood concentrations (Cmax): bedaquiline 1.1 µg ml−1, clofazimine 1.25 µg ml−1, delamanid 0.5 µg ml−1, ethambutol 4 µg ml−1, isoniazid 4.5 µg ml−1, linezolid 19 µg ml−1, moxifloxacin 4 µg ml−1, pretomanid 7.8 µg ml−1, pyrazinamide 40 µg ml−1, rifampicin 16 µg ml−1, rifapentin 19 µg ml−1, SQ109 0.026 µg ml−1 and sutezolid 1.48 µg ml−1. Each condition was tested in triplicate. Plates were sealed with parafilm, covered with lids and incubated at 37 °C. At days 0, 3 and 7, 20 µl from each condition were transferred into 180 µl of PBS. Serial dilutions were performed, and 5 µl of each dilution were spotted onto 7H11 agar plates supplemented with 100 µg ml−1 pantothenic acid (in duplicate). In addition, 50 µl of undiluted samples were washed and directly plated on pantothenate-supplemented 7H11 agar. Plates were incubated at 37 °C until visible colonies emerged. Colonies were manually counted at dilutions where 2–200 colonies were present, and c.f.u.s ml−1 were calculated. The detection limit was 20 c.f.u.s ml−1.
In vivo data
The in vivo classifications of M. tuberculosis drug regimens ‘as good or worse than SOC (where isoniazid-rifampicin-pyrazinamide-ethambutol or isoniazid-rifampicin-pyrazinamide were considered SOC)’ or ‘better than SOC’ were obtained from two previous studies. In vivo classifications based on mouse models were obtained from ref. 30, and classifications based on phase 2a and 2b clinical trials (assessing bactericidal activity) were obtained from ref. 31. All similar-to-SOC or better-than-SOC drug combinations from the relapsing mouse model (n = 46) and clinical studies (n = 14) were assessed with ASCT. These drug combinations and classifications of single drugs were also used to evaluate the performance of ASCT in bactericidal mouse models (common mouse strains: n = 48; C3HeB/FeJ mouse strain: n = 15). Clinical metadata of patients with respiratory M. abscessus infection were available for a subset of patients. Treatment outcomes were assessed in patients meeting the ATS/IDSA criteria of NTM pulmonary disease72. Patients with positive cultures after 6 months of M. abscessus treatment were considered as having persisting infections, and patients with sustained culture conversion (microbiological clearance) as cleared infections. Growing isolates were excluded from the analysis of bacterial killing. The discriminative performance for predicting the success of drug regimens in mouse or patient populations (M. tuberculosis) and the clinical outcome in individual patients (M. abscessus) was assessed with logistic regression and quantified with AUC-ROC. For each condition, 50 bootstrap iterations were performed by randomly selecting 80% of the samples. Sensitivity, specificity, positive and negative predictive values, and F1 scores were calculated at the optimal cut-off determined by the Youden index.
ACST experimental setup
M. abscessus and M. tuberculosis isolates were cultured in 5 ml of Middlebrook 7H9 broth, supplemented with 0.4% glycerol, 10% OADC and 0.05% Tween 80 in 50 ml tubes (M. tuberculosis mc27000 was additionally supplemented with 100 µg ml−1 pantothenate). The cultures were incubated at 37 °C with shaking at 150 r.p.m. until mid-log phase (McFarland: 5–8). In M. tuberculosis, we also assessed two starvation conditions: PBS starvation and pantothenate starvation. For PBS starvation, mid-log phase bacteria (H37Ra or M. tuberculosis mc27000) were washed and resuspended in PBS, the 50 ml tube filled with PBS and incubated for 14 days at 37 °C without shaking. For pantothenate starvation, M. tuberculosis mc27000 (H37Rv ΔpanCD ΔRD1) was incubated for 14 days with Middlebrook 7H9, supplemented with 0.4% glycerol, but not pantothenate.
After growth or starvation, mycobacteria were centrifuged at 3,000 g for 10 min, and the resulting pellet was resuspended in Middlebrook 7H9 (for growth conditions and pantothenate starvation), in Middlebrook 7H9 with pantothenate supplementation (for growth conditions in M. tuberculosis mc27000) or in PBS (for PBS starvation). To achieve single-cell suspensions, large clumps were removed by low-speed centrifugation (200 g, 3 min), followed by serial filtration of the supernatant through 5 µm and 1.2 µm filters (Sartorius Minisart). In every sample, bacterial densities were assessed using OD565 measurements, and the live-cell fraction was quantified using propidium iodide staining and imaging. Bacterial samples with a live-cell fraction below 95% were discarded and reprocessed. Single-cell suspensions were immediately used (M. tuberculosis) or frozen at −80 °C (M. abscessus clinical isolates).
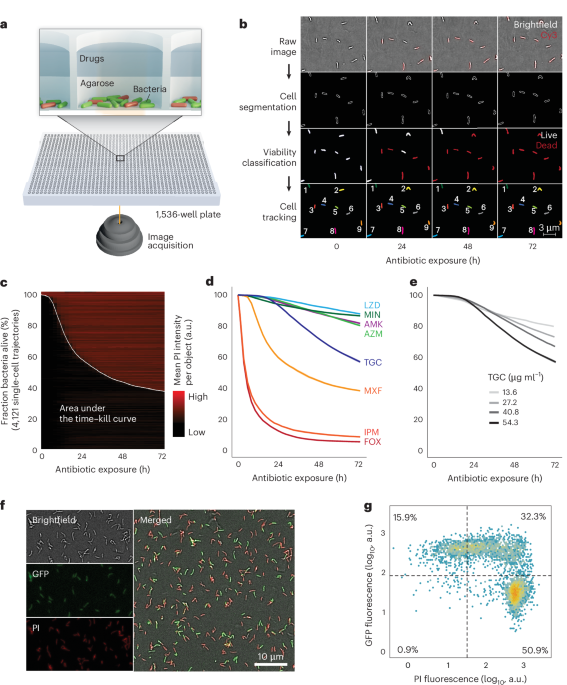
ASCT uses a dual-layer approach: the first layer consists of an agar pad containing and immobilizing bacteria, and the second layer comprises drug-containing solutions (Fig. 1a). To prepare the agar pad, ultra-low gelling temperature agarose (ULGA; Lonza SeaPrep) and Middlebrook 7H9 were dissolved in hot dH2O. Additional dissolution was facilitated through heating, where any evaporated water was replaced to maintain constant 7H9 and agarose concentrations. Once the solution cooled to 50 °C or lower, OADC and glycerol were added. The mixture was then filtered through a 0.22 µm filter and propidium iodide was added. This agarose solution was aliquoted as needed. The final gel pad solution contained 0.4 agarose, 1× Middlebrook 7H9, 10% OADC, 0.4% glycerol, 8 µg ml−1 propidium iodide and ~5 × 10⁶ bacteria per ml. For non-starving M. tuberculosis mc27000, the agar pad also contained 100 µg ml−1 pantothenate. In pantothenate-starvation conditions, the gel pad did not contain pantothenate, and in PBS-starvation media, all supplements were replaced with 1× PBS.
All preparations were made in 96-well plates using a 96-channel pipette (Mini96, Integra Biosciences). Of the isolate–agar–PI solution, 7 µl was dispensed, using liquid handling (I.DOT, Dispendix), into each well of a 1,536-well plate (Greiner, Screenstar). At least one column and row were left as buffer wells at the edges. All materials used in the agarose preparation, including chemicals, pipette tips, filters, the plate and so on, were preheated to 37 °C. The 1,536-well plate was centrifuged at 37 °C and 3,000 g for 30 min to position the bacteria at the bottom of the wells for imaging. This step was followed by cold centrifugation at 4 °C and 1,500 g for 20 min to solidify the ULGA. After leaving the plate for 30 min at room temperature, a defined drug solution (4 µl) dissolved in Middlebrook 7H9 or PBS (for PBS starvation) was added to each well. The plate was then sealed with parafilm, covered with a lid and remained for another 60 min at room temperature before being placed into the microscope’s preheated live-cell chamber (37 °C; Life Imaging Services). To evaluate the impact of gel pad volumes and concentrations on antibiotic killing, we tested various volumes (4, 5, 6 and 7 µl) and concentrations (0.3, 0.4 and 0.5%; Extended Data Fig. 1g,h).
Images were captured with a Nikon Ti2-E inverted microscope using a CFI Plan Apo Lambda ×40 NA 0.95 or a CFI Plan Apo Lambda ×100 NA 1.45 objective, and the Perfect Focus System for maintenance of the focus over time. PI fluorescence was excited with a Spectra III Light Engine (Lumencor) at 555 nm and collected with a penta-edge 408/504/581/667/762 dichroic beam splitter and a 440/40, 520/21, 606/34, 694/34, 809/81 penta-bandpass filter. Images (×40 12-bit and ×100 (optionally with ×1.5 zoom lens) 16-bit) were acquired with a Photometrics Kinetics camera, controlled with the Nikon NIS acquisition software. For ×40, the fluorescence excitation light intensity was set to 10% and the camera exposure time to 20 ms, and the brightfield illumination light intensity was set to 50% and the camera exposure time to 8 ms. These settings were kept the same for all experiments and conditions for comparability. For ×100 acquisition, the excitation light intensity and camera exposure were adjusted accordingly.
The NIS JOBS module was used for image acquisition automation. Briefly, 9 equally spaced fields of view for each well and imaging timepoint were acquired. For M. abscessus, images were captured every 2.5 h for a total duration of 72 h and 29 timepoints; for M. tuberculosis, images were acquired every 4 h for a duration of 168 h (42 timepoints in total). Imaging one timepoint took ~130 min (1,260 wells with 9 fields of view per well). At the end of image acquisition, imaging data (M. abscessus: up to 11,340 movies and 7.8 TB per experiment; M. tuberculosis: up to 11 TB per experiment) were transferred to the high-performance computing cluster at the University of Basel (sciCORE) for subsequent image and data analysis.
To evaluate ASCT-based time–kill kinetics of M. tuberculosis, we exposed M. tuberculosis to previously published drug combination regimens30,31 at the maximum blood concentration (Cmax) achievable during therapeutic dosing in humans (9 replicates for each condition): bedaquiline 1.1 µg ml−1, clofazimine 1.25 µg ml−1, delamanid 0.5 µg ml−1, ethambutol 4 µg ml−1, isoniazid 4.5 µg ml−1, linezolid 19 µg ml−1, moxifloxacin 4 µg ml−1, pretomanid 7.8 µg ml−1, pyrazinamide 40 µg ml−1, rifampicin 16 µg ml−1, rifapentin 19 µg ml−1, SQ109 0.026 µg ml−1 and sutezolid 1.48 µg ml−1.
For drug tolerance profiling, ASCT was performed on all clinical M. abscessus isolates using a standardized panel of eight antibiotics, regardless of the treatment each patient received. M. abscessus isolates were assessed within a single ASCT plate for a single antibiotic condition in triplicate. The drug concentrations used were based on the MICs for ATCC-19977, determined similar to CLSI criteria71. In contrast to CLSI, they were assessed in 7H9 supplemented with 0.4% glycerol, 10% OADC and 0.05% Tween 80 and quantified using OD600. Growth inhibition at increasing drug concentrations was fitted with a four-parameter log-logistic model using the R drc package73. The MIC was defined as the drug concentration that prevented 90% growth (IC90). Antibiotic time–kill kinetics for all 8 drugs were evaluated at 2 different drug concentrations: a lower concentration (10-fold the MIC of ATCC-19977) and a higher concentration (20-fold the MIC of ATCC-19977). The specific drug concentrations (low and high) tested were as follows: amikacin 26 and 52.1 µg ml−1, azithromycin 63.5 and 127 µg ml−1, cefoxitin 63.1 and 126.2 µg ml−1, imipenem 37.7 and 75.4 µg ml−1, minocycline 67.2 and 134.4 µg ml−1, moxifloxacin 8.5 and 17 µg ml−1, linezolid 38.5 and 77.1 µg ml−1, and tigecycline 27.2 and 54.3 µg ml−1.
ACST image analyses
Image processing of every image time-lapse (all imaging timepoints of a single field) consists of five individual image analysis steps: background control, cell segmentation, cell classification, drift correction and cell tracking.
To increase the accuracy of fluorescence intensity quantifications, we applied BaSiC, a method that automates background correction through low-rank and sparse decomposition via Fiji19,74. This method adjusts for spatial and temporal variations in background fluorescence, which commonly arise from uneven and repetitive illumination. Employing the default BaSiC settings, we achieved consistent fluorescence signals across different conditions, well positions and time (Extended Data Fig. 1b).
Bacteria were segmented using a combined pixel and object classification approach implemented in ilastik20. In the pixel classification task, each pixel was subjected to supervised random forest classifiers (100 trees) to differentiate between the background and cellular structures. Within the object classification task, the pixel classification map, estimating the probability of each pixel belonging to the background or cellular class, was smoothed and thresholds were applied to generate object features such as intensity statistics and shape descriptors. These features were used to train the following object classifiers: PI+ single cells, PI− single cells and clumps. Pixel and object classifiers were trained on ~30 time-lapses, including different M. abscessus strains and antibiotic conditions. These classifiers were then applied to all data (over 200,000 time-lapses) in batch mode. To assess the fate of PI+ and PI− bacteria upon antibiotic washout, we trained bacteria with ambiguous PI signals as an additional object class. This class was excluded from single-cell growth assessments. To validate segmentation accuracy, 3 randomly selected time-lapse datasets were manually annotated (with automated support) to generate ground-truth pixel prediction maps. The same time-lapses were then processed by ASCT pixel classification. Ground-truth and ASCT pixel classifications were compared using the ImageJ CLIJ2 plugin74. Segmentation accuracy (that is, object overlap) was quantified with the Jaccard Index (Extended Data Fig. 1a). To quantify PI classification accuracy, 1,600 PI-positive and 1,600 PI-negative single cells were manually annotated within 5 timelapse datasets, including different M. abscessus isolates and treatment conditions. The ASCT PI classification algorithm was than compared with manually annotated objects using the caret R package75 (Extended Data Fig. 1c).
To optimize downstream analysis and especially bacterial tracking, we corrected for any drift in imaging fields, which mainly occurred at the beginning of each experiment due to thermal changes (thermal drift). The drift of fields was determined by identifying the maximum cross-correlation between two consecutive images by shifting the subsequent image along the x and y coordinates. Drift correction for large-scale time-lapse data is computationally expensive. Therefore, we used smaller field sections (600 × 600 pixels rather than the 2,400 × 2,400 pixels of the whole field of view) and adapted the process to distinct imaging timepoints (frames), given that the drifts were minor after the initial imaging frames. We extracted a window of 600 × 600 pixels from the binary map of segmented objects in frame 0 (centred at c1 = (800,800)), the very first image of a time-lapse. We also extracted a window of 600 × 600 pixels from frame 2 and shifted this section, one pixel at a time, up to 200 pixels away from c1 in each direction, creating 401 × 401 windows. The windows from frame 1 were overlaid on the frame 0 window to find maximum alignment. Given that cells are not always uniformly distributed or can lose focus, the same strategy was performed with two other windows (c2 = (1,300,1,300) and c2 = (1,700,1,700)). The maximum of the cross-correlation across the 3 locations was used. From frame 3 onward, windows were shifted by fewer pixels to achieve a 75% alignment likelihood between the frames. The shifts were initially set to 25 pixels and consecutively adjusted to 25, 50, 100 and 200 pixels if the alignment likelihood was not achieved.
To automatically follow the behaviours of individual cells during the experiment, we established a custom script to track segmented objects across imaging frames. For each frame, we extracted object features from the segmentation output obtained via brightfield imaging using the MATLAB function ‘regionprops’. Our cell-tracking algorithm aims to link corresponding objects between the initial frame 0 and subsequent frames, with nt denoting an object n at timeframe t. Object homology H between frames was determined by comparing features of individual objects. A graph of linking objects (nt, n0) at frame t was represented by a 3-dimensonal tensor H(n0, n0 + N, t), where N0 is the population of objects at frame 0. The H tensors at each frame were composed of dissociation weights based on the following features: (1) the distances between centroids of objects nt and n0; (2) the changes in the area of objects; (3) changes in object orientation; and (4) changes in the convex hull area of the object. We assigned higher weight to distances (raised to the power of 4) and a weight of one to the other features.
$$\begin{array}{l}{H({n}_{0},{n}_{t},t)={\rm{Dist}}({\rm{cent}}({n}_{t}),{\rm{cent}}({n}_{0}))}^{4}\displaystyle\frac{|{\rm{Area}}({n}_{0})-\frac{{\rm{Area}}({n}_{t})}{{\rm{d}}{A}/{\rm{d}}{t}}|}{{\rm{Area}}({n}_{0})}\\ \,\,\,\displaystyle \frac{|{\rm{CoHull}}({n}_{0})-\displaystyle \frac{{\rm{CoHull}}({n}_{t})}{{\rm{d}}{A}/{\rm{d}}{t}}|}{{\rm{CoHull}}({n}_{0})}{\rm{ang}}({n}_{0},{n}_{t})\end{array}$$
(4)
All possible homology values were integrated into an object matrix. Rather than comparing each frame’s object to find the closest match, we employed a comprehensive local minimum strategy. The pair of two objects with the highest homology (lowest values in the matrix) was identified as a link in an array and subsequently removed from the matrix. This process was iteratively repeated to identify and remove further links until a homology threshold of 1 × 10⁸ was reached. This local minimum strategy allowed individual objects to be linked throughout the time-lapse to generate single-cell trajectories. Objects of abnormal size, merging objects, moving objects, objects that increased or decreased in object area, objects with swapping labels, or objects that were not tracked for more than two frames within the time-lapse were discarded. Wells with less than 1,000 tracked bacteria for M. abscessus and less than 500 tracked bacteria for M. tuberculosis were discarded. The time of PI positivity of a single cell was defined as the first PI+ frame of two consecutive PI+ frames.
ASCT data analyses
After quantifying the morphology and viability trajectories of each bacterium, the imaging data were further analysed. Bacterial growth in ASCT was defined as an increase in total object area greater than 3.1-fold during antibiotic exposure. This threshold was first defined by comparing growing and non-growing cells and then validated in M. abscessus isolates with and without inducible macrolide resistance during azithromycin exposure (Extended Data Fig. 1d). If growth was detected in two-thirds or more of the replicates for a given isolate–drug condition, the condition was considered growing and removed from the killing analyses.
The reproducibility of M. abscessus time–kill kinetics was assessed by comparing live-cell fractions at distinct timepoints (3, 6, 9, 12, 24, 36, 48, 60 and 72 h). Exact live-cell fractions at given timepoints were interpolated from overall time–kill kinetics. The coefficient of variation (CoV) was calculated for each triplicate at every timepoint. All triplicates were included in downstream analyses if the mean CoV of all 3 replicates fell within 3 s.d. of the overall mean triplicate CoV distribution per drug condition. Triplicates exceeding this threshold were reduced to the best-performing duplicate. These duplicates were retained if their mean duplicate CoV was within 3 s.d. of the overall mean duplicate CoV per drug condition; otherwise, the isolate–drug pair was excluded from further analyses. A minimum of 2 reproducible time–kill curves per isolate–drug condition was required for downstream analyses of M. abscessus kill analyses. To assess for outliers in our M. abscessus drug tolerance assessment, we performed principal component analyses for every antibiotic condition on the basis of live-cell fractions at 3, 6, 9, 12, 24, 36, 48, 60 and 72 h. Isolate–drug conditions with a distance of more than 3 s.d. from the mean, assessed with Mahalanobis distance and calculated using the first 2 principal components, were excluded from further analyses. In total, 957 (14.7%) M. abscessus isolate–drug pairs were excluded from time–kill analysis due to bacterial growth (mostly azithromycin and minocycline) and 156 (2.4%) due to poor reproducibility or being outliers. Due to the larger number of replicates, the strategies to account for reproducibility and outliers were not applied to M. tuberculosis.
Imaging data were acquired consecutively for each well at different timepoints. The live-cell fraction at 0 h (timepoint 0) was extrapolated by fitting a logistic function to the live-cell fractions from the first 5 imaging frames, corresponding to ~13 h (all conditions except imipenem and cefoxitin). Due to the rapid killing observed in imipenem and cefoxitin conditions, resulting in inaccurate fitting, the maximum live-cell fraction observed for each isolate in any of the other drug conditions was used as the isolate-specific live-cell fraction at 0 h. For M. abscessus, isolates with a live-cell fraction below 80% and isolates that had less than 1,000 cells per well across multiple wells were excluded from further analyses. Using the 0-h live-cell fraction, all frames were normalized to an initial live-cell fraction of 100%. Overall, antibiotic killing was quantified as the arithmetic mean of the area under the 72-h (M. abscessus) or 168-h (M. tuberculosis) time–kill curve, ranging from 1 to 0 (maximum survival to most rapid killing, respectively).
Drug tolerance analyses
We assessed the relationship between M. abscessus drug tolerance phenotypes, growth rates, lag times and MICs using Pearson correlation and R2 values. Spearman correlation was employed to examine the contribution of outliers. For drug clustering in drug tolerance space, a Spearman correlation matrix was generated on the basis of pairwise comparisons of the area under the time–kill curves from 350 clinical M. abscessus isolates. Only isolates with 4 or less missing drug tolerance values (out of 16) were used. Principal component analysis was applied to the correlation matrix to visualize drug clustering.
Single-cell growth assessment
We also applied the tracking algorithm to identify whether single cells are able to grow (form microcolonies) after antibiotic washout. To achieve tracking accuracy and computational efficacy, we employed a backward approach. We identified and categorized objects with a size 5–15 times the median size of single cells as microcolonies and recorded the area, appearance time and centroids. Analogous to the homology matrix to track single non-growing cells, we used the homology index to track microcolonies backwards to the final single-cell object, that is, the initial originating cell. We focused on two features: the object area, which is important particularly to track large objects, which grow and potentially move; and centroids, which are critical to track single non-moving cells. With this approach, we could determine whether specific objects generated microcolonies.
Whole-genome sequencing
M. abscessus isolates were cultured on solid media and colony sweeps were collected40,76. DNA extraction was performed using the Qiagen QIAamp DNA mini kit. DNA libraries were constructed with unique identifiers for each isolate and sequenced using multiplexed paired-end sequencing. De novo genome assemblies were assessed for quality. Assemblies with a length longer than 6 Mb, more than 300 contigs, an average depth below 30×, a coverage of the reference genome below 50%, or presumed mixed infection were discarded. Sequence reads were mapped to the M. abscessus ATCC-19977 genome using BWA, followed by INDEL realignment77,78. Single nucleotide polymorphisms (SNPs) and small insertions/deletions (INDELs) were identified using bcftools and annotated with SNPeff79,80. SNPs were filtered to require a minimum base call quality of 50, a minimum mapping quality of 20, and at least 8 matching reads covering an SNP (3 per strand). To assess larger deletions, ATCC-19977 was partitioned into regions of 20 bp with 10 bp overlaps39. The coverage of these regions in clinical isolates was assessed with sambamba81. Large deletions were defined as 2 consecutive windows with a mean coverage of 5× or below, occurring in at least 5% of all genomes. Variants with identical distributions were collapsed into a single variant. Maximum-likelihood trees were generated using FastTree, inferred from core SNPs and visualized with iTOL82,83. Mutational aminoglycoside resistance was evaluated with mutations in the rrs genotype and macrolide resistance with mutations in rrl84,85.
Heritability estimations
Unitigs for all isolates were extracted using the unitig-caller tool, which utilizes an FM-index built around the Bifrost API51,86. A similarity matrix was generated from phylogenetic distances, which was then used to correct for population structure. Using pyseer, FaST linear mixed models were applied to estimate narrow-sense heritability (h2), representing the proportion of variance in the phenotype attributable to genetic variation50. Random chance was assessed by shuffling each drug tolerance phenotype across M. abscessus isolates and calculating heritability (10 times for each drug tolerance phenotype; 160 times in total).
Phenogenomic analysis
We performed genome-wide association studies (GWAS) to analyse ~300,000 M. abscessus genetic variants, including SNPs, INDELs and large deletions, in relation to drug tolerance phenotypes. Variants were classified by presumed genetic effects: low effect (intergenic variants, synonymous SNPs), moderate effect (non-synonymous SNPs, inframe INDELs) and high effect (frameshift variants, start/stop alterations, large deletions). We applied linear mixed models to account for population structure, integrating a relatedness matrix, and quantified associations using the Wald test39,87. We used a Bonferroni threshold of 1.7 × 10⁻⁷ to control for multiple hypothesis testing. To summarize GWAS hits, we extracted the top 5 genes showing the strongest association per phenotype (for moderate- or high-effect variants). The top associations of these genes with all tolerance phenotypes were then shown in a heat map (moderate- or high-effect variants). Associations were plotted using LocusZoom88.
GFP-induction experiments
M. abscessus ATCC-19977 was transformed with pUV15tetORm (Addgene, plasmid 17975; gift from Sabine Ehrt) to generate a reporter strain expressing GFP under the control of the tetracycline-inducible promoter Pmyc1tetO89. Broth cultures were grown in Middlebrook 7H9 supplemented with hygromycin (1 mg ml−1) until mid-log phase, after which hygromycin was removed. Single-cell suspensions were generated as described for ASCT and treated for 12 h in non-shaking culture conditions with amikacin (26 µg ml−1), cefoxitin (63.1 µg ml−1) or moxifloxacin (8.5 µg ml−1). Following treatment, antibiotics were washed off and bacteria were transferred to the ASCT platform containing 2 µg ml−1 anhydrotetracycline to induce GFP expression. Brightfield and fluorescence images (PI and GFP) were acquired for 12 h. An untreated, induced control sample was used for GFP and PI gating. For each channel, log10-transformed fluorescence intensities were fitted with a 2-component Gaussian mixture model using the Mclust function. Cell counts and proportions were determined per treatment and timepoint. Data were visualized as hexbin density plots (100 bins) of PI versus GFP intensity with overlaid thresholds.
Drug interaction assessments
To assess M. tuberculosis drug combinations, 13 drugs were combined in every pairwise combination using 9 × 9 checkerboards with log√2-fold dilution steps. Each condition was assessed using 4 technical replicates. Drugs were diluted in 7H9 medium, transferred to 384-well plates and inoculated with ~1.2 × 10⁵ c.f.u.s of the H37Ra strain per well. Plates were sealed and incubated at 37 °C with shaking at 250 r.p.m. After 21 days, OD600 was assessed and the bacterial fitness was determined as the background-corrected OD600 divided by the median OD600 of all growth control wells per plate. Single drugs and pairwise dose–response curves were fitted with a 4-parametric log-logistic model (drc R package). Pairwise interaction scores were determined using only the equipotent concentrations90 and further used to predict high-order interactions38. Bliss interaction scores of high-order combinations were determined by computing the deviation between the predicted high-order curve (derived from measured pairwise interactions) and the bliss-independent expectation of the single-drug effects. Deviations were expressed as log2 interaction strengths. To evaluate the combined predictive performance of interaction and MIC parameters (median MIC), a logistic regression model was implemented using the glm function in R. Models predicted binary outcomes (similar or better than SOC) in relapsing and bactericidal mouse models. Predictive performance was evaluated across 50 bootstrap iterations (randomly sampling 80% of the conditions), with mean ROC-AUC values assigned to each predictor. Statistical significance was evaluated using a z-test against the null hypothesis of random performance (AUC = 0.5).
Resazurin assay
As an alternative proxy of antibiotic killing, we measured the reduction of resazurin to resorufin in M. tuberculosis mc27000 across all drug regimens. M. tuberculosis growth and starvation conditions were prepared as described for ASCT. Approximately 5 × 10⁶ bacteria suspended in 49.5 µl 7H9 were dispensed per well into clear, flat-bottom 384-well plates and exposed to 0.5 µl drug solution. Drug regimens and concentrations were identical to those tested in ASCT. Each condition was tested in quadruplicate and included medium only and untreated bacterial controls. Plates were sealed with parafilm and incubated at 37 °C in a non-shaking incubator. At days 0, 7 and 14, selected plates were removed and 5 µl of a 0.13% resazurin stock solution was added to each well. After further incubation at 37 °C for 12 h, plates were briefly opened to reduce condensation before fluorescence was measured (excitation 560 nm, emission 590 nm) on a Synergy H1 plate reader (BioTek). Mean relative fluorescence units (RFUs) were background corrected. Antibiotic killing was quantified as the RFU change between days 0 and 14, which was then compared with ASCT-derived killing and in vivo outcomes.
Generation of the MAB_0233 knockout mutant
MAB_0233 knockout mutants (ΔMAB_0233) were generated on the M. abscessus ATCC-19977 background using ORBIT54. pKM444 (RecT-Int-expressing plasmid, Kanr) and pKM496 (for gene deletion by integration into target gene, Zeor) were gifted by Kenan Murphy (Addgene, plasmid 108319 and 109301)54. pMV261 (replicative vector for gene complementation) was obtained from NovoPro Biosciences91. To amplify plasmids, Escherichia coli DH5α cells were grown on LB agar plates supplemented with 50 μg ml−1 kanamycin (pKM444 or pMV261) or 50 μg ml−1 zeocin (pKM496).
Liquid cultures of M. abscessus ATCC-19977 were incubated at 37 °C and 150 r.p.m. for 2 days. Cells were diluted to an OD600 of 0.03 in 20 ml of Middlebrook 7H9, supplemented with 0.4% glycerol, 10% OADC and 0.05% Tween 80 in a 250 ml baffled flask. The culture was placed at 30 °C and 100 r.p.m. for 18–20 h. The culture was then washed 3× with 20 ml ice-cold sterile 10% glycerol supplemented with 0.05% Tween 80 (washing solution). Following the third wash, the cells were collected by centrifugation and resuspended in 200 μl of washing solution. The ORBIT plasmid pKM444 (200 ng) was mixed with competent M. abscessus and rested on ice for 5 min. The cells were electroporated (2.5 kV, 1,000 Ω and 25 μF) using a 2-mm-gap-width electroporation cuvette. Following electroporation, the cells were resuspended in 1.5 ml Middlebrook 7H9 medium and placed at 30 °C and 100 r.p.m. for 18–20 h. The recovered cells were pelleted at 3,000 ɡ (25 °C, 5 min), resuspended in 100 µl Middlebrook 7H9 medium and plated on 7H11 plates supplemented with 0.5% glycerol, 10% OADC and 250 μg ml−1 kanamycin. The plates were incubated at 30 °C for 3–4 days.
Colonies resulting from pKM444 transformation were picked and grown on Middlebrook 7H11 agar plates supplemented with 0.5% glycerol, 10% OADC and 250 μg ml−1 kanamycin. Cells were collected by centrifugation and resuspended in TRIzol (Thermo Fisher). Cell disruption was performed by bead beating using Lysing Matrix B beads (200 µl) in a FastPrep-24 Classic instrument at 6.5 m s−1 for 60 s, followed by 60 s incubation on ice. This process was repeated for 3 cycles. Total DNA was extracted using the DNA miniprep kit (Zymo Research). The presence of the pKM444 plasmid was verified by PCR, using DreamTaq DNA polymerase (Thermo Fisher). Primers specific to the plasmid (forward: CACGTTGTGTCTCAAA ATCTC; reverse: CGATAACGTTCTCGGCTC) were used to amplify a target segment of the plasmid. PCR products were resolved by agarose gel electrophoresis, and bands of the expected size were excised and submitted for Sanger sequencing to verify plasmid presence.
The oligonucleotide sequence consists of the 48 bp Bxb1 attP site (or the reverse complement) flanked by 60 bp upstream of the initiation codon and 60 bp downstream of the stop codon54. The targeting oligonucleotide (sequence for MAB_0233: CGGCCACATGTTTTGTGCCGCT AGGGGAAATCAGCTCGGCATCGTCCGTGTGCCGTTGTTGGTTTGTACCGTACACCACTGAGACCGCGGTGGTTGACCAGACAAACCCACATACCCTGATGCGAGTTCAACTGCCATCTGTTGCCCCCTTCGGGCAATCGGTGCAGC) was acquired from IDT with 4 nmole Ultramer DNA Oligo property and diluted in nuclease-free water to 1 μg μl−1.
M. abscessus ATCC-19977, harbouring the pKM444 plasmid, was cultured in Middlebrook 7H9 medium with 5 µg ml−1 anhydrotetracycline (ATc). A 20 ml culture was prepared in a 250 ml baffled flask wrapped in aluminum, washed as described above and resuspended in 200 μl washing solution. Oligonucleotide (2 μl, 1 μg μl−1) guiding the payload plasmid pKM496 to the target gene was aliquoted into 1.5 ml microcentrifuge tubes and denatured at 95 °C for 5 min to prevent secondary structure formation. The denatured oligonucleotides were cooled on ice for at least 5 min before adding 200 ng pKM496 (ref. 54). Subsequently, 200 μl of cells were added to the tube, gently mixed by pipetting and incubated for 5 min. Electroporation, recovery and plating were performed as described above, except that recovered cells were plated on 7H11 plates supplemented with 100 μg ml−1 zeocin. DNA extraction and PCR were performed as described using primers flanking MAB_0233 and pKM496 (forward: CGCTCACAACTGAATACCC; reverse: CCTGGTATCTTTATAGTCCTGTC).
Gene complementation
To complement ΔMAB_0233, the gene was amplified by PCR (KAPA HiFi, high-fidelity enzyme) and cloned into pMV261 downstream of the mycobacterial strong constitutive promoter, pHSP60 (ref. 91). In addition, the T2 terminating region from E. coli rrnB was added to the end of the open reading frame (ORF) as an efficient terminator of transcription. To eliminate the pKM444 plasmid, which confers kanamycin resistance, the M. abscessus knockout strain ΔMAB_0233 was subjected to serial dilutions and growth cycles until cured. Cured strains were transformed with pMV261 following the same transformation protocol as described for pKM444.
As control, MAB-ATCC-pKM444 was used. The RNA of log phase cultures of the control strain, ΔMAB_0233 and ΔMAB_0233::MAB_0233 was isolated using the RNA miniprep kit (Zymo Research). Complementary (c)DNA was prepared using the High-Capacity cDNA Reverse Transcription kit (Applied Biosystems). cDNA levels were quantified by quantitative real-time PCR (qPCR) on an Applied Biosystems qPCR machine using a PowerUp SYBR Green Master Mix (Thermo Fisher) and analysed by the ΔΔCt method. Gene expression was controlled using the housekeeping genes MAB_3009 (sigA) and MAB_ 3869c. Two sets of primers covering ~150 bp sequences of the beginning and the end of the MAB_0233 ORF were designed (primer_1_FWD: GCGAAGCCTTCGCCAAAGCTC, primer_1_REV: CCTCGTTGAGCTTTTCCAGCGC, primer_2_FWD: CGCAACGTCTCCGATGGGAAACC, primer_2_REV: GAGTTGAGCGGCGTCCATGC).
Reporting summary
Further information on research design is available in the Nature Portfolio Reporting Summary linked to this article.