
If you’ve got a drawer full of old smartphones gathering dust and serving no purpose beyond taking up space, wouldn’t it be nice to breathe new life into one of those relics and make your old Android phone useful again? What do you think about having a dedicated PC performance monitor that sits elegantly beside your main display?
One app that makes this possible is Pitikapp, a free app that creates a wireless link between your Windows PC and an Android or iOS device. It provides a dedicated dashboard to monitor RAM, GPU, and CPU usage in real time without cluttering your primary screen.
![]()
OS
Android, iOS & WIndows
Developer
Cyril Caillaba
Price model
Free
Monitor your PC stats on a spare phone or tablet with Pitikapp. Connect wirelessly to display CPU, GPU, network, and system info right beside your main screen.
Pitikapp gives you desktop-grade monitoring without cluttering your screen
Stop alt-tabbing to check your temps and put that dusty Android to work
The idea behind Pitikapp is clever: your main monitor is far too precious to waste on task managers, temperature graphs, and other diagnostic clutter. Offloading that information to an external screen — namely, your forgotten phone — keeps your primary workspace clean while still giving you that “mission control” view of your PC’s vitals.
Despite how technical it sounds, the setup relies on a simple client-server arrangement. You run a small server app on your Windows PC and the mobile client on your Android phone. They perform a quick handshake over your Wi-Fi and, just like that, your phone is slurping up real-time telemetry without a single cable snaking across your desk.
To get things up and running, start on the PC by downloading the Server application from Pitikapp’s official site, then install and run it. It is important that when Windows Firewall asks, allow access for both Private and Public networks. If the server is blocked here, the phone will never see it.
With the desktop side sorted, grab the Pitikapp Remote Dashboard app from the Play Store. When you launch it, the app should automatically scan your network and flag your PC for connection. If it doesn’t, the backup plan is to just find your IP address on Windows and plug it in to force a manual connection. Once the link is established, your phone essentially becomes a window into your computer’s soul.
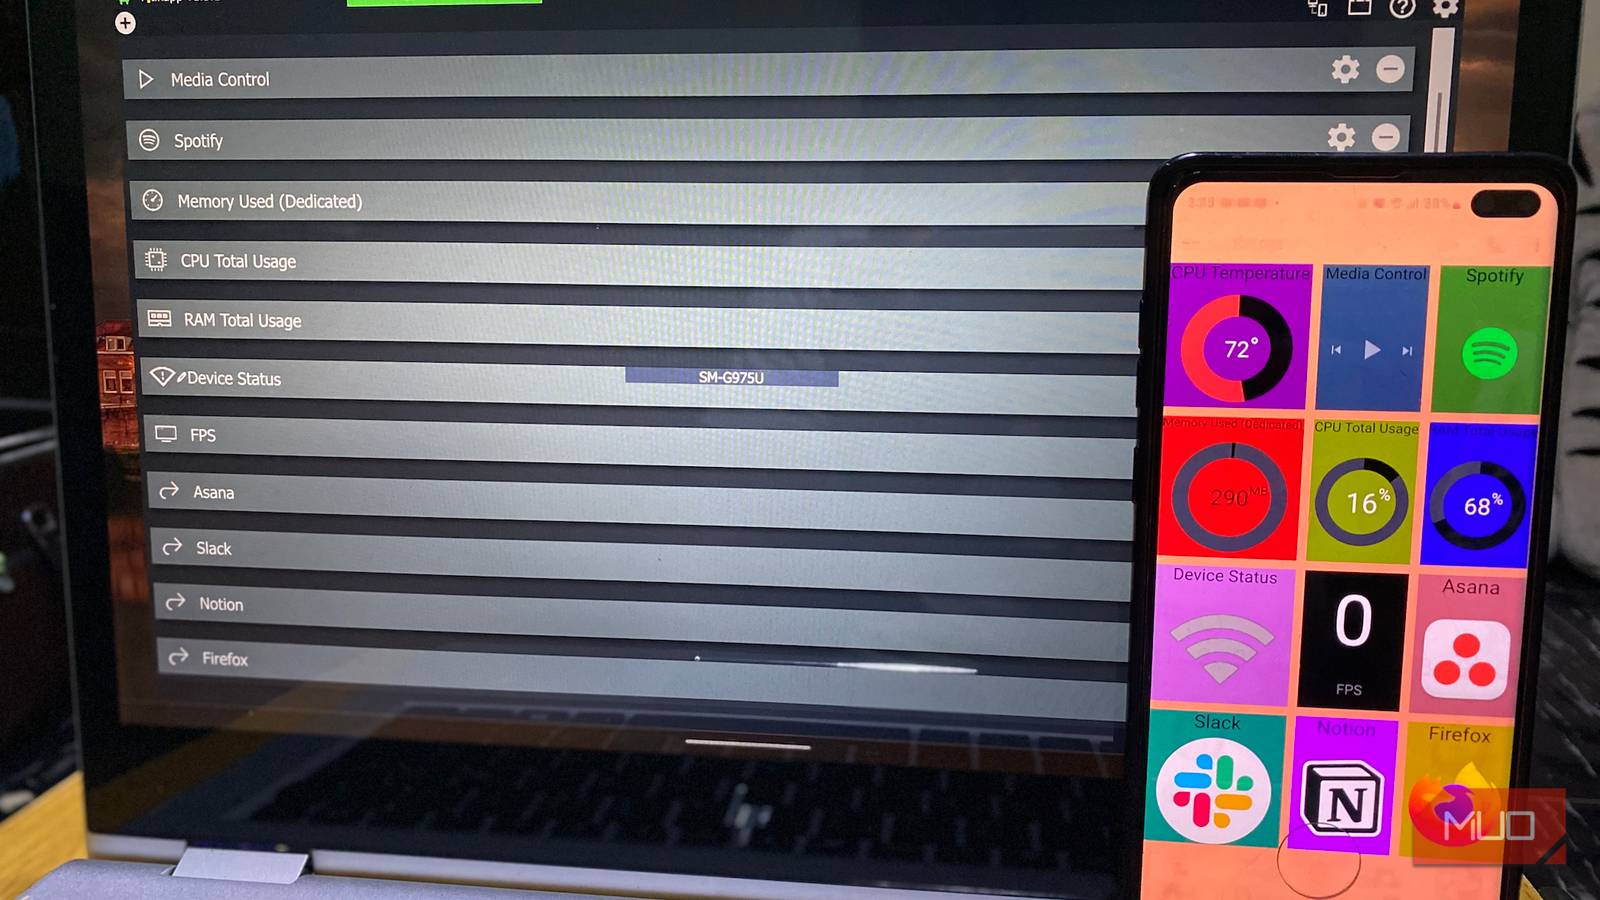
Most tools in this category only let you gawk at numbers, but Pitikapp goes a step further by blending monitoring with control. It uses libraries such as hardware sensors, GPU-Z, and MSI Afterburner to display important performance metrics, including CPU temperatures, fan curves, RAM usage, and frame rates. And because the interface is fully touch-enabled, it behaves more like a purpose-built peripheral than a static second screen — the kind of gadget you’d normally have to spend real money on if you wanted it as physical hardware.
Customization options let you create exactly the monitoring setup you need
Drag, drop, and design a dashboard to your taste
Now that we’ve gotten the installation out of the way, that’s only half of the work. The other half, and maybe by far, more technical, is configuring your monitoring feed on your old phone.
The customization process begins on your Windows PC, where the server application presents a comprehensive module library organized into logical categories. GPU-Z provides graphics card metrics; HW Monitoring delivers system-wide statistics; HWiNFO offers detailed hardware data; Pitikapp Misc provides utilities such as clocks and shortcuts; and Multimedia handles media controls.
Related
Every PC should have these free diagnostic apps installed
Know what’s going on within your computer.
As you select widgets on your PC, they instantly materialize on your Android device. For instance, if you want to check the CPU temperature, select it on the server, and it appears on your phone screen within moments. Once widgets appear on your mobile display, the physical customization begins. Press and hold any widget for approximately two seconds to switch it into edit mode. Now you can drag it anywhere on the screen, resize it to emphasize its importance, and arrange multiple elements into any layout that suits your workflow.
The configuration options for individual modules run deep. Each widget opens into detailed settings panels where you can adjust gauge types, choosing between percentage displays, absolute values like megabytes or RPM, or graphical representations. Visual customization includes position fine-tuning, size scaling (adjustable by percentage), and comprehensive color control via a full-spectrum picker that accepts hex codes for precision. Background colors can be set independently for each widget, allowing you to create visual groupings or color-code different types of information.
There’s also a threshold system that adds intelligence to your monitoring. You can establish multiple alert levels — typically Level 1 and Level 2 — each with distinct warning colors. Configure your RAM gauge to display blue under normal conditions, shift to yellow at 60% usage, and flash red at 80%. These visual cues mean you can monitor system health peripherally, catching problems in your peripheral vision without constantly checking numbers.
Pitikapp goes beyond monitoring with shortcuts and multi-profile support
Create a physical launchpad, from Slack to Steam
Beyond passive monitoring, Pitikapp’s control capabilities transform your repurposed phone into an active command center. The Multimedia section integrates with Spotify, provides universal media controls compatible with any player, and supports custom shortcuts. You can configure application launchers by specifying program paths and optional arguments, and then select custom icons to make them recognizable.
The mobile client offers its own layer of customization through comprehensive settings. Appearance controls include fullscreen mode, dark theme selection, individual widget backgrounds, grid alignment, and widget overlap permissions — giving you complete control over the dashboard’s aesthetic and spatial organization. The General tab handles device naming for easy identification across multiple devices, debug mode for troubleshooting, screen sleep prevention for always-on operation, and data reload behavior at startup. Network settings allow manual port configuration beyond the default 20948, while Startup options can automatically wake your screen when your PC boots.
Perhaps most elegantly, Pitikapp supports multiple profiles — entirely different dashboard configurations you can switch between. You can create one layout for gaming sessions, packed with GPU temperatures and frame rates; another for productivity work, focusing on CPU and RAM usage; and a third emphasizing media controls and application shortcuts. The profile system makes your monitoring setup adaptable to whatever you’re doing, rather than forcing a compromise on a single all-purpose layout.
This is probably the best PC upgrade you can make this year
I’ve been rocking this setup for a few weeks now, and it has been quite steady. I haven’t hit a single connectivity hiccup, and the telemetry updates are snappy—we’re talking maybe a second of latency, max. Besides, the whole stack is incredibly lightweight. It barely sips on system resources, which is crucial if you’re already redlining your hardware with intense workloads.
My dusty old handset has finally found gainful employment again — and frankly, it’s never looked sharper.