
Sign up for the Starts With a Bang newsletter
Travel the universe with Dr. Ethan Siegel as he answers the biggest questions of all.
One of the most difficult thing about being inside our own Universe is that we only get one perspective — from our location, here on Earth — to measure it from. We are stuck within our Solar System, as are all of our measuring tools and instruments, which in turn is stuck within the Milky Way, the Local Group, and our corner of the local Universe. We are stuck living in the now: 13.8 billion years after the Big Bang has occurred. If we want to understand what this Universe is, including what it’s made of, where it came from, and how it came to be the way it is today, this is the only perspective, location, and time at which we’re capable of making observations from. Despite how powerful it is, it’s also extraordinarily limiting.
That’s why, from a scientific point-of-view, we’re always attempting to use every trick we have:
every measurement technique,
every set of independent observations,
every theoretical tool in our arsenal,
and every piece of high-quality, relevant data that we can collect,
to try to puzzle it all out. In the quest to understand our Universe, one of the biggest questions we can ask is, isn’t just if our Universe is expanding, but how fast our Universe is expanding. There are two different values that different teams of observers (using different, independent methods) are coming up with:
67 km/s/Mpc, which is what you get if you use an “early relic” method such as the CMB or the BAO signature imprinted in our large-scale structure,
or 73 km/s/Mpc, which is what we get when we use a “distance ladder” method of beginning nearby and progressively measuring objects farther and farther away.
This conundrum, known as the Hubble tension, is perhaps the biggest unsolved puzzle facing cosmology today. But a new JWST program hopes to provide fresh insight into the problem through a totally novel method: using multiply-lensed supernova observations. Despite how it may sound, it’s perhaps the most promising new method currently being explored. Here’s how, despite the worst name in astronomy history for such an endeavor — VENUS (which already means something very different) — it just might yield the insights we need to help solve this great mystery.
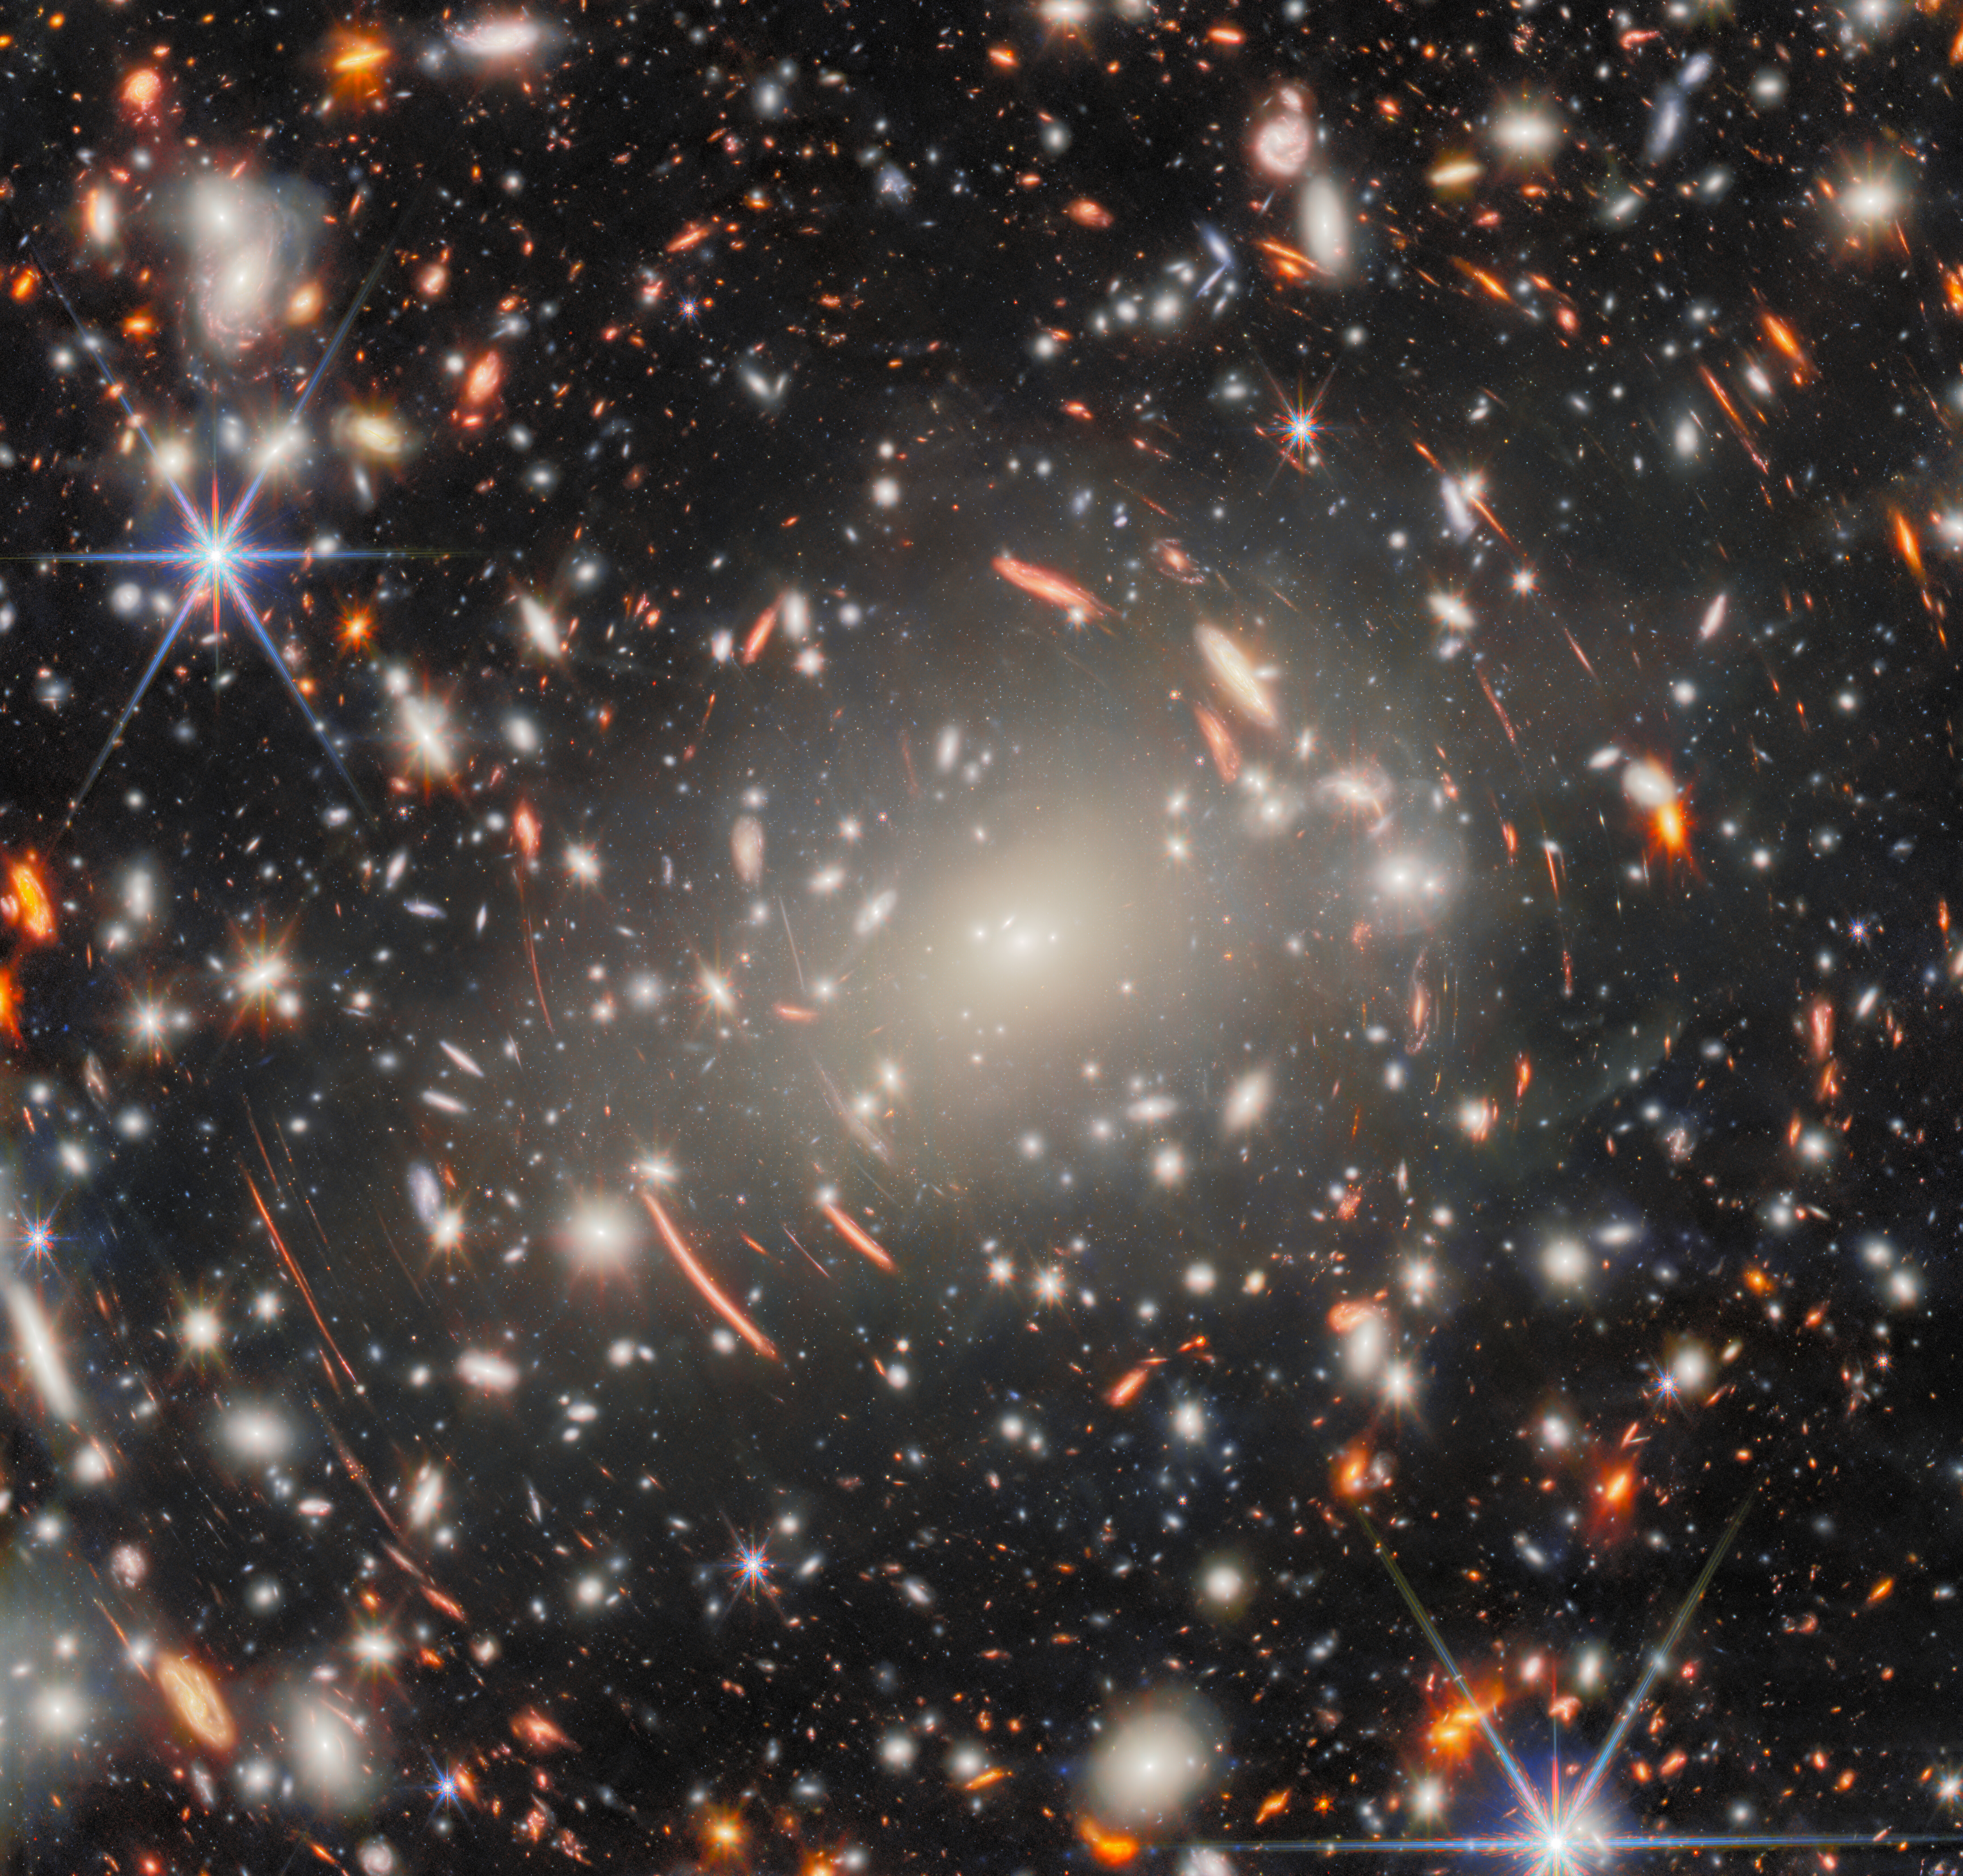
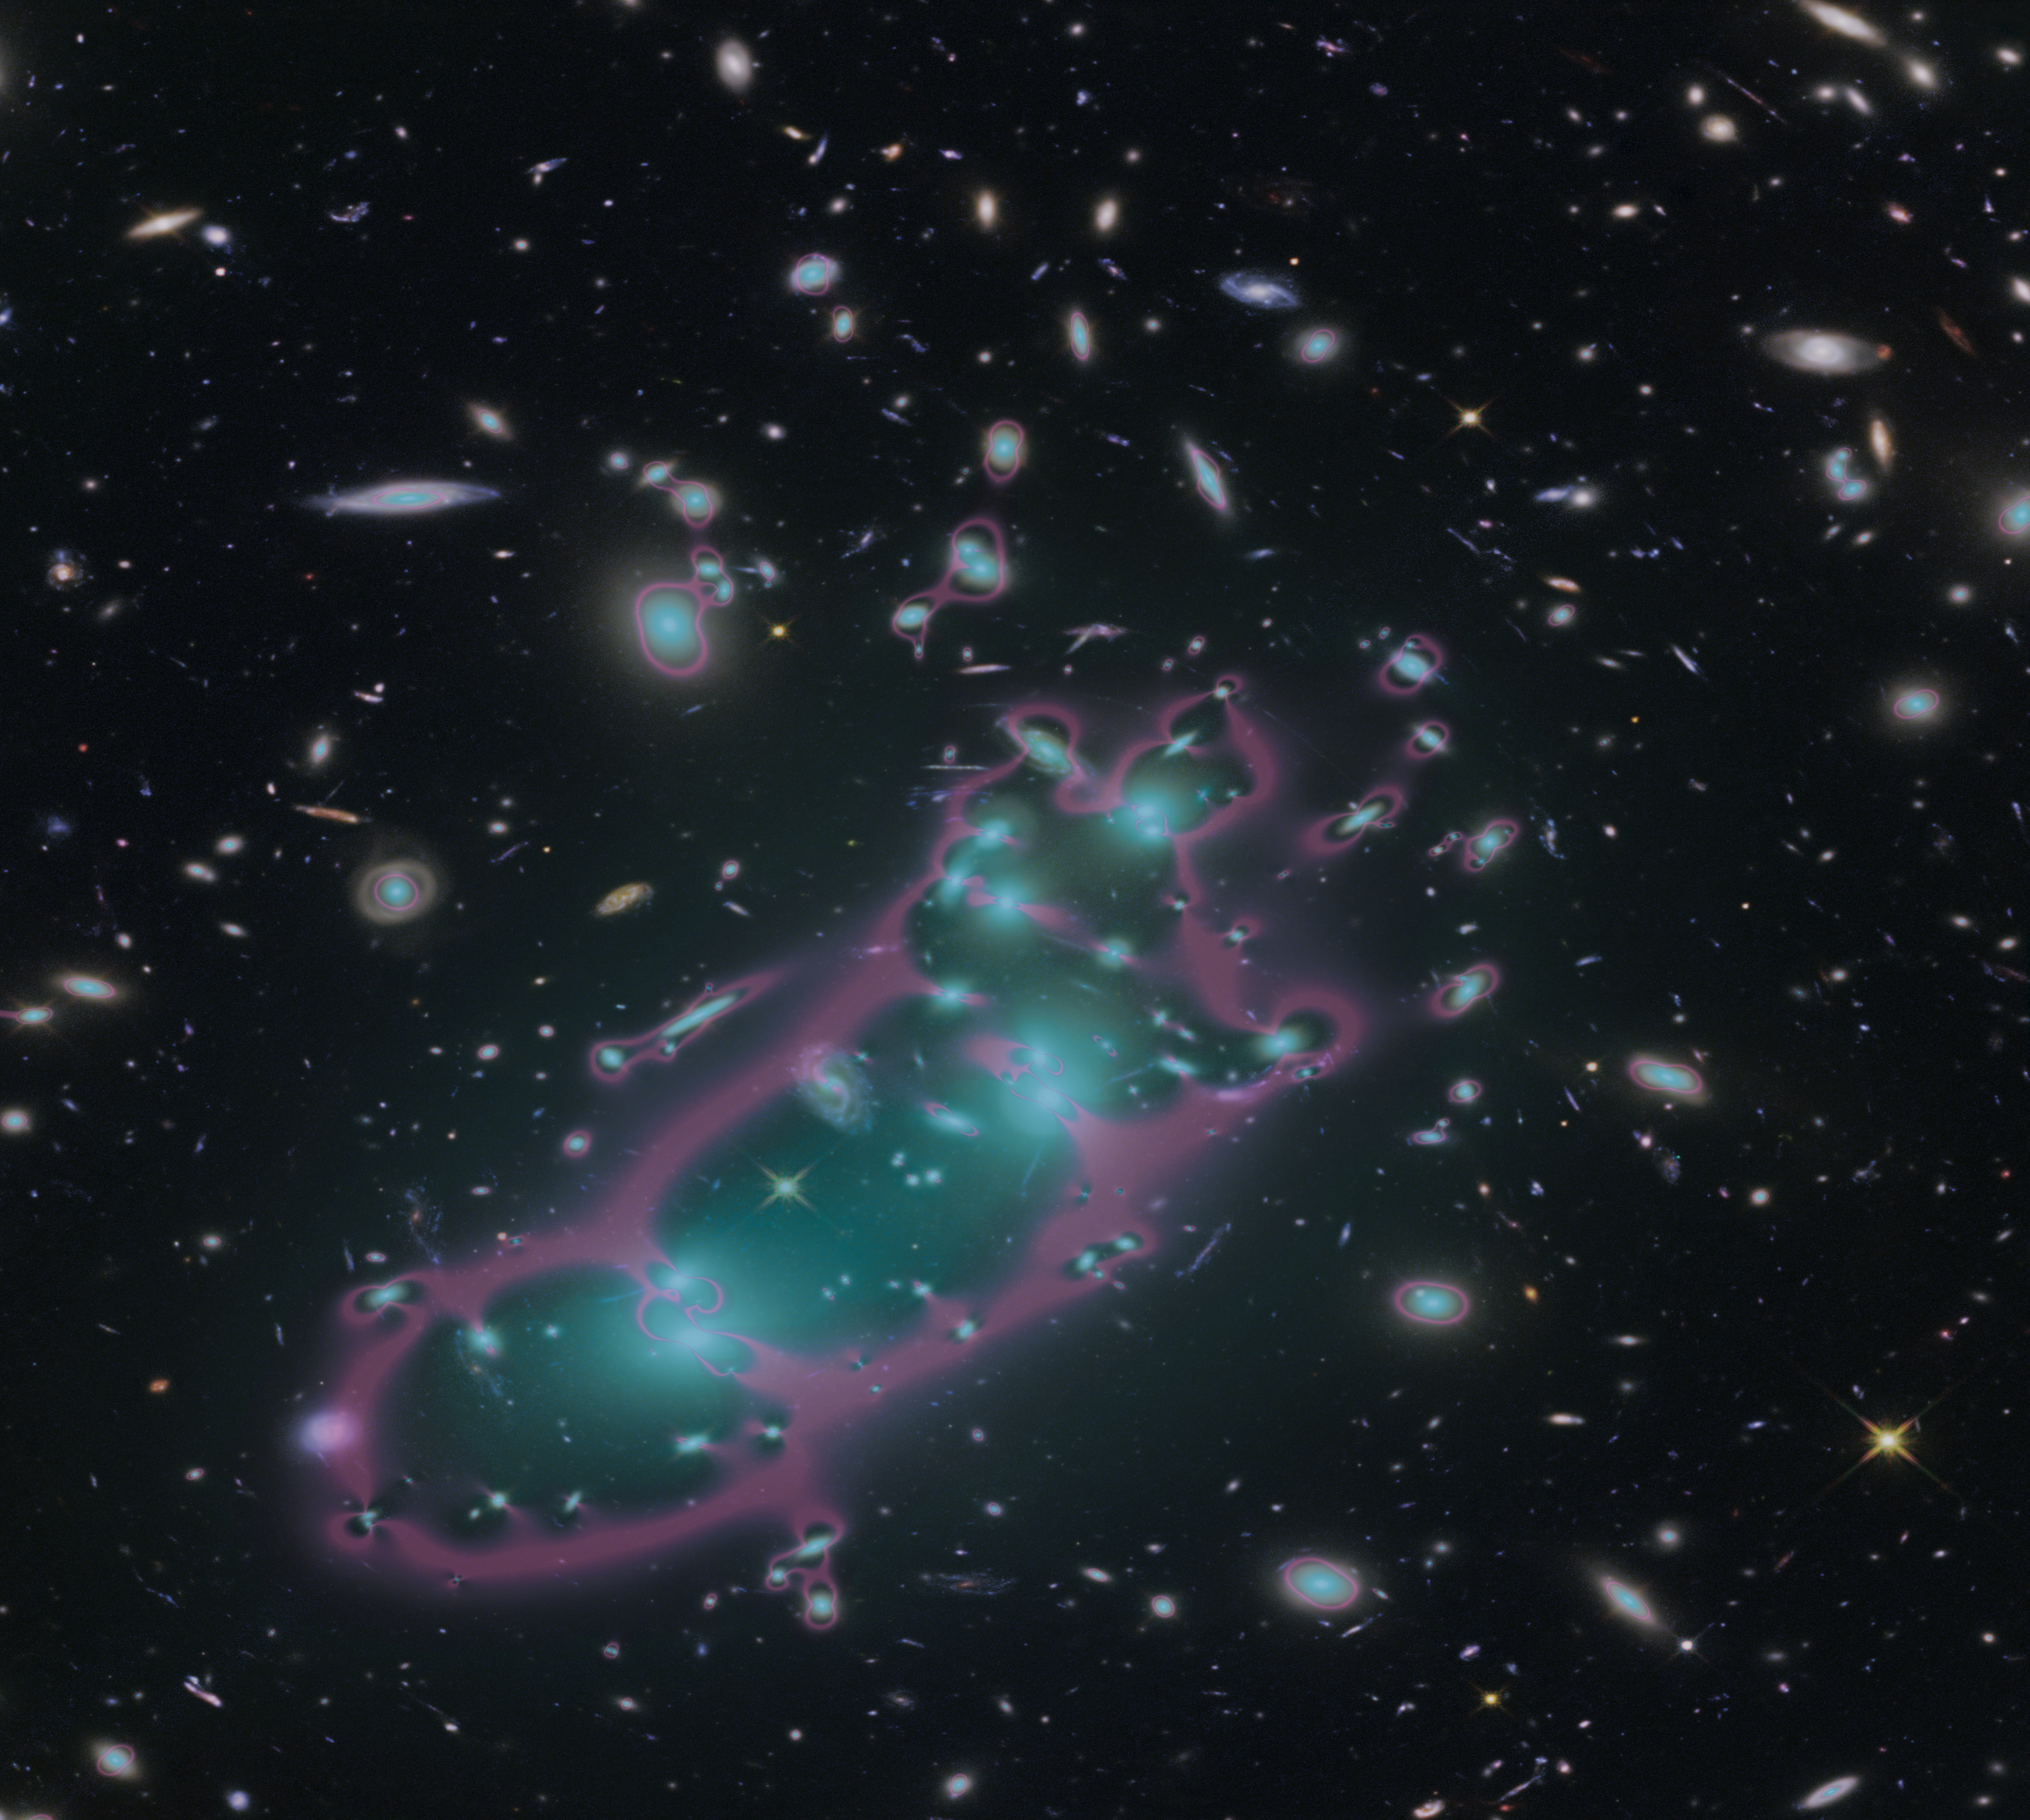
Imaged here in 9 different wavelength filters (from 0.9 to 4.8 microns) for a total of 120 hours, this JWST view of Abell S1063 is one of the most massive clusters ever imaged with deep field techniques. Many gravitationally lensed features can be clearly seen even with the naked eye, and the same background galaxy appears multiple times in several separate locations. Some lensed galaxies appear only twice, others appear three, four, or even five times.
Credit: ESA/Webb, NASA & CSA, H. Atek, M. Zamani (ESA/Webb); Acknowledgement: R. Endsley
One of the most spectacular phenomena in the Universe is illustrated above: gravitational lensing. There are two types of gravitational lensing, and both of them are on display in the JWST image above:
strong gravitational lensing, where the effects of gravity from a large foreground mass bend-and-distort the light from objects behind it, often creating multiple images, extreme magnification, and enabling multiple light-paths that show the same object to an observer several times,
and weak gravitational lensing, where the gravitational effects of foreground masses distort the shape of light sources behind it, stretching them into ellipsoidal shapes that arc around the central mass concentration.
Both effects can be theoretically predicted in Einstein’s General Relativity, and both effects can be mapped out observationally in the actual data from massive galaxy clusters that lens background objects. In our Universe, it’s the densest, most high-mass galaxy clusters that create the strongest lensing effects, and in turn lead to the greatest number of multiply-lensed and multiply-imaged background galaxies in a single field-of-view.
Because galaxies are hotbeds of supernovae, the locations with the greatest number of multiply-lensed galaxies, particularly if they’re rapidly star-forming galaxies, gives us our best chances to see multiply-lensed supernovae with time delays between the multiple images: where a supernova appears first in one image of a galaxy, and then, predictably, again at a later time in a subsequent image.
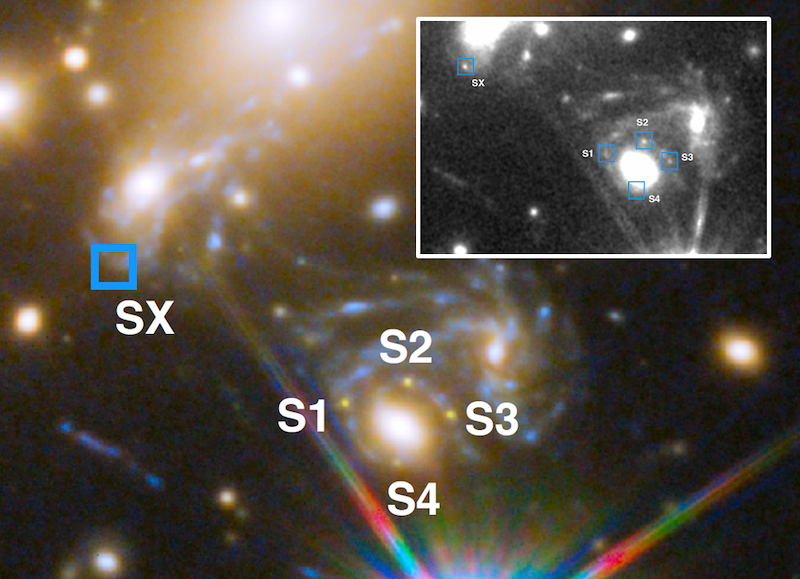
This Hubble telescope image shows the locations of the first four images (S1–S4) of a lensed supernova seen in late 2014: supernova Refsdal. A full 376 days later, astronomers detected a fifth image at the point SX. By using the time-delay information and the stretching of the light inferred by the time it’s arrived at our eyes, we can estimate the cosmic expansion rate. As we collect greater numbers of multiply-lensed supernovae, this could become a key method for measuring the cosmic expansion rate.
Credit: P. L. Kelly et al., Science, 2023
This effect was predicted long ago: back in the mid-20th century, before even the very first gravitational lens had been discovered. However, the first multiply-lensed supernova wasn’t actually spotted until 2014: nearly 25 full years into the Hubble era. This demonstration was remarkable, because it proved that the phenomena does indeed happen in our Universe. Moreover, this observed phenomenon offered an incredible cosmological hope to those of us who were interested in pinning down the expansion rate of the Universe: a novel, independent measurement of the expansion rate during the entire time that the light from the supernova was in motion along both light-paths.
The idea is as follows.
First, you find a multiply-lensed galaxy, one whose light arrives along at least two, and perhaps up to five or more, different light paths.
Next, you map out the foreground galaxy cluster as exquisitely as possible, and use the bent and distorted light from the observed objects behind it to reconstruct — using strong and weak lensing both — the mass distribution of the foreground lens, including lensing contours.
Then, you calculate the expected time-delay along the different light-paths, so that if you see a transient event (like a supernova) in one image, you’ll know where-and-when to expect it to appear in subsequent images.
And finally, you look for those key supernova events, and compare your predicted time delays with the observations, using the difference to calculate the amount that the Universe has expanded (and, also, the rate of cosmic expansion) from the moment the supernova went off until the light from it arrives in our eyes-and-instruments.
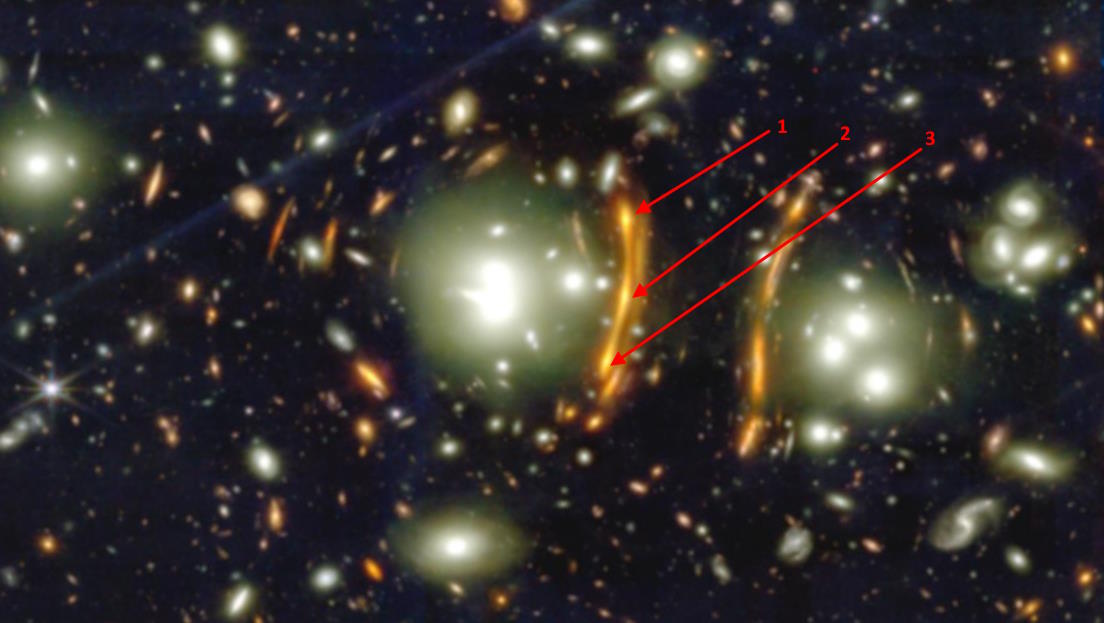
Here, galaxy cluster PLCK G165.7+67.0 is shown, with the features of background, gravitationally lensed galaxies appearing behind it. The big orange arc at left, called “Arc 2,” contains the second-most distant type Ia supernova, and it was seen by JWST on repeat in all three images, as annotated here. Sufficiently abundant supernovae can temporarily inflate a galaxy’s observed brightness.
Credit: B. Frye et al., ApJ submitted, 2023; Annotations: E. Siegel
The first multiply-lensed type Ia supernova was spotted in 2023 in a study led by Brenda Frye, and was immediately dubbed “supernova H0pe,” because it gave astronomers hope that the tension over the Hubble expansion rate (or H0) could indeed be resolved by exactly this method. Of course, one such supernova isn’t enough to do it, because there are errors and uncertainties associated with every single step. In fact, at the 247th meeting of the American Astronomical Society, a reanalysis of supernova H0pe was presented, and they found that the preferred value of H0 as inferred from this one event shifted by a whopping 4 km/s/Mpc: an incredibly large value when you consider that the argument is whether the true value is 67 km/s/Mpc or 73 km/s/Mpc.
The next step, therefore, isn’t just to better measure the next event that comes along, but rather to gather large numbers of statistics of these events. In most fields of science, and under this particular application as well, the size of your statistical error scales as 1/√N, where N is the number of independent data points that you have. If you have four data points instead of one, your error is halved; if you have 100 data points instead of one, your error is reduced by 90%. That’s why astronomers, particularly in the aftermath of the discovery of supernova H0pe, were so keen to use JWST’s powerful capabilities to survey the region around and within these massive galaxy clusters: to search for even greater numbers of multiply-lensed supernovae that exhibited these time delays.
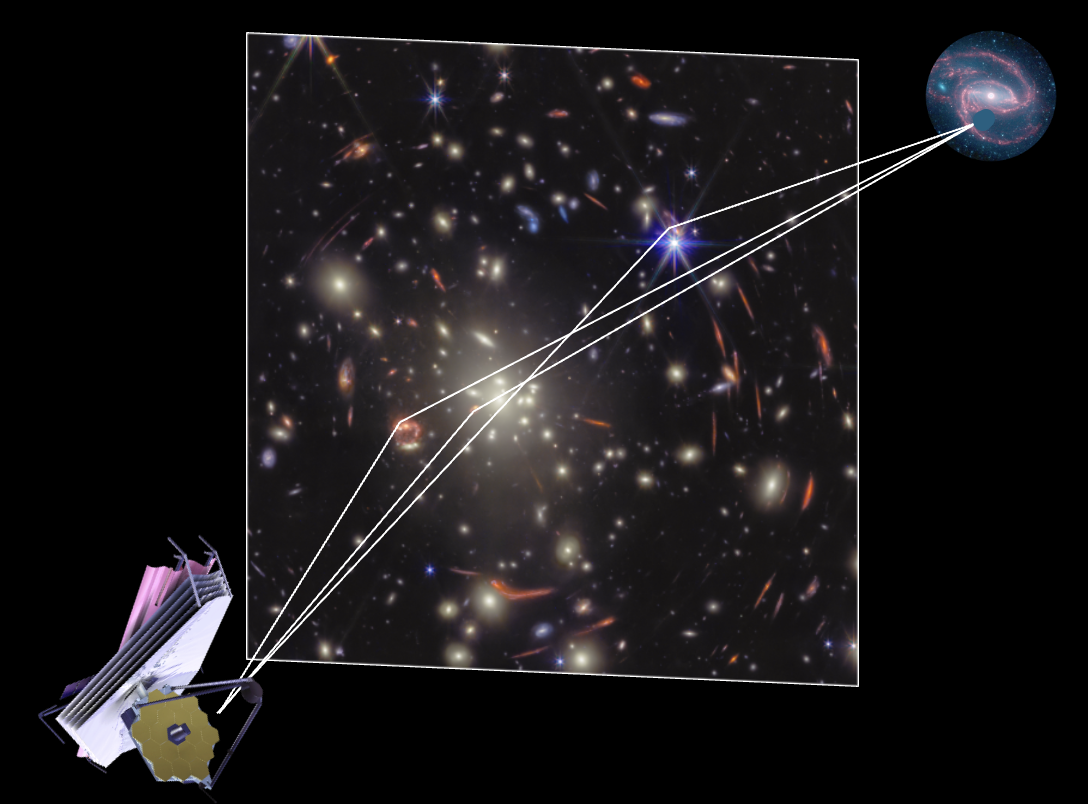
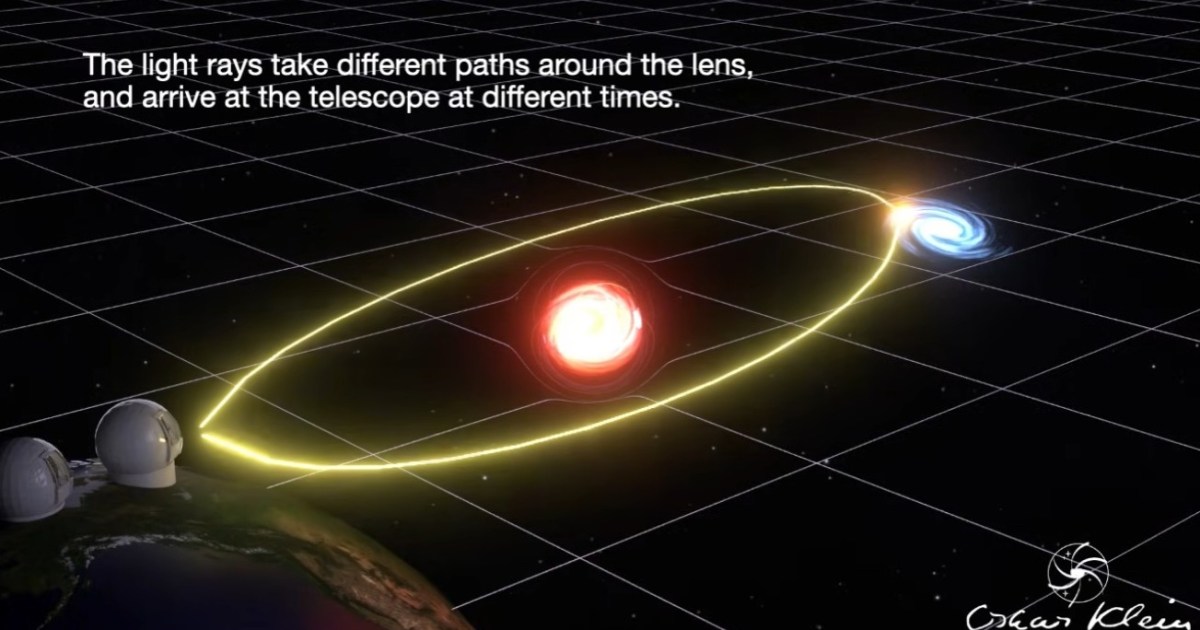
This illustration shows the geometry of a multiply-lensed galaxy containing a supernova. As the light leaves the galaxy, it can traverse multiple different light-paths spanning different overall lengths, enabling the light from the supernova to appear multiple times across multiple images with time-delays between each image. This technique can help better measure the expansion rate of the Universe, independent of either the distance ladder or early relic methods.
Credit: NASA/JWST/VENUS Collaboration
This was the ambition of the newly-created JWST VENUS Collaboration, where VENUS stands for the Vast Exploration for Nascent, Unexplored Sources. While it might be the worst, most misleading acronym in astronomy history — and that says a lot for a field that’s drowning in them — the project itself is actually amazing. A large number of distant, compact galaxy clusters have been found at this point in time, where a telescope or observatory like JWST is capable of imaging a large volume of strongly lensed space in a single pointing. In fact, there are nearly 100 good, known galaxy clusters that serve as excellent candidates for such a project.
The goal of VENUS, then, is to take a total of 300 hours of JWST observing time and to view, across many different wavelengths, up to 70 individual galaxy clusters multiple times over a span of two calendar years. The idea is to search for and identify:
multiply lensed galaxies,
whose images are magnified and brightness-enhanced by the lensing,
where ideally some of those galaxies are star-forming and good candidates for having a supernova go off within them,
and where the supernova will then appear at disparate times across the different images of the galaxy.
Ideally, these observations will reveal several multiply lensed supernovae that can be “caught in the act,” or where they’re observed rising on their way to peak brightness, which is what’s required in order to use this information to measure the rate of expansion of the Universe.
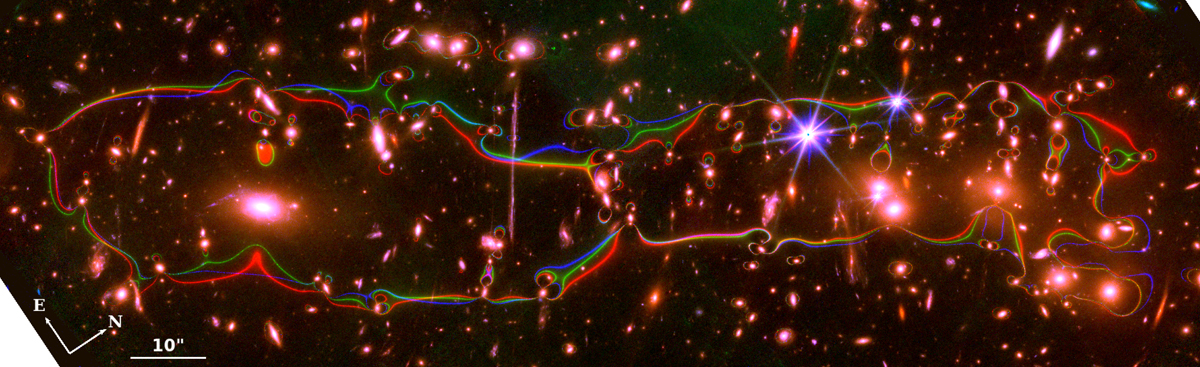
This image, using the combined data from JWST and Hubble, shows the newest gravitational lens models for the galaxy cluster El Gordo: ACT-CL J0102−4915. The three curves represent the surfaces of maximum lensing magnification for three different methods of mass reconstruction. All galaxy clusters have their own unique lensing magnification properties, providing maximum enhancement along specific contours. Differences between pre-collisional and post-collisional clusters is key evidence in the conclusion that dark matter is the leading explanation for what we observe in our Universe.
Credit: J.M. Diego et al. (PEARLS collaboration), A&A, 2023
In an exciting development, the VENUS collaboration just announced their first results, many of which were presented for the first time at the start of 2026 at the 247th meeting of the American Astronomical Society. Across the 70 or so clusters that were imaged, a total of six multiply-lensed supernovae were discovered. Sure, some of them weren’t particularly good for cosmology, or for measuring the expansion rate in particular. One of them involved a supernova that was already declining in its light-curve, or fading away, meaning that measuring the time-delay between the multiple images wouldn’t be possible.
Another, supernova Ares, was very interesting in a certain sense: a supernova was observed in one image of a distant galaxy, and then is predicted to reappear in another image of that same galaxy in the future, which is exactly what we want. Unfortunately, because of the severity not only of the lensing magnification, but also of the gravitational time dilation of the secondary light-path, that reappearance isn’t expected to occur until sometime in the 2080s: when all of the researchers that are currently a part of the VENUS collaboration will likely be retired or deceased. It’s a great opportunity to confirm whatever our picture of the Universe has become near the century’s end, but it’s unlikely to play a role in resolving the puzzle of the Hubble tension.
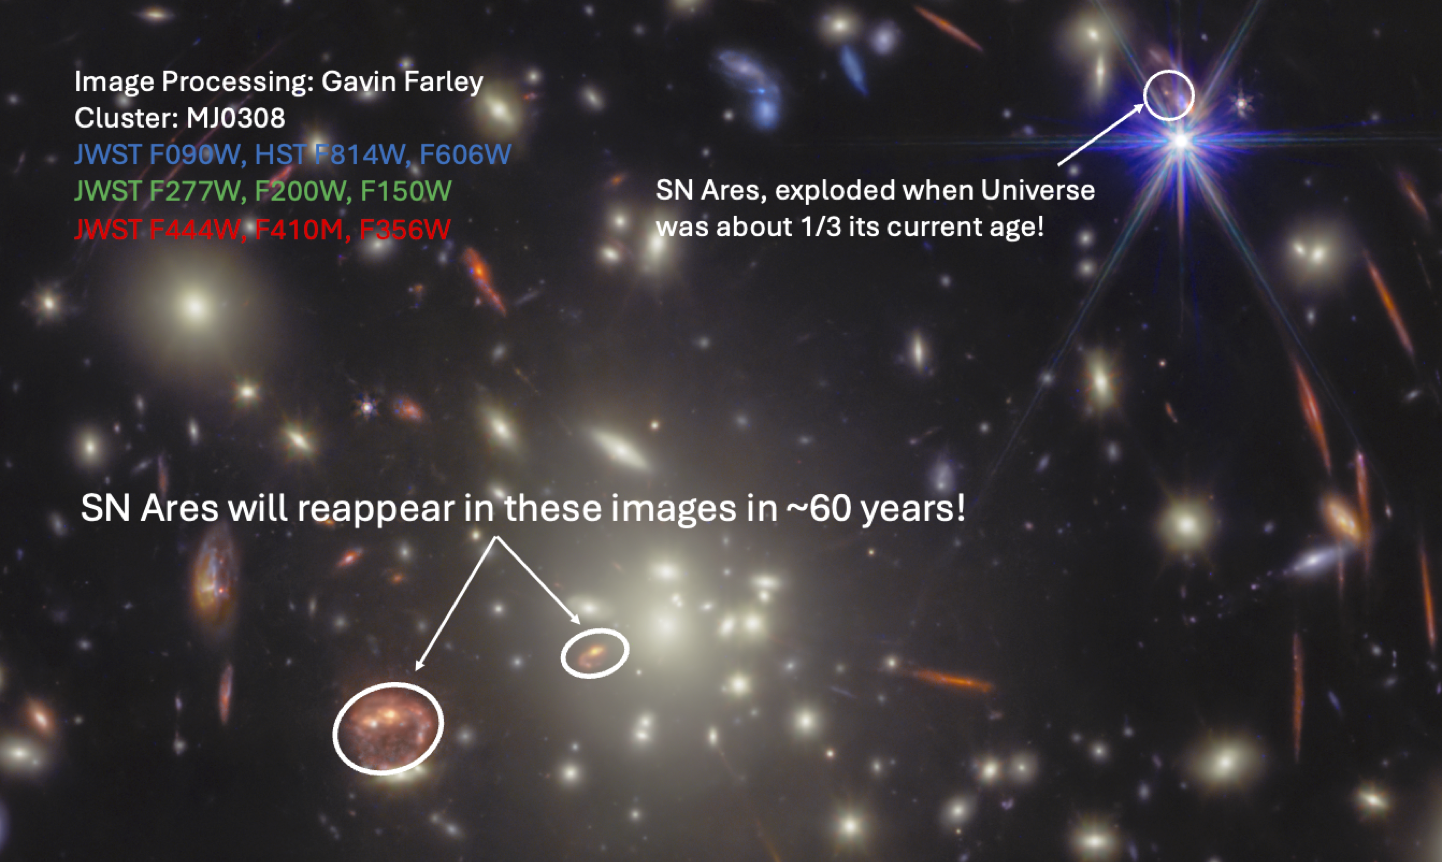
This multicolor image shows a region of interest within the galaxy cluster MJ0308, which was imaged as part of the VENUS collaboration’s work with JWST, and also includes Hubble imagery. Circled in white is the location of the same galaxy appearing multiple times, with one image displaying a supernova and the other image lagging behind, observationally, by about 60 years from our perspective. SN Ares, the supernova, will likely not play a role in helping us understand cosmology until the 2080s.
Credit: NASA/JWST/VENUS collaboration
It’s still a very cool discovery, of course. It’s one of the ten most distant supernovae ever discovered, and it displays by far the longest time-delay of any multiply lensed supernova ever found so far. With three total images, we’ll see it repeated twice in the future, albeit not for a very long time As early career scientist and VENUS member Dr. Conor Larison said,
“Such a long anticipated delay between images of a strongly lensed supernova has never been seen before and could be the chance for a predictive experiment that could put unbelievably precise constraints on cosmological evolution. It is hard to know what the key questions of the day will be in 60 years, but what is certain is that this reappearance will provide the most precise, single-step measurement of cosmology we have ever had the chance to make.”
Additionally, the six total supernovae across the first half of the VENUS collaboration’s images helps us better estimate two things:
the supernova rate across cosmic history, and how star-formation rate correlates with the supernova rate in distant galaxies,
and the total number of expected supernovae across the entirety of the VENUS survey’s observations, half of which remain to be taken.
Conservatively, if the first half of the observations netted six new supernovae, the second half of the observations should be expected to net 6 ± √6, or an expected 3.5-to-8.5 additional supernovae. In truth, only the data will decide, but each new supernova discovered is a new chance to better measure the expanding Universe.
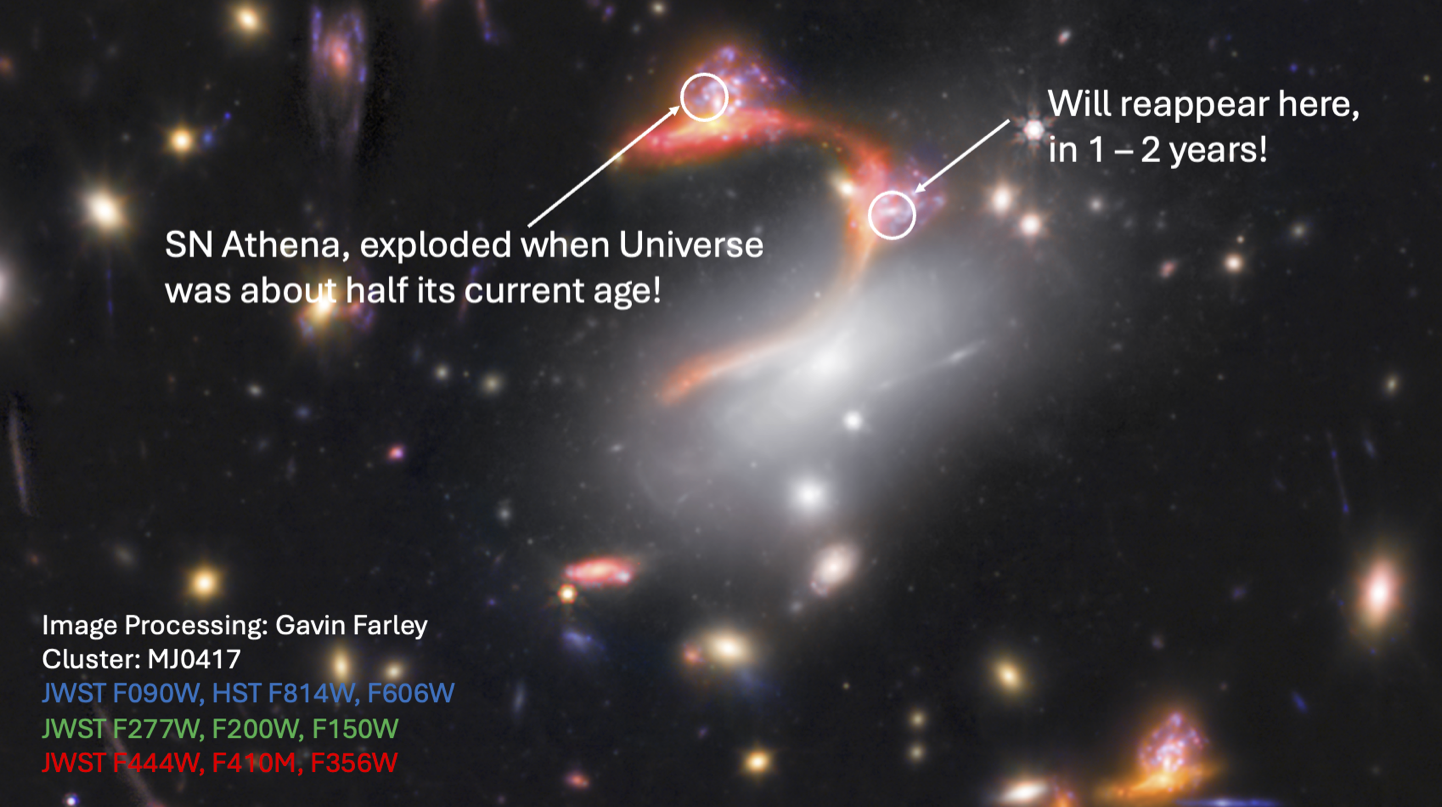
Supernova Athena (SN Athena), as discovered in the background of galaxy cluster MJ0417, appears as a narrow, snaky arc with brilliant sparkles shining off of it in two locations: two multiple images of the same background galaxy. While SN Athena, in the location of the arrow on the left, appeared in 2025, it is only expected to appear in the second image on the right after another 1-2 years have elapsed: a perfect candidate for time-delay cosmography in measuring the expanding Universe.
Credit: NASA/JWST/VENUS collaboration
However, it’s this last image, above, that has astronomers most excited right now. Within the galaxy cluster MJ0417, a supernova in an extremely distorted lensed galaxy was discovered: supernova Athena. Like SN Ares, SN Athena was discovered while it was still brightening in one of the images, enabling astronomers to pin down when it reached peak brightness: making it a good candidate to help constrain H0, or the expansion rate of the Universe. However, unlike SN Ares, the reappearance time of SN Athena in the other image, where it will appear once again on “repeat,” is just 1-2 years, meaning that subsequent JWST observations are almost certain to catch it in the act.
By making more exquisite measurements of the host cluster itself, as well as improving the detail about the background light sources that are affected by the foreground gravitational lens, we can make improved lensing maps, which in turn give us more information about magnification and time-delays, enabling us to determine our cosmological parameters from this event more precisely. And, of course, as we build up our statistics, we’re bound to get superior information about the overall expansion rate: in a fashion that won’t be subject to the uncertainties or errors that might plague any one particular system that we measure.
This gravitational lensing map of cluster Abell 2744, constructed by the CATS team and led by the efforts of Rachael Livermore, was the best reconstruction of a lensing map of this cluster based on Hubble data: prior to the release of JWST’s view of Abell 2744.
(Credit: STScI/NASA/CATS Team/R. Livermore (UT Austin))
Take a look above: at the lensing contours inferred from Hubble Space Telescope data just a decade ago, for galaxy cluster Abell 2744. As remarkable as this image is, and as exquisite as this lensing map is, the uncertainties on the lensing map are huge compared to the much smaller uncertainties we can derive with JWST-quality observations. Compared to Hubble, JWST:
has a much longer wavelength reach, meaning it can observe fainter, redder, and more distant background galaxies and cluster members,
has many more wavelength bands to operate in, better revealing the populations of stars, gas, and dust that live inside those galaxies,
is a higher-resolution observatory, meaning that it can reveal features more sharply and with smaller angular uncertainties,
meaning that we can make significantly better lensing maps with JWST data than we ever could in the Hubble era.
That means, as we continue to look at these galaxy clusters over time, the VENUS collaboration’s results will be just the beginning of this novel type of science. They’ll give us the first few handfuls of examples of multiply-lensed supernovae that can be used for the measurement technique known as time-delay cosmography, and perhaps the first high-quality, low-errors measurements of the expansion rate of the Universe using this novel technique. However, what it will truly do, and this is what’s really remarkable, is that it will set the stage for gathering enough supernovae to see whether it supports a high (73 km/s/Mpc) or low (67 km/s/Mpc) value for the cosmic expansion rate.
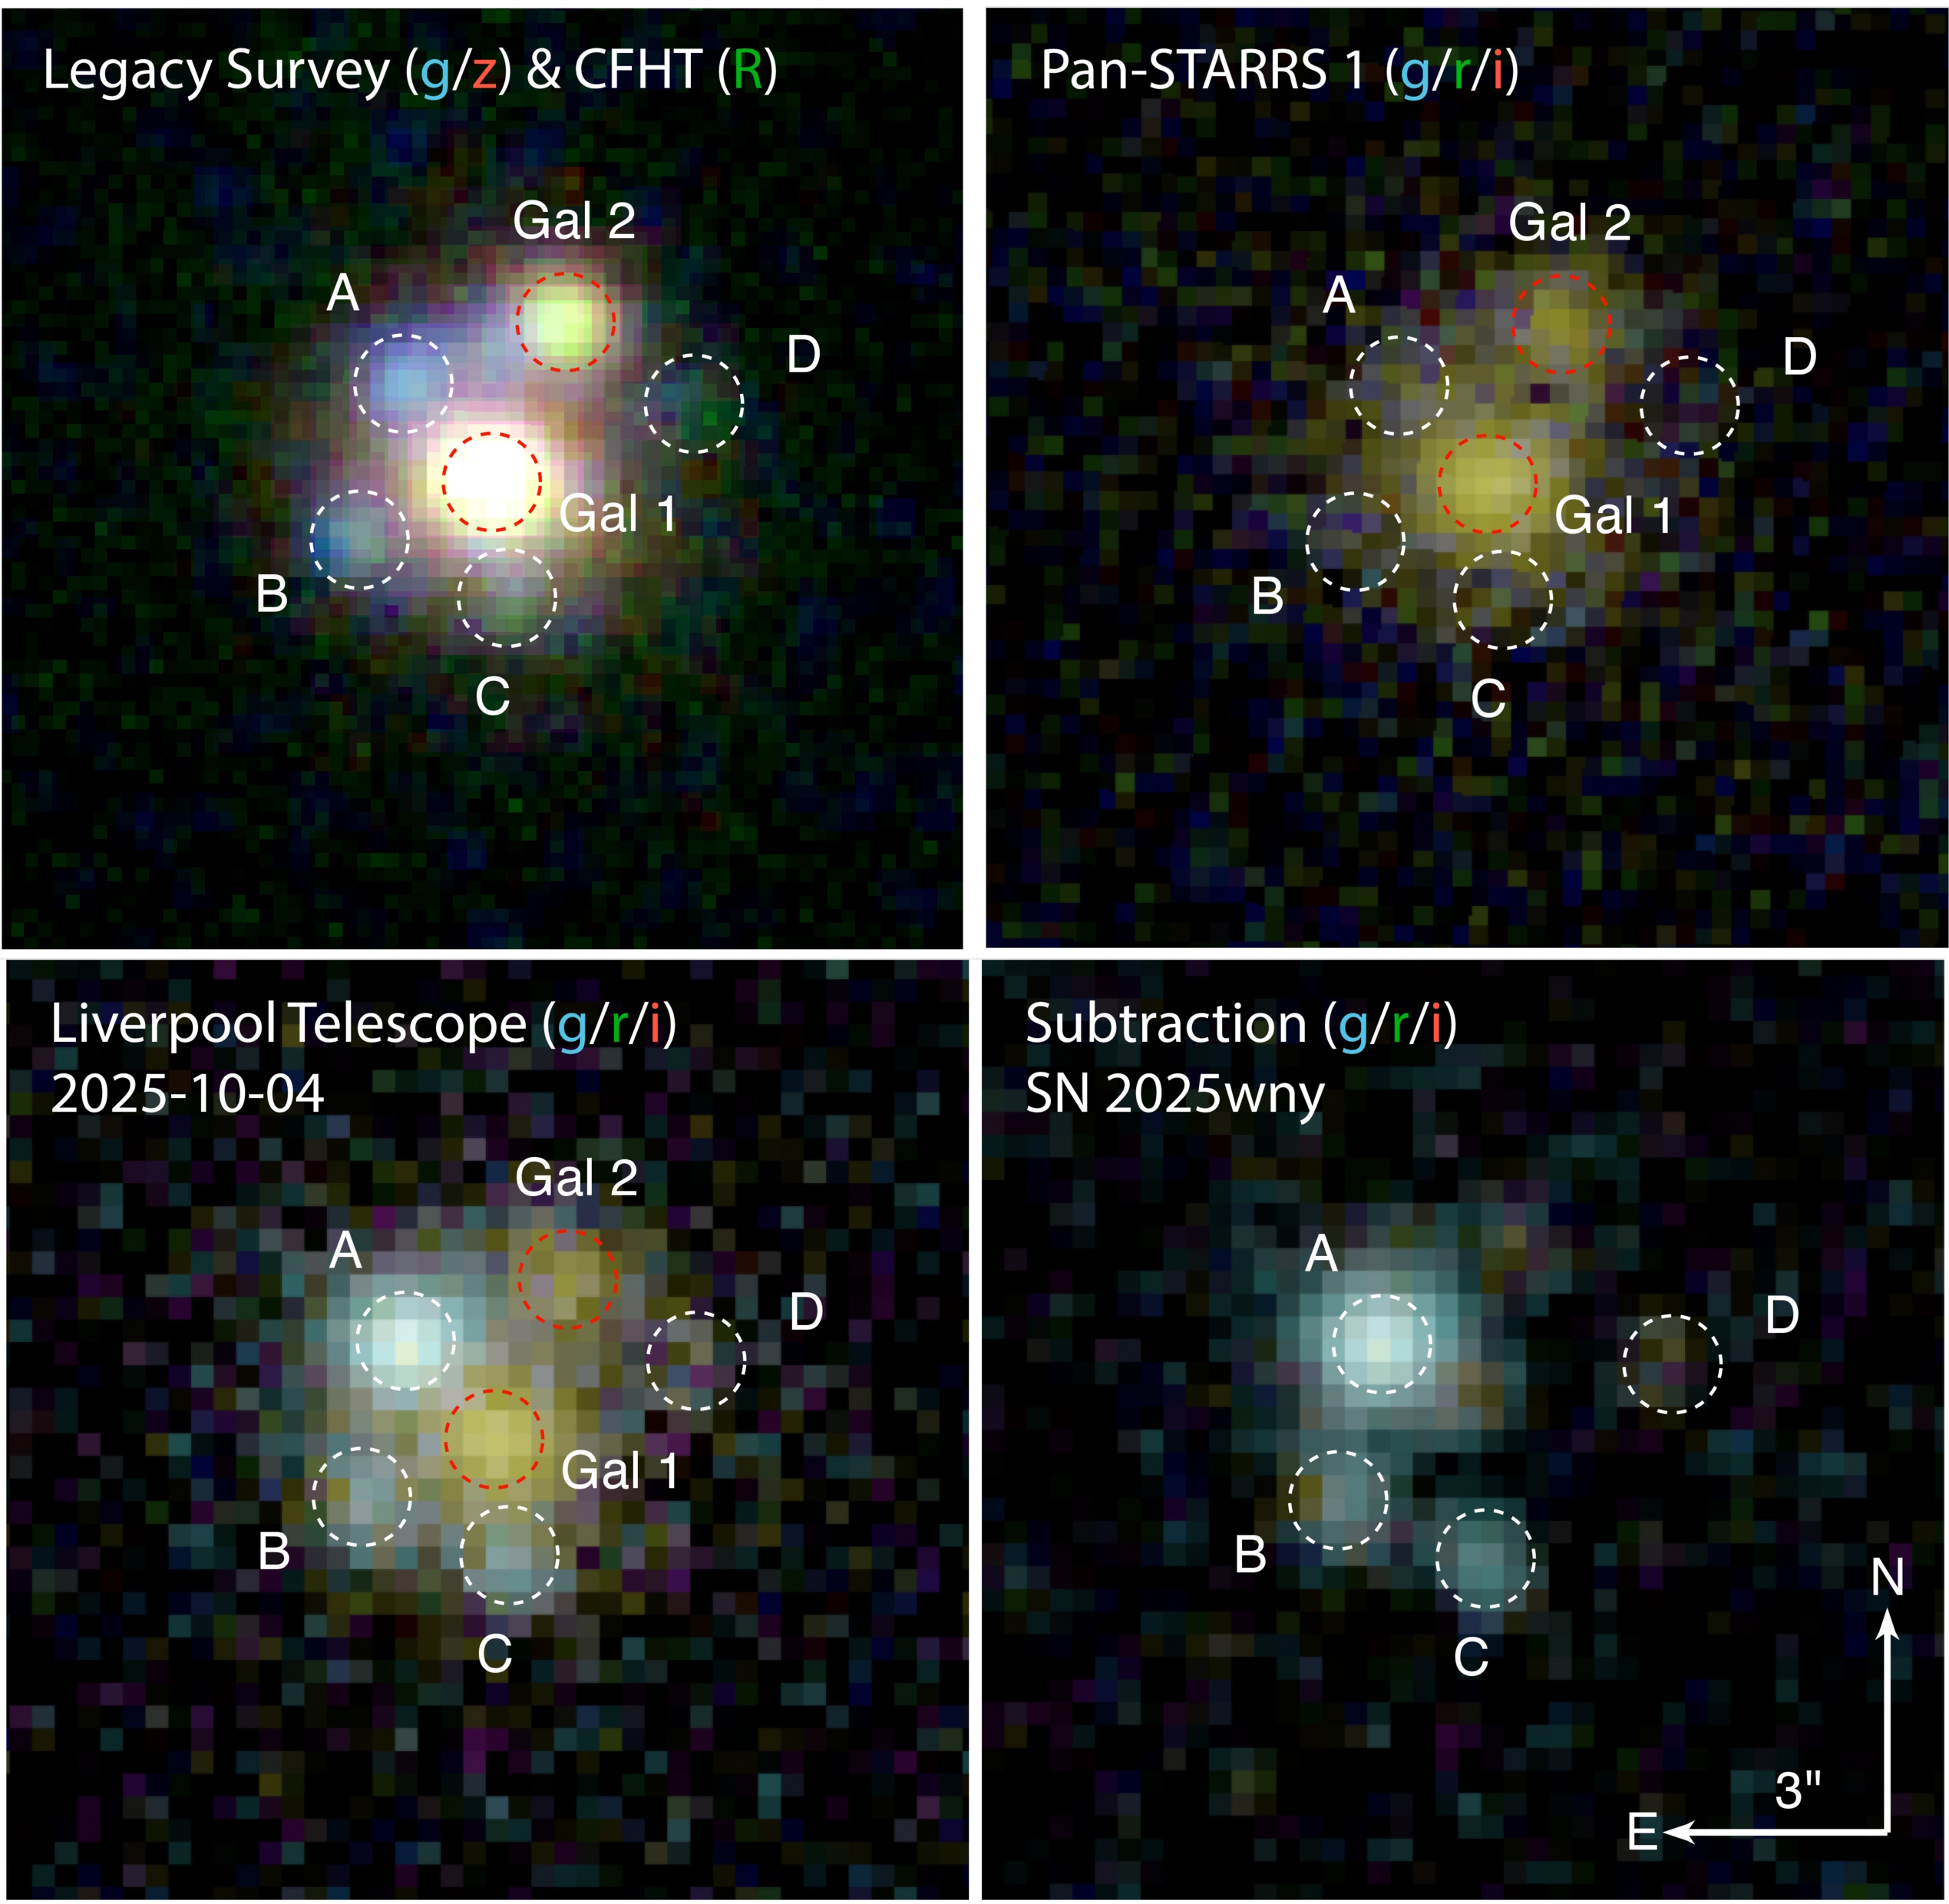
This four-panel image shows ground-based imaging of the system containing the superluminous supernova SN 2025wny. The white-circled regions labeled A through D are the multiple images of the lensed supernovae, while the red circled regions are the two galaxies participating in the foreground lens. The lower-right panel shows the four images of the lensed supernovae after foreground subtraction.
Credit: J. Johansson et al., Astrophysical Journal Letters, 2025
And that’s what’s most exciting. When it comes to the puzzle of the Hubble tension, we ought to fully expect that these time-delay supernova measurements, of multiply lensed supernovae, ought to agree with the distance ladder measurements: of 73 km/s/Mpc. The reason is that all distance ladder measurements start here, where we are now, and are looking out at a signal that arrives from some point where it was emitted in the cosmic past, but not all the way back at the Big Bang. That’s the category that these time-delay supernovae fall into as well. The other method, which I call the early relic method, involves tracing the cosmic growth of a signal — specifically, the baryon acoustic oscillation signal — that was imprinted early on in the hot, dense plasma phase of the Big Bang, and that we measure much later on. That’s where the lower value of 67 km/s/Mpc comes from.
If that’s where these measurements land, and they support an expansion rate of 73 km/s/Mpc but not of 67 km/s/Mpc, that will only deepen the mystery of the Hubble tension, causing us to ask if there’s truly a difference between modern and early measurements of the expansion rate, and what could be responsible for it. If, instead, they support the lower value of 67 km/s/Mpc and are inconsistent with 73 km/s/Mpc, that could lend credence to the minority opinion famously touted by Wendy Freedman: that perhaps the distance ladder measurements aren’t as certain as many claim them to be. And finally, if the value they yield falls in between the two favored values, that could indicate yet a third possibility: that the Universe is evolving in an unexpected way, and that may point to a new or evolving component of energy in our Universe.
Regardless of the outcome, measuring the Universe in a novel, independent way, as the VENUS collaboration is doing right now, is bound to teach us more than we’d ever learn without such measurements. At its core, physics is an experimental science, just as astronomy is an observational one. Despite all of our theoretical confidence in our picture of the Universe, each new observation is a chance to learn something new about what’s out there. After all, the truth about our reality is written on the face of the Universe itself, and it’s up to us to determine precisely what that is.
Sign up for the Starts With a Bang newsletter
Travel the universe with Dr. Ethan Siegel as he answers the biggest questions of all.