
Ethics statement
The protocol and recruitment materials were approved by the institutional review boards or ethics committees at 32 study sites across the United States. For 27 sites, Advarra, a central Institutional Review Board was used; at five university-based sites, Advarra as well as the local institutional review board of the academic institution was used. The 201 Trial was conducted according to the principles of the Declaration of Helsinki and Good Clinical Practice guidelines. All participants provided written informed consent before participation and for use of tissue or fluid samples for subsequent data analyses. Participants were reimbursed for costs of travel to and from a clinical site but were not otherwise compensated for their participation. The trial was registered with https://clinicaltrials.gov under registry number NCT05424276.
Study design
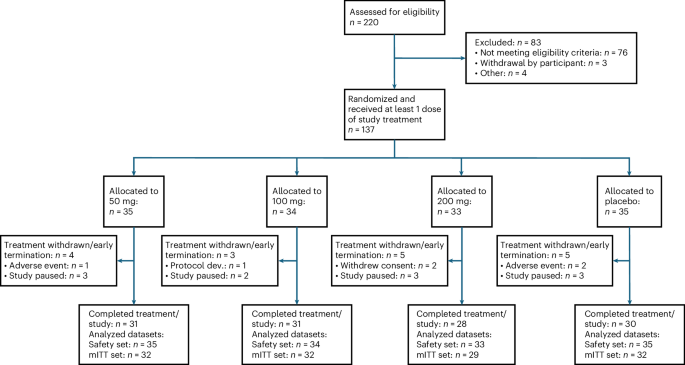
The 201 Trial was a 12-week, randomized, double-blind, placebo-controlled dose-ranging clinical trial with doses of 50 mg, 100 mg or 200 mg risvodetinib or placebo in participants with untreated PD, followed by a safety assessment in the absence of treatment at week 14. The trial was designed to primarily assess safety and tolerability. The study randomized 137 participants at 32 clinical sites across the United States using two randomization schemes. First, participants were randomized across the 50-mg, 100-mg or placebo groups in a 1:1:1 randomization scheme. Once five people were randomized to each of the 50-mg, 100-mg or placebo groups, additional participants were randomized to the 50-mg, 100-mg, 200-mg or placebo groups in a 5:5:5:6 randomization scheme. This two phase randomization was performed to accommodate the delayed FDA review of pharmacokinetic data at the 200 mg dose in healthy volunteers. At the end of the trial, all treatment groups were evenly distributed across all four trial arms.
Participants
Prospective participants were between 30 and 80 years old, had a diagnosis of PD consistent with UK Brain Bank and MDS Research criteria that included bradykinesia with sequence effect and motor asymmetry. Participants had to be <3.0 on the Hoehn & Yahr staging scale and have a Montreal Cognitive Assessment score ≥24. Key exclusion criteria included diagnosis of atypical parkinsonism or a high likelihood of needing anti-parkinsonian medication during the 12-week period of the study. Prospective participants could not have clinically significant orthostatic hypotension or hallucinations requiring antipsychotic medications nor could prospective participants have been treated with dopaminergic agents for more than 28 days and within 28 days before screening. They could not have been exposed to monoamine-oxidase B inhibitors in the 90-day period before medical screening nor be treated with these inhibitors for more than 28 days. See Supplementary Protocol for additional information.
Outcomes
The primary end points were safety and tolerability assessed descriptively by the incidence and temporal profile of TEAEs, the incidence of TEAEs leading to withdrawal of the study drug, the incidence of SAEs and the proportion of randomized participants who discontinued their assigned dose.
Secondary efficacy end points, in hierarchical order, were the sum of MDS-UPDRS Parts II and III, Parkinson’s Disease Questionnaire (PDQ-39) Summary Index, Patient Global Impression-Severity (PGI-S), Clinician Global Impression of Severity (CGI-S), MDS-UPDRS Part II, MDS-UPDRS Part III, MDS-UPDRS Part I, Non-Motor Symptom Scale (NMSS), Complete Spontaneous Bowel Movement Score (CSBM), ESS, SEADL Scale, Patient Assessment of Upper Gastrointestinal Disorders Severity Index (PAGI-SYM), Patient Assessment of Constipation Quality of Life (PAC-QoL) and the Patient Assessment of Gastrointestinal Disorders Severity Quality of Life (PAGI-QoL).
Skin biopsy collection was optional and conducted following written participant consent. Three-millimeter punch biopsies were obtained from three anatomical sites: the lateral distal leg, lateral distal thigh and posterior cervical regions as previously described12,13,14. All three sites were sampled at each longitudinal time point and in proximity to the previous biopsy. Skin biopsy specimens were immediately fixed in Zamboni solution (2% paraformaldehyde-lysine-periodate) then cryoprotected (20% glycerol and 20% 0.4 M Sorensen buffer). Specimens were subsequently cryo-sectioned into six to eight 50-μm-thick sections.
Analysis of secondary clinical measures
The secondary efficacy end points were defined as the change from baseline at week 12 and were evaluated in hierarchical order (by end point and within each end point, by dose). Descriptive statistics for each continuous end point were presented as change from baseline by treatment group and visit. The differences between the dose levels versus placebo at week 12 in the continuous secondary end points were estimated using mixed models for repeated measures (MMRM) using the mITT dataset. In this study, treatment group sizes within the mITT analysis set ranged from 29 to 32 participants. A typical threshold for reliance on the Central Limit Theorem is approximately 20–30 observations, thus our sample sizes were generally supportive of parametric methods. Further, the use of a longitudinal model such as the MMRM also appropriately accounts for within-subject correlations and accommodates incomplete data without the need for ad hoc imputation, making it preferable to alternative methods that either discard longitudinal information or require stronger assumptions to address any missing observations. The MMRM included the observed changes from baseline from all post-baseline visits as the response values. Missing data associated with efficacy end points were not imputed but were analyzed as missing in the model. The treatment group, visit and the interaction between the treatment group and visit were the fixed factors in the analysis. The baseline value was used as a covariate in the model. The least squared mean (LSM) for each treatment group, s.e.m. and LSM difference between different dose levels and placebo along with the P value and 95% confidence intervals (CIs) were also calculated.
Analysis of exploratory biomarkers
For each biopsy, a minimum of six sections underwent dual-label immunofluorescent staining for simultaneous covisualization of total nerve fibers using protein gene product 9.5 (anti-rabbit, Cederlane: polyclonal 1:1,000 dilution) and α-synuclein deposition using phosphorylated-Ser129 α-synuclein antibody (anti-mouse, Wako: monoclonal: 1:2,000 dilution); phosphorylated-Ser129 α-synuclein is a well-established marker of α-synuclein pathology in PD8. Only intra-axonal deposits of phosphorylated α-synuclein, confirmed by colocalization within nerve fibers, were identified as pathological deposits, as previously described12,13,14. Each staining batch included positive and negative control samples. Additionally, intra-epidermal nerve fiber density was calculated for each biopsy site as an internal control using standard techniques to confirm stain success14.
Slide scanning was performed using a confocal slide scanning microscope (SLIDEVIEW VS200, Evident) with a ×20 objective (UPlanXApo, NA 0.80). Images were acquired at 2-μm intervals throughout the tissue sections and processed using extended focal imaging before review and analysis. Image analysis (NerValence, CND Life Sciences and Oncotopix, Visiopharm, Hørsholm v.2023.09.3.15043) was employed to objectively identify and measure cutaneous axons and colocalized phosphorylated α-synuclein deposits. All slides and processed images underwent review by an independent pathological reviewer blinded to treatment, disease state and visit sequence. Manual confirmation of all synuclein deposits was completed until concordance between image analysis and manual pathological review for phosphorylated α-synuclein was 100%.
The burden of phosphorylated α-synuclein deposition was quantified as µm2 of synuclein deposits per mm2 of analyzed tissue. With a minimum of six tissue sections studied per biopsy, the total tissue area analyzed ranged from 33–55 mm2 per biopsy. Measurements from each biopsy site were reported independently, with the total α-synuclein burden calculated as the sum of the three biopsy sites per participant per visit.
To assess potential treatment impact, the total phosphorylated-Ser129 α-synuclein burden at baseline was compared to an identical measure after 12 weeks of treatment. Samples from 36 participants were complete at both baseline and the 12-week time point. Samples were excluded if the baseline signal was detected in only a single axon in the tissue sample as this could result in a sampling error if the same axon is not biopsied at the 12-week time point. Samples were also excluded if the baseline and 12-week samples at any given biopsy location contained unequal numbers of axons in the tissue sample. The fractional change in phosphorylated-Ser129 α-synuclein deposition area intensities between the two time points at all three biopsy locations was calculated to represent the potential treatment effect for each participant. No interpretation was made concerning the absolute signal intensities at any tissue location and a statistical analysis of the fractional change is not warranted for this exploratory end point. Neither the distribution of fluorescent aggregates within a biopsy location nor the magnitude of the fractional change over time was considered to carry information on disease progression or disease status.
Statistics and reproducibility
A sample size of 30 participants for each treatment group was considered sufficient to adequately assess safety and tolerability over 12 weeks as the first extended human dosing study with risvodetinib. The safety analysis set was defined as all randomized participants that received at least one dose of study drug, while the mITT dataset included all randomized participants who had a valid baseline MDS-UPDRS, received at least one dose of the study drug, and had at least one post-baseline evaluation of the MDS-UPDRS assessment. The mITT dataset excluded participants who had been enrolled before the FDA imposed a clinical hold because their last secondary end point assessments occurred days or weeks after their last administered dose.
To enroll the trial, screening data and medical records were reviewed by an Enrollment Authorization Committee composed of an independent outside group of Movement Disorder Specialist physicians who reviewed screening data and confirmed eligibility and suitability of participants enrollment. Those selected were enrolled and randomized to one of three active arms or a placebo arm using an interactive web response system (IWRS). The IWRS is a secure, web-based tool used in clinical trials to manage how participants are assigned to different treatment groups. It ensures that randomization is accurate, unbiased, and kept confidential throughout the study. The system also tracks study drug supply in real time, reducing the risk of errors. The 201 Trial employed an IWRS system developed and validated by Medidata. See Supplementary Protocol for additional details for screening and enrollment.
The safety and tolerability of risvodetinib were assessed using descriptive statistics for each treatment group. TEAEs were defined as those that start or worsen after the first dose of study intervention until the safety follow-up visit is completed. Safety assessments included TEAEs tabulated by treatment group as well as system organ class (SOC) and preferred term (PT). Furthermore, the incidence of TEAEs was reported as the number (percent) of participants with TEAEs within SOC and PT. Participants were counted only once within an SOC and PT, even if the participant experienced more than one TEAE within a specific SOC and PT. Inferential statistical analysis was not performed on safety data.
The secondary efficacy end points (as changes from baseline at week 12) were evaluated in hierarchical order using an MMRM (Supplementary Protocol). The MMRM included the observed change from baseline from week 4, week 8 and week 12 as the response values, baseline value as a covariate and treatment group, visit, and treatment group by visit interaction term as fixed factors. End points were tested in hierarchical order using a two-sided α = 0.05 as the cutoff. The estimand was defined using participants in the mITT population evaluating the change from baseline to week 12 for each secondary end point. Intercurrent events in this analysis included whether a participant prematurely discontinued study treatment or initiated medications to control motor features of PD. The data were summarized by calculating the differences of the LSM change from baseline at week 12 by dose versus placebo. The LSM estimate for each treatment group, s.e.m., the differences in LSM and the difference between different dose levels and placebo were computed along with the 95% CI. Only the LSM values were used for statistical comparison. Categorical end points, such as PGI-S and CGI-S, were analyzed using the GLIMMIX procedure for binomial data with the logit link. The model included the observed binomial values from all post-baseline visits as the response values and the treatment group, visit and the interaction between the treatment group and visit as fixed factors. The baseline value was used as a covariate in the model. ‘Improved’ was defined as at least a whole number decrease in score for PGI-S and CGI-S. Model-based LSM estimates, P values and associated 95% CIs were generated for each treatment group at each post-baseline visit which were used for statistical comparison.
For the exploratory analysis of the treatment effect on α-synuclein aggregate deposition following skin biopsy, treatment groups were individually compared to the placebo group using a one-way analysis of variance followed by Dunnett multiple comparisons test using Prism v.10 (www.graphpad.com).
Reporting summary
Further information on research design is available in the Nature Portfolio Reporting Summary linked to this article.