
Find winning stocks in any market cycle. Join 7 million investors using Simply Wall St’s investing ideas for FREE.
If you are wondering whether Kajima’s share price still offers value after a strong run, this article will walk you through what the current valuation numbers actually say.
Kajima’s stock last closed at ¥7,142, with returns of 0.8% over 7 days, 12.1% over 30 days, 18.8% year to date and 136.6% over 1 year. The 3 year return is 381.2%, and the 5 year return is just under 5x.
Recent coverage of Kajima has focused on its position within Japan’s capital goods sector and its role in large construction and infrastructure projects. This helps frame how investors are thinking about its growth runway and risk profile. This backdrop is useful context when you look at the share price moves, because it ties the market’s expectations to the types of projects and contracts the company is associated with.
On our checklist of 6 valuation tests, Kajima currently scores 4 out of 6 on value. You can see this in more detail via its valuation score. Next, we will break that down across different valuation approaches before finishing with a way to look at value that goes beyond any single model.
A Discounted Cash Flow, or DCF, model estimates what a company could be worth by projecting its future cash flows and then discounting them back to today using a required return.
For Kajima, the model used is a 2 Stage Free Cash Flow to Equity approach, based on cash flow projections. The latest twelve month free cash flow is ¥108,881.9m. Analyst estimates and extrapolated figures point to projected free cash flow of ¥366,959.3m in 2035, with interim projections such as ¥260,400m in 2030. Simply Wall St uses analyst inputs for the nearer years and then extends the trend further out.
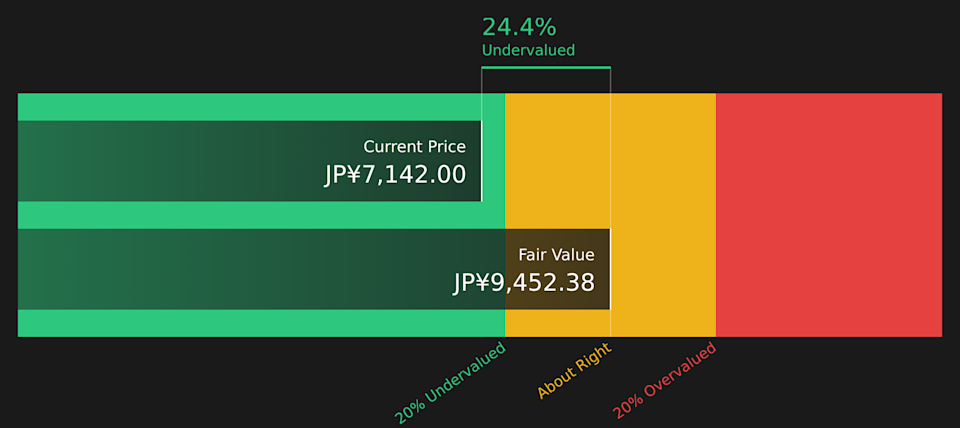
When all those future cash flows are discounted back, the DCF suggests an estimated intrinsic value of ¥9,452 per share. Compared with the recent share price of ¥7,142, this implies the stock trades at a 24.4% discount to that DCF estimate, which points to value remaining in the shares on this model.
Result: UNDERVALUED
Our Discounted Cash Flow (DCF) analysis suggests Kajima is undervalued by 24.4%. Track this in your watchlist or portfolio, or discover 20 more high quality undervalued stocks.
 1812 Discounted Cash Flow as at Feb 2026
Story Continues
For a profitable company like Kajima, the P/E ratio is a useful way to relate what you pay for the stock to the earnings it currently generates. It gives you a quick sense of how many years of earnings the market is pricing in at today’s share price.
What counts as a “normal” or “fair” P/E depends on how the market views a company’s growth potential and risk. Higher expected growth or lower perceived risk can support a higher multiple, while lower growth or higher risk can mean a lower one is more appropriate.
Kajima currently trades on a P/E of 19.18x. That is higher than the Construction industry average of 14.03x, but below the peer group average of 22.20x. Simply Wall St also provides a Fair Ratio for Kajima of 23.83x, which is the P/E level it would expect given factors like earnings growth, profit margins, industry, market cap and specific company risks.
This Fair Ratio is often more useful than a simple peer or industry comparison, because it adjusts for the characteristics that make Kajima different from the typical Construction stock. With the current P/E below the Fair Ratio, Kajima screens as cheaper than that tailored benchmark on this metric.
Result: UNDERVALUED
 TSE:1812 P/E Ratio as at Feb 2026
P/E ratios tell one story, but what if the real opportunity lies elsewhere? Start investing in legacies, not executives. Discover our 12 top founder-led companies.
Earlier we mentioned that there is an even better way to understand valuation, so let us introduce you to Narratives, which let you attach your own story about Kajima to the numbers you see on screen, such as your fair value, revenue, earnings and margin assumptions.
A Narrative connects three things in a straight line: the story you believe about the business, the financial forecast that follows from that story, and the fair value that forecast points to.
On Simply Wall St, you can find Narratives on the Community page, where millions of investors use them as a simple tool to compare their view of Kajima’s fair value with the current share price, and see whether that suggests it could be a time to buy, hold or sell.
Because Narratives automatically refresh when new information such as news or earnings is added to the platform, one Kajima Narrative might assume a higher fair value based on strong long term project demand, while another might assume a lower fair value if the focus is on tighter margins and more cautious contract assumptions.
Do you think there’s more to the story for Kajima? Head over to our Community to see what others are saying!
TSE:1812 1-Year Stock Price Chart
This article by Simply Wall St is general in nature. We provide commentary based on historical data and analyst forecasts only using an unbiased methodology and our articles are not intended to be financial advice. It does not constitute a recommendation to buy or sell any stock, and does not take account of your objectives, or your financial situation. We aim to bring you long-term focused analysis driven by fundamental data. Note that our analysis may not factor in the latest price-sensitive company announcements or qualitative material. Simply Wall St has no position in any stocks mentioned.
Companies discussed in this article include 1812.T.
Have feedback on this article? Concerned about the content? Get in touch with us directly. Alternatively, email editorial-team@simplywallst.com