
Track your investments for FREE with Simply Wall St, the portfolio command center trusted by over 7 million individual investors worldwide.
If you are wondering whether Veolia Environnement at around €35.96 is offering good value right now, this article unpacks what the current price might be implying about the company.
The stock has recently posted returns of 4.4% over 7 days, 14.5% over 30 days, 19.3% year to date, 30.8% over 1 year and 44.1% and 100.3% over 3 and 5 years respectively, which raises questions about how its current valuation stacks up.
Recent news coverage around Veolia has focused on its position as a major utilities and environmental services group, along with periodic updates on contracts, regulation and sector sentiment that can influence how investors view the stock. These themes help frame why the price has moved the way it has and why valuation is a key topic for many shareholders today.
On our simple 6 point valuation checklist, Veolia scores a 3 out of 6 for being undervalued. Next we look at how different methods such as DCF, multiples and peer comparisons line up, and then finish by discussing a broader way to think about valuation that pulls all of this together.
Find out why Veolia Environnement’s 30.8% return over the last year is lagging behind its peers.
A Discounted Cash Flow, or DCF, model estimates what a company might be worth by projecting its future cash flows and discounting them back to today. It is essentially asking what those future euros are worth in present terms.
For Veolia Environnement, the model used is a 2 Stage Free Cash Flow to Equity approach based on cash flow projections. The latest twelve month free cash flow is about €2.13b. Analyst estimates and extrapolations then project free cash flows each year out to 2035, with the 2035 figure sitting at around €2.07b. These projections, all in €, are discounted back to today to reflect risk and the time value of money.
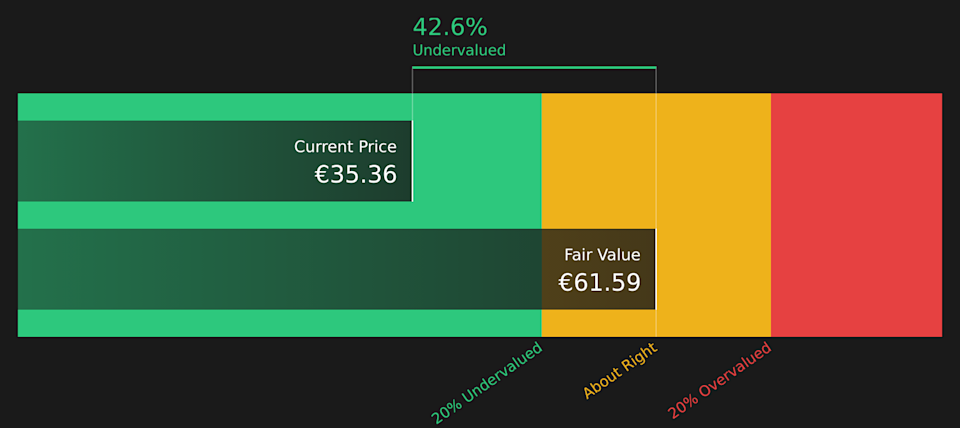
Putting all of this together, the DCF output suggests an estimated intrinsic value of €57.96 per share. Against the current share price of around €35.96, this implies Veolia is trading at a 38.0% discount to that estimate, which indicates a material gap between price and modelled value.
Result: UNDERVALUED
Our Discounted Cash Flow (DCF) analysis suggests Veolia Environnement is undervalued by 38.0%. Track this in your watchlist or portfolio, or discover 220 more high quality undervalued stocks.
 VIE Discounted Cash Flow as at Feb 2026
Story Continues
For a profitable company, the P/E ratio is a useful way to see what investors are currently paying for each euro of earnings. This gives a quick indication of how the market is weighing its prospects and risks.
In general, higher growth expectations and lower perceived risk can support a higher P/E, while lower growth and higher risk usually justify a lower multiple. The key question is not whether a P/E is high or low in isolation, but whether it fits the company’s specific profile.
Veolia Environnement currently trades on a P/E of 19.7x, which sits close to the Integrated Utilities industry average of about 19.1x and below the peer group average of 21.8x. Simply Wall St’s Fair Ratio for Veolia, at 19.3x, is its view of what an appropriate P/E could be after considering factors such as earnings growth, profit margins, industry, market cap and risk profile. This makes it more tailored than a simple comparison with peers or the broad industry, which may not share the same fundamentals.
Since Veolia’s actual P/E of 19.7x is very close to the Fair Ratio of 19.3x, the shares appear broadly in line with this earnings-based valuation check.
Result: ABOUT RIGHT
 ENXTPA:VIE P/E Ratio as at Feb 2026
P/E ratios tell one story, but what if the real opportunity lies elsewhere? Start investing in legacies, not executives. Discover our 96 top founder-led companies.
Earlier we mentioned that there is an even better way to understand valuation. Narratives on Simply Wall St let you attach a clear story about Veolia Environnement to your numbers by linking your view of its future revenues, earnings and margins to a forecast, a fair value and then a simple comparison with today’s price. All of this is available within an easy tool on the Community page that updates as new news or earnings arrive. One investor might lean toward a higher fair value closer to the bullish view around €44.06 based on expectations for faster growth in areas like Water Technologies and district heating. Another might anchor nearer the more cautious view around €25.96 if they focus on risks such as high debt, acquisition complexity or pressure from decentralized solutions.
For Veolia Environnement however we will make it really easy for you with previews of two leading Veolia Environnement Narratives:
🐂 Veolia Environnement Bull Case
Fair value in this scenario: €36.22 per share
Current price vs this fair value: around 0.7% below the narrative fair value
Revenue growth assumption: 3.84% a year
Focuses on wastewater reuse, low carbon district heating and higher value technology services as long term earnings drivers, supported by multi year contracts and international diversification.
Builds in expectations for gradual margin improvement, with profit margins modelled higher than today and free cash flow supported by M&A synergies and efficiency gains.
Analysts in this camp are using a fair value of about €36.22, with assumptions around revenue of €51.5b, earnings of €1.9b by 2028 and a future P/E of 16.2x, all discounted at roughly 6.4%.
🐻 Veolia Environnement Bear Case
Fair value in this scenario: €27.77 per share
Current price vs this fair value: around 29.5% above the narrative fair value
Revenue growth assumption: 3.09% a year
Highlights risks from decentralized energy and water solutions, circular economy trends and potential pressure on legacy waste and centralized infrastructure contracts.
Points to debt levels around €21b, acquisition integration and geopolitical exposure as factors that could constrain margins, cash flow and future flexibility.
Assumes a fair value of about €27.77 based on revenue growth of roughly 3.1% a year, profit margins in the mid 3% range, earnings of €1.7b by 2028 and a future P/E around 14x, using a discount rate of about 6.4%.
Do you think there’s more to the story for Veolia Environnement? Head over to our Community to see what others are saying!
ENXTPA:VIE 1-Year Stock Price Chart
This article by Simply Wall St is general in nature. We provide commentary based on historical data and analyst forecasts only using an unbiased methodology and our articles are not intended to be financial advice. It does not constitute a recommendation to buy or sell any stock, and does not take account of your objectives, or your financial situation. We aim to bring you long-term focused analysis driven by fundamental data. Note that our analysis may not factor in the latest price-sensitive company announcements or qualitative material. Simply Wall St has no position in any stocks mentioned.
Companies discussed in this article include VIE.PA.
Have feedback on this article? Concerned about the content? Get in touch with us directly. Alternatively, email editorial-team@simplywallst.com