

Find winning stocks in any market cycle. Join 7 million investors using Simply Wall St’s investing ideas for FREE.
If you are wondering whether Cohen & Steers is offering good value at its current price, this article walks through what the numbers are really saying about the stock.
The shares recently closed at US$66.87, with returns of 3.5% over 30 days and 5.2% year to date, but a 21.0% decline over the past year, which may have shifted how investors think about both its growth potential and risk.
This mix of shorter term gains and a weaker one year result has kept Cohen & Steers on many investors’ watchlists, as they reassess what they are willing to pay for the company. Recent coverage has focused on how the stock fits into income focused and asset management portfolios, which helps frame how the market is currently pricing its role in that space.
Our valuation model gives Cohen & Steers a value score of 1 out of 6. We will look at what different valuation approaches say about that score, then finish by highlighting a broader way to think about value that goes beyond any single metric.
Cohen & Steers scores just 1/6 on our valuation checks. See what other red flags we found in the full valuation breakdown.
The Excess Returns model looks at how much value Cohen & Steers generates over and above the return that equity investors require. It starts with what shareholders have put into the business, then asks whether the earnings on that equity are comfortably higher than the cost of that capital.
For Cohen & Steers, the model uses a Book Value of US$10.79 per share and a Stable EPS estimate of US$2.67 per share, based on the median return on equity from the past 5 years. The implied Average Return on Equity is 29.17%, compared with a Cost of Equity of US$0.71 per share, which yields an Excess Return of US$1.96 per share. A Stable Book Value of US$9.16 per share, taken from the median book value over the past 5 years, is used to extend these economics into the future.
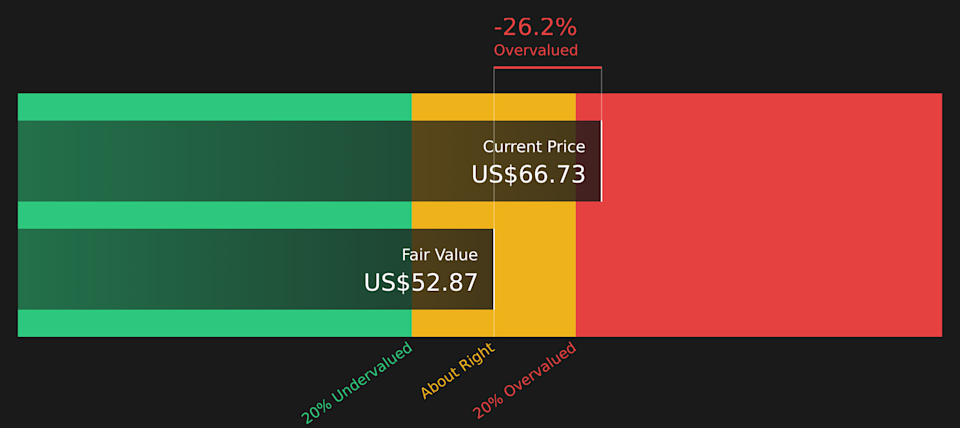
Putting these inputs together, the Excess Returns model arrives at an intrinsic value of about US$54.33 per share. Compared with the recent share price of US$66.87, this implies the stock is around 23.1% overvalued based on this approach.
Result: OVERVALUED
Our Excess Returns analysis suggests Cohen & Steers may be overvalued by 23.1%. Discover 46 high quality undervalued stocks or create your own screener to find better value opportunities.
 CNS Discounted Cash Flow as at Mar 2026
Story Continues
P/E is a useful yardstick for a profitable company like Cohen & Steers because it ties what you pay directly to the earnings the business is generating today. In practice, investors usually accept a higher P/E when they expect stronger earnings growth or see the business as lower risk, and a lower P/E when growth expectations or perceived risks are higher.
Cohen & Steers is currently trading on a P/E of 22.26x. That sits close to the broader Capital Markets industry average of 22.60x, but above the peer group average of 8.75x. To sharpen this view, Simply Wall St uses a “Fair Ratio” of 15.26x, which is an estimate of what Cohen & Steers P/E might be given factors like its earnings profile, industry, profit margins, market cap and specific risks.
This Fair Ratio can be more useful than a simple comparison with peers or the industry because it looks at the company’s own characteristics rather than assuming that all firms in the group deserve similar multiples. Comparing the Fair Ratio of 15.26x with the current P/E of 22.26x suggests the shares are trading above that fair range.
Result: OVERVALUED
 NYSE:CNS P/E Ratio as at Mar 2026
P/E ratios tell one story, but what if the real opportunity lies elsewhere? Start investing in legacies, not executives. Discover our 19 top founder-led companies.
Earlier we mentioned that there is an even better way to understand valuation. Narratives on Simply Wall St let you attach a clear story about Cohen & Steers to your own assumptions for fair value, future revenue, earnings and margins. You can link that story to a financial forecast and a fair value estimate that you can compare with the current share price, and then see it update automatically as new information like news, analyst targets or earnings comes in. For example, one investor might build a Narrative around the higher US$80 price target with stronger views on active ETFs and real assets. Another might lean toward the US$66 target with more focus on fee pressure and product mix. Both Narratives can sit side by side on the Community page so you can decide which story lines up best with how you want to invest.
Do you think there’s more to the story for Cohen & Steers? Head over to our Community to see what others are saying!
NYSE:CNS 1-Year Stock Price Chart
This article by Simply Wall St is general in nature. We provide commentary based on historical data and analyst forecasts only using an unbiased methodology and our articles are not intended to be financial advice. It does not constitute a recommendation to buy or sell any stock, and does not take account of your objectives, or your financial situation. We aim to bring you long-term focused analysis driven by fundamental data. Note that our analysis may not factor in the latest price-sensitive company announcements or qualitative material. Simply Wall St has no position in any stocks mentioned.
Companies discussed in this article include CNS.
Have feedback on this article? Concerned about the content? Get in touch with us directly. Alternatively, email editorial-team@simplywallst.com