

Never miss an important update on your stock portfolio and cut through the noise. Over 7 million investors trust Simply Wall St to stay informed where it matters for FREE.
If you are wondering whether Mondelez International is reasonably priced or quietly mispriced, you are not alone. This article is built to help you frame that question clearly.
Over the past week the stock has returned 4.7%, with returns of 5.3% over 30 days, 14.8% year to date, 1.6% over 3 years and 25.6% over 5 years, while the 1-year return sits at a 1.1% decline. This gives a mixed backdrop for anyone thinking about value today.
Recent coverage around Mondelez has focused on its position as a global snacks and confectionery group, including how it fits into consumer staples watchlists and broader sector discussions. This context can help you think about whether the current price and those recent returns line up with the kind of business you believe you are buying.
On our checks, Mondelez scores a value rating of 3 out of 6. Next we will walk through what that means across different valuation methods, before finishing with a way of looking at valuation that ties those methods together into a clearer big picture.
Find out why Mondelez International’s -1.1% return over the last year is lagging behind its peers.
The DCF model estimates what a business might be worth by projecting its future cash flows and then discounting those cash flows back to today, so you can compare that value with the current share price.
For Mondelez International, the model starts with last twelve months free cash flow of about $3.20b and then uses a 2 Stage Free Cash Flow to Equity approach. Analysts provide explicit forecasts for several years, such as projected free cash flow of $4.62b in 2028. Further cash flows out to 2035 are extrapolated from those analyst inputs by Simply Wall St.
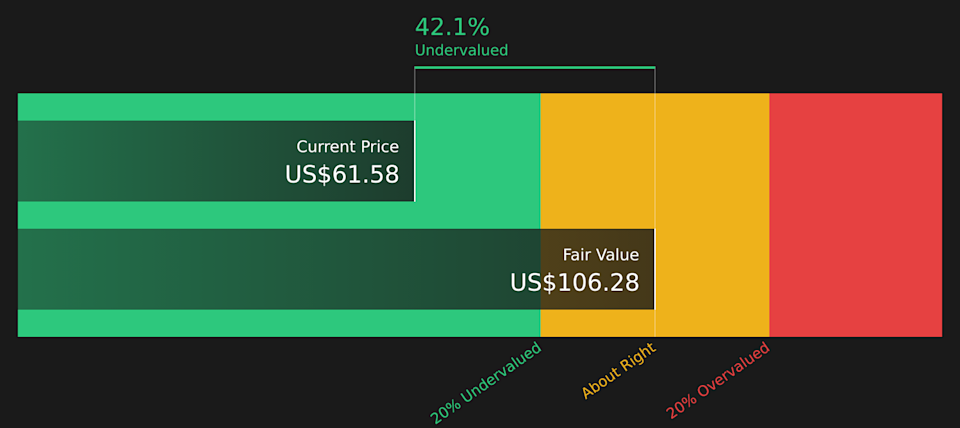
Discounting this stream of projected cash flows back to today gives an estimated intrinsic value of $106.28 per share. Compared with the current market price, this implies a 42.1% discount, which points to the shares trading below this particular estimate of underlying value.
Result: UNDERVALUED
Our Discounted Cash Flow (DCF) analysis suggests Mondelez International is undervalued by 42.1%. Track this in your watchlist or portfolio, or discover 46 more high quality undervalued stocks.
 MDLZ Discounted Cash Flow as at Mar 2026
For a profitable business like Mondelez International, the P/E ratio is a useful way to see how much you are paying for each dollar of earnings, and it is a common yardstick investors use when they want a quick sense check on valuation.
Story Continues
What counts as a reasonable P/E usually reflects what the market thinks about a company’s growth potential and risk. Higher expected growth or lower perceived risk tend to support a higher “normal” P/E, while lower growth or higher risk usually support a lower one.
Mondelez currently trades on a P/E of 32.21x, compared with the Food industry average of about 24.58x and a peer group average of 46.82x. Simply Wall St also calculates a “Fair Ratio” of 27.68x, which is the P/E it would expect given factors such as Mondelez’s earnings profile, industry, profit margins, market cap and risk characteristics.
This Fair Ratio is more tailored than a simple comparison with peers or the industry because it adjusts for company specific factors rather than assuming that all food companies deserve the same multiple.
With the current P/E of 32.21x above the Fair Ratio of 27.68x, the stock screens as overvalued on this metric.
Result: OVERVALUED
 NasdaqGS:MDLZ P/E Ratio as at Mar 2026
P/E ratios tell one story, but what if the real opportunity lies elsewhere? Start investing in legacies, not executives. Discover our 19 top founder-led companies.
Earlier we mentioned that there is an even better way to understand valuation. Let us introduce you to Narratives, where you set out your view of Mondelez International’s story, plug in the numbers you think are reasonable for future revenue, earnings, margins and fair value. You can then track that view inside Simply Wall St’s Community page, compare your Fair Value with the current price to help decide whether to act, and see it update automatically when new information like earnings or news arrives. One investor might build a Mondelez Narrative that leans toward the higher US$88 analyst target, while another anchors closer to the lower US$67 view, each with a clear, transparent link from story to forecast to fair value.
Do you think there’s more to the story for Mondelez International? Head over to our Community to see what others are saying!
NasdaqGS:MDLZ 1-Year Stock Price Chart
This article by Simply Wall St is general in nature. We provide commentary based on historical data and analyst forecasts only using an unbiased methodology and our articles are not intended to be financial advice. It does not constitute a recommendation to buy or sell any stock, and does not take account of your objectives, or your financial situation. We aim to bring you long-term focused analysis driven by fundamental data. Note that our analysis may not factor in the latest price-sensitive company announcements or qualitative material. Simply Wall St has no position in any stocks mentioned.
Companies discussed in this article include MDLZ.
Have feedback on this article? Concerned about the content? Get in touch with us directly. Alternatively, email editorial-team@simplywallst.com