

Get insights on thousands of stocks from the global community of over 7 million individual investors at Simply Wall St.
If you are wondering whether Wendel at €88.85 is offering real value or just looks interesting on the surface, you are in the right place to unpack what the current price may be implying.
The share price has been relatively mixed, with a 1.5% decline over the last 7 days, a 9.3% gain over the last 30 days, an 8.8% return year to date and a 1.2% decline over the last year. This combination can leave investors unsure how to read the signal.
Recent coverage around Wendel has focused on its role as a diversified financials group and how that structure can influence sentiment when conditions change across its portfolio. This helps explain some of the shorter term swings in the share price. For long term holders, this context matters because market reactions often move faster than the underlying portfolio does.
On our checklist based approach, Wendel records a valuation score of 4 out of 6. This suggests that some metrics point to undervaluation while others look more balanced. Next, we will compare different valuation methods before finishing with a broader way to frame what these numbers really mean for you.
The Excess Returns model looks at how much value a company can create above the return that equity investors require. It compares what Wendel is estimated to earn on its equity to the cost of that equity and then adjusts for expected growth in its book value.
For Wendel, the model uses a Book Value of €82.92 per share and a Stable EPS of €8.05 per share, based on the median return on equity from the past 5 years. The Average Return on Equity used in the model is 8.41%, while the Cost of Equity is €9.52 per share. That leads to an Excess Return of €1.46 per share in the model, combined with a Stable Book Value estimate of €95.72 per share, sourced from weighted future book value estimates from three analysts.
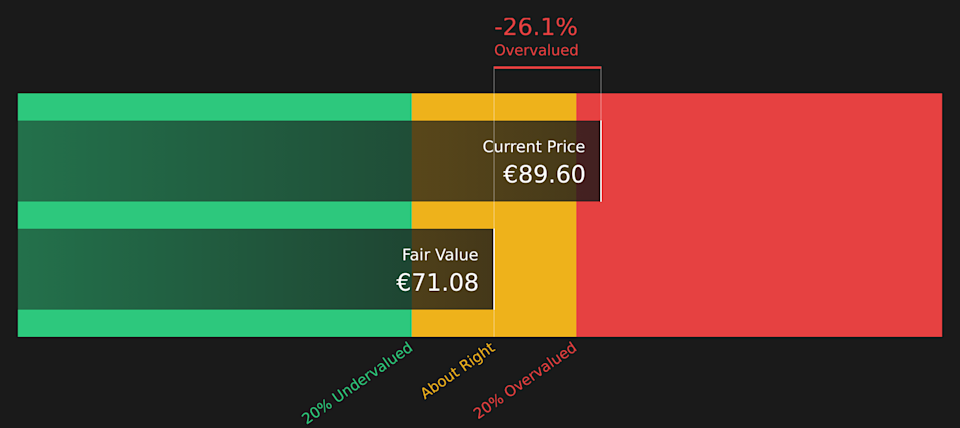
Putting these inputs together, the Excess Returns valuation points to an intrinsic value of about €76.63 per share. Compared with the current share price of €88.85, this implies the stock is around 15.9% overvalued on this approach.
Result: OVERVALUED
Our Excess Returns analysis suggests Wendel may be overvalued by 15.9%. Discover 218 high quality undervalued stocks or create your own screener to find better value opportunities.
 MF Discounted Cash Flow as at Mar 2026
Story Continues
For a diversified financials group like Wendel, where sales are a central driver of the business model, the P/S ratio is a useful way to think about what you are paying for each € of revenue. This is particularly relevant when earnings can be influenced by non cash or one off items.
In broad terms, the “right” P/S for a profitable company tends to reflect what the market expects for future growth and how risky those cash flows appear. Higher expected growth or lower perceived risk can justify a higher multiple, while lower growth or higher risk usually calls for a lower multiple.
Wendel currently trades on a P/S of 0.48x. That sits well below the Diversified Financial industry average of 2.90x and the peer group average of 4.84x. Simply Wall St’s Fair Ratio for Wendel is 1.70x. This estimates the P/S that might be reasonable after factoring in elements such as earnings growth, profit margins, industry, market value and company specific risks.
This Fair Ratio is more tailored than a simple comparison to peers or the broad industry because it brings those fundamentals into a single benchmark rather than assuming all companies in the sector deserve similar multiples. Compared with Wendel’s actual 0.48x P/S, the Fair Ratio of 1.70x indicates that the shares appear undervalued on this measure.
Result: UNDERVALUED
 ENXTPA:MF P/S Ratio as at Mar 2026
P/S ratios tell one story, but what if the real opportunity lies elsewhere? Start investing in legacies, not executives. Discover our 97 top founder-led companies.
Earlier we mentioned that there is an even better way to understand valuation. On Simply Wall St’s Community page you can use Narratives to connect your story about Wendel with a set of forecasts and a fair value estimate. You can then see in real time how that fair value compares to the current price to help you decide whether to buy, hold or sell, and watch it update as new information like earnings or news arrives. For example, one investor might build a Narrative that follows the more optimistic €135.0 price target and higher earnings expectations, while another might anchor to the more cautious €104.0 target and lower earnings view. Each Narrative clearly links its assumptions to a calculated fair value, so you can see how different perspectives stack up against the current share price.
Do you think there’s more to the story for Wendel? Head over to our Community to see what others are saying!
ENXTPA:MF 1-Year Stock Price Chart
This article by Simply Wall St is general in nature. We provide commentary based on historical data and analyst forecasts only using an unbiased methodology and our articles are not intended to be financial advice. It does not constitute a recommendation to buy or sell any stock, and does not take account of your objectives, or your financial situation. We aim to bring you long-term focused analysis driven by fundamental data. Note that our analysis may not factor in the latest price-sensitive company announcements or qualitative material. Simply Wall St has no position in any stocks mentioned.
Companies discussed in this article include MF.PA.
Have feedback on this article? Concerned about the content? Get in touch with us directly. Alternatively, email editorial-team@simplywallst.com