
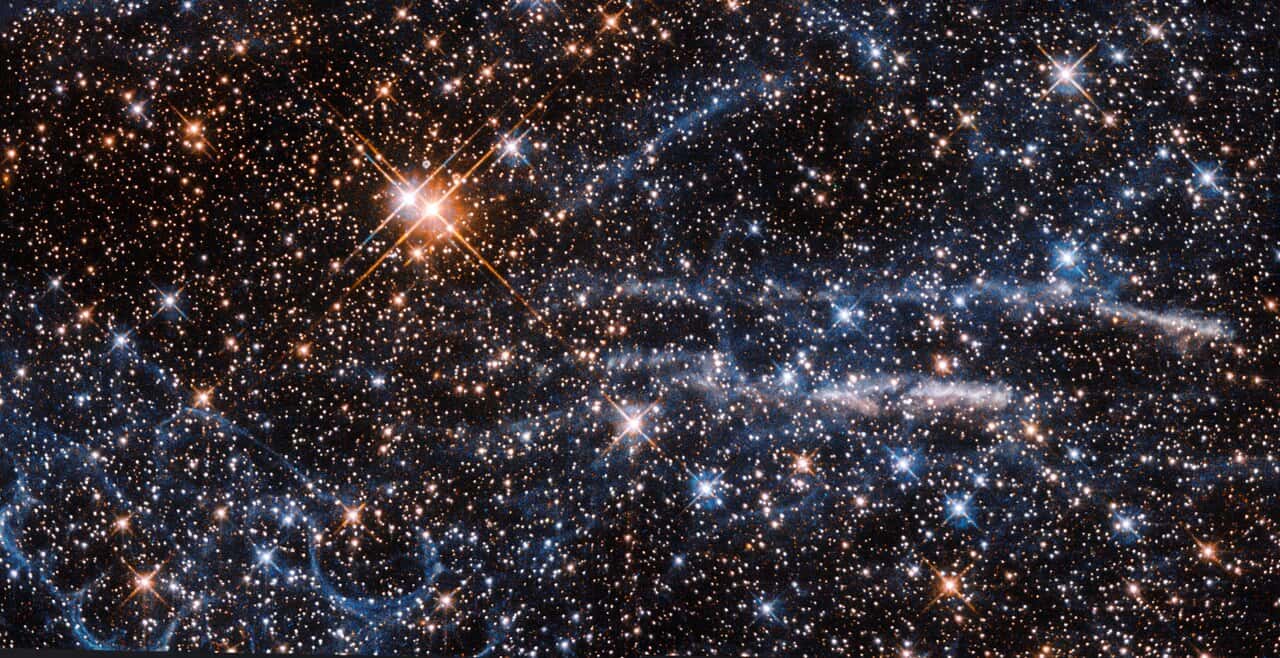
 Section of the Line Intensity Map in question. Detected galaxies are marked in white stars. The inset simulates the structure present in this map once it is zoomed in on and background noise is removed from the data. Credit: HETDEX
For all the impressive maps astronomers have made of the distant universe, much of the action has stayed out of sight. The brightest galaxies were relatively easy to chart. The faint hydrogen glow around them—along with many smaller galaxies—was not.
A new study, published in The Astrophysical Journal, finally changes that. Using data from the Hobby-Eberly Telescope Dark Energy Experiment (HETDEX), researchers built a three-dimensional map of Lyman-alpha light—a specific ultraviolet glow emitted by excited hydrogen—seen as it was 9 to 11 billion years ago.
The result exposes the bigger picture of galactic environments.
Beyond the Brightest Beacons
Traditional galaxy surveys are great at finding the cosmic standouts, but they miss much of the faint emission spread between and around them. Line intensity mapping flips the strategy: instead of focusing only on individually visible galaxies, it measures the combined light from a whole patch of space. That means less detail, but a much fuller view.
“Imagine you’re in a plane looking down. The ‘traditional’ way to do galaxy surveys is like mapping the brightest cities only: you learn where the big population centers are, but you miss everyone that lives in the suburbs and small towns,” said Julian Muñoz, a HETDEX scientist at the University of Texas at Austin.
“Intensity mapping is like viewing the same scene through a smudged plane window: you get a blurrier picture, but you capture all the light and not just the brightest spots.”
HETDEX aims to study dark energy by mapping more than a million bright galaxies, but in the process, it gathered far more information than that main goal required. The survey recorded more than 600 million spectra, and the team had tapped only a small part of that archive.
“We only use a small fraction of all the data we collect, around 5%,” said Dr. Karl Gebhardt, HETDEX principal investigator at the University of Texas at Austin. “There’s huge potential in using that remaining data for additional research.”
×
Thank you! One more thing…
Please check your inbox and confirm your subscription.
For this study, researchers tapped that unused trove to recover faint Lyman-alpha emission beyond the cataloged galaxies.
Turning Noise Into a Map
 CMB sphere mapped by ESA and the Planck Collaboration in 2013. Credit: Wikimedia Commons
Extracting that signal was not simple. The team sifted through roughly half a petabyte of HETDEX data, cleaning the spectra to remove contamination from Earth’s atmosphere, foreground objects, and instrumental artifacts. They then used the positions of known bright galaxies as guides to recover emission from fainter galaxies and surrounding gas.
“So, we can use the location of known galaxies as a signpost to identify the distance of the fainter objects,” said Dr. Eiichiro Komatsu of the Max-Planck Institute for Astrophysics, another co-author.
The study tracked this hydrogen glow across three slices of the early universe. Many of the sources were too faint to make it into the survey’s galaxy catalog on their own, but together they produced a signal strong enough to measure.
The new map gives astronomers a way to check whether their galaxy formation theories match what the universe actually looked like. It may also become more useful when combined with other surveys of the same parts of the sky, helping researchers build a fuller picture of how galaxies grew and how star-forming gas was spread around them.