
In August, the official, or standardly referenced, unemployment rate rose slightly to 4.3%, up from 4.2% in July. This marks the highest level in nearly four years, though it remains historically low.
Although the national unemployment rate provides a broader view of labor market conditions, it often obscures significant variations at the local level. In July 20251, unemployment rates across 387 metropolitan areas varied widely, ranging from a low of 1.8% to a high of 18.9%. Rapid City, South Dakota, and Sioux Falls, straddling South Dakota and Minnesota, reported the lowest unemployment rates in the nation at 1.8%, followed by Bozeman, Montana, at 2.2%. On the higher end, El Centro, California, posted the nation’s highest unemployment rate at 18.9%. Out of all U.S. metro areas, 139 (marked in red) had unemployment rates above the national average of 4.2%, while 229 metro areas (in blue) were below the national rate. The remaining 19 metro areas (in yellow) matched the national average. Among the metro areas with a higher-than-national average unemployment rate, 36% were in the West, 26% in the South, 24% in the Midwest, and 14% in the Northeast. This local analysis indicates a notable regional disparity in labor market conditions.
In the following analysis, we will take a closer look at long-term unemployment and the broader U-6 unemployment rate, both of which provide further insight into the overall health of the labor market.
Long-term unemployment
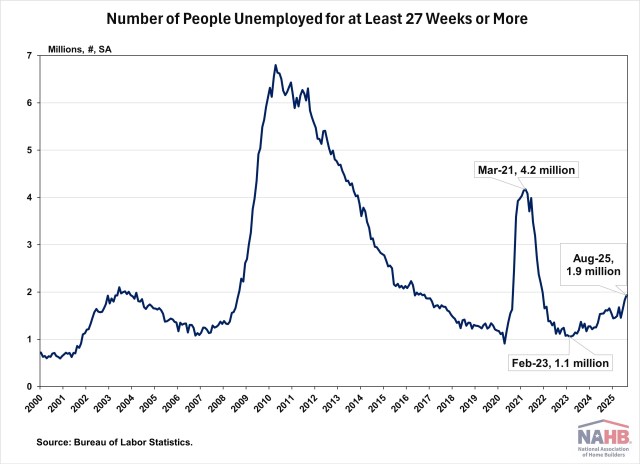
Long-term unemployment, defined by the Bureau of Labor Statistics (BLS), refers to individuals who are currently unemployed2 and whose unemployment has lasted for 27 continuous weeks or more. This group represents a critical measure of labor market health and recent data shows an increasing trend.
As of August 2025, more than 1.9 million Americans have been unemployed for at least 27 weeks. This marks the highest level since the COVID-19 pandemic and is almost double the number seen in early 2023. Today, long-term unemployed individuals account for nearly 26% of the total unemployed people, underscoring signs of a cooling labor market.
Generally, higher levels of education are associated with lower unemployment rates. However, recent trends show a significant rise in long-term unemployment among college-educated workers. A New York Times article reports that college graduates now make up over 30% of the long-term unemployed people. This shift reflects deeper structural changes in the labor market, where automation, technological disruption, and federal job cuts have reduced the demand for roles traditionally held by degree-holders.
Long-term unemployment doesn’t just signify a prolonged job search—it often signals deeper detachment from the labor market. According to a research paper titled “Are the Long-Term Unemployed on the Margins of the Labor Market?”3, only 11% of individuals who are long-term unemployed in a given month managed to secure steady, full-time employment a year later. Even for those who do find work, the clock isn’t necessarily reset. Many experience recurrent joblessness, often cycling between short-term employment and periods of unemployment, which prevents long-term economic stability and career progression.
The U-6 Unemployment Rate
To fully understand the state of the labor market, it’s important to look beyond the official U-3 rate and consider broader measures like the U-6 unemployment rate4. The U-6 unemployment rate offers a more comprehensive view of unemployment than the official U-3 rate. In addition to the total number of unemployed, U-6 includes all people marginally attached to the labor force, and individuals working part-time for economic reasons (also known as involuntary part-time workers). It is expressed as a percentage of the civilian labor force plus the marginally attached.
Mathematically, the U-3 and U-6 unemployment rates can be calculated using the following equations:
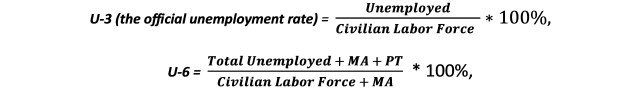
Where MA refers to all people marginally attached to the labor force, and PT refers to individuals working part-time for economic reasons (also known as involuntary part-time workers).
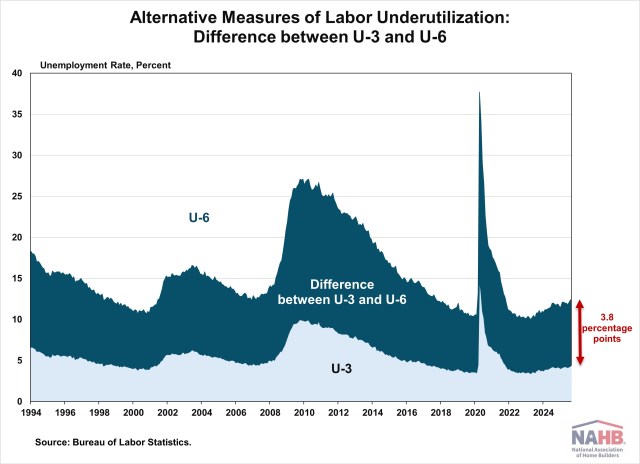
A larger gap between the U-3 and U-6 rates indicates higher underemployment and greater labor market slack that is not captured by the official U-3 rate. Historically, this gap has ranged from 2.9 to 8.1 percentage points, often widening significantly during periods of recession. In August 2025, the gap stood at 3.8 percentage points. While this is still relatively low, it has been gradually increasing over the past two years. This upward trend may indicate that more workers are facing part-time work due to economic constraints or are struggling to find adequate employment that matches their skills and availability.
Conclusion
Overall, the U.S. labor market is showing signs of cooling as economic and policy uncertainty rise. While the official unemployment rate (U-3) remains low by historical standards, recent data points to a gradual softening. The share of long-term unemployed individuals continues to rise, and job openings declined in July—signaling reduced hiring demand. As the pace of hiring slows and job seekers face longer and more difficult searches, understanding these deeper trends is increasingly critical. The Federal Reserve’s interest rate cuts at its September meeting, along with another 75 basis points of easing in the coming quarters, may help cushion the labor market and prevent further deterioration.
Note:
Discover more from Eye On Housing
Subscribe to get the latest posts sent to your email.