

Experiment setup
The IPV group used to develop the models consists of 841 female patients enrolled in the domestic abuse intervention and prevention center at a US Academic Health Center (AHC1) between 2017 to 2019 and 2021 to 2022, through either self-reporting or clinician referral. We exclude patients from 2020 due to its unique nature because of COVID-19, marked by a drop in patients reporting IPV and notable shifts in injury patterns26. This group is accompanied by 5,212 demographics-matched non-IPV (control) patients. The control group is constructed in a two-step process: (1) random sampling of female patients in the AHC, excluding any patients who carry any ICD code diagnoses of physical and non-physical abuse (2) matching based on demographic characteristics to ensure similarity to the IPV group. Details on the matching process are provided in the Methods section.
We validate our models on three cohorts of patients, each with demographics-matched control patients. The IPV patients in the first validation cohort include AHC1 patients who enrolled in the DAIP in 2023. Recognizing the limitation of using patients motivated to seek help at the DAIP centers, the second validation cohort includes patients who carried diagnoses of IPV at the AHC1 from 2021 to 2023 but did not enroll in any DAIP. This group of IPV patients is defined as carrying ICD-10 code diagnoses that include both physical and non-physical abuse. The last validation cohort includes IPV patients enrolled in DAIP2 in AHC2, a different hospital from the same healthcare network. Patients under 18 were excluded from all cohorts. Figure 1 summarises all cohorts for model development and validation.
Fig. 1: Model development and validation cohorts.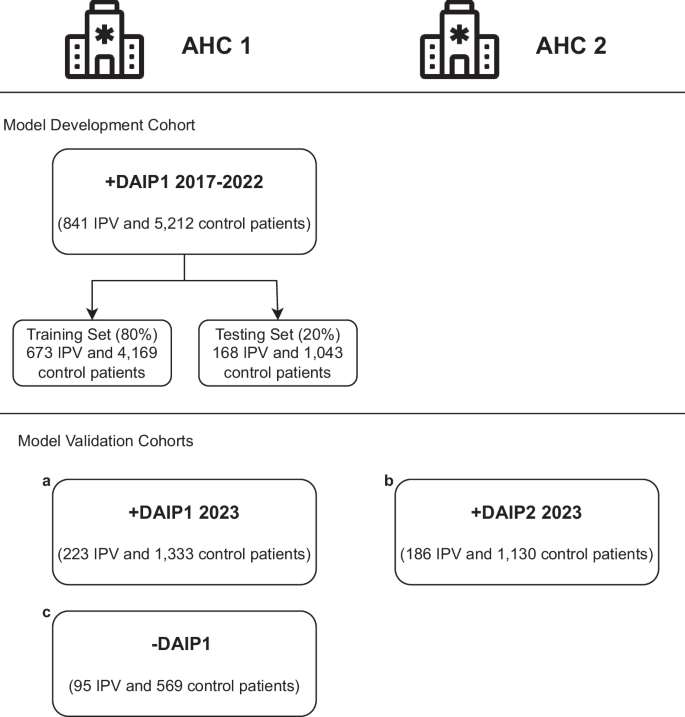
The patients come from two U.S. Academic Health Centers (AHC1 and AHC2) in an integrated care system. The models are developed with patients enrolled in the domestic abuse intervention and prevention center in AHC1 from 2017-2022 (AHC1 + DAIP1 2017-2022), excluding 2020 patients. The patients are separated patient-wise into training (80%) and testing (20%) sets. The models are validated on three cohorts of patients: (a) AHC1 + DAIP1 2023: patients enrolled in DAIP1 at AHC1 during 2023, with optimally-matched control patients, (b) AHC2 + DAIP2 2023: patients enrolled in DAIP2 at AHC2 during 2023, with optimally matched control patients, (c) AHC1-DAIP1: patients with IPV-related diagnoses but did not seek help from DAIP1 at AHC1 from 2021 to 2023, with optimally-matched control-patients.
To assess each patient’s evolving risk of IPV, we make daily predictions when patients encounter the hospital system on whether they might be experiencing IPV. To prevent target leakage, we adopt a patient-level splitting strategy; we train with 80% of the patients and test with 20% of the patients. All observations of a specific patient are assigned to either the training or testing group. For self-reported IPV patients, all corresponding observations are labeled as ‘IPV’ (case), while all observations for control patients are labeled as ‘non-IPV’ (control). This labeling scheme maintains consistency in classifying IPV observations, encouraging the model to capture risk factors that could indicate a higher likelihood of IPV, detect early signs of abuse before self-reporting, and allow for continuous monitoring of IPV likelihood over time.
Model performance
We evaluate model performance using the area under the receiver operating characteristic curve (AUC), sensitivity (true positive rate), and specificity (true negative rate), which are well-suited metrics for evaluating unbalanced learning taks27. For IPV identification in practice, it is crucial to balance sensitivity and specificity. False negatives can lead to victims not receiving care or intervention, leaving them vulnerable to continued abuse. False positives can result in individuals being wrongly labeled as victims, leading to unnecessary interventions, emotional distress, and possible harm to the patient-clinician relationship. We report these values for both the test set and the validation sets.
On the out-of-sample test set in the AHC1 + DAIP1 2017–2022 cohort, the tabular models can predict IPV risk with an AUC of 0.85 and the clinical notes model with an AUC of 0.87. The HAIM fusion model yields an AUC of 0.88, outperforming both single-modality models. On the AHC1 + DAIP1 2023 cohort, all models maintain an AUC above 0.82, with the HAIM fusion model having a nearly equal AUC of 0.88. Although the HAIM fusion model consistently outperforms the single-modality models, the tabular data-only model can perform comparably as a standalone model for IPV risk assessment when clinical texts are unavailable or difficult to collect. The performance of the three models on the AHC1 + DAIP1 cohorts is shown in Fig. 2a. The AUC performance of the tabular and fusion model across demographic subgroups is presented in Supplementary Tables 1A and 1B.
Fig. 2: The receiver operating characteristic (ROC) curves of the tabular model, notes model, and HAIM fusion model on all cohorts.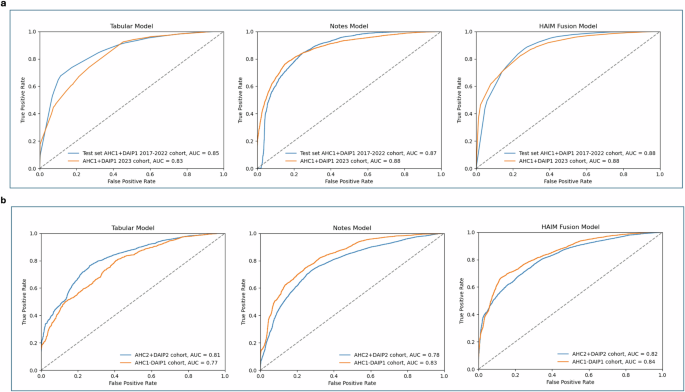
a On the out-of-sample test set in the model development cohort (AHC1 + DAIP1 2017–2022 cohort), the tabular model has an AUC of 0.85 and the notes model has an AUC of 0.87. The HAIM outperforms both single-modality models with an AUC of 0.88. On the internal validation cohort (AHC1 + DAIP1 2023 cohort), all models maintain an AUC above 0.83, with the HAIM fusion model having a nearly equal AUC of 0.88. b On the IPV patients in AHC2 (AHC2 + DAIP2 2023 cohort), the tabular model has an AUC of 0.81 and the notes model has an AUC of 0.78. On the AHC1 IPV patients who did not seek help at the domestic abuse intervention and prevention center, the tabular model has an AUC of 0.81 and the notes model has an AUC of 0.78. The HAIM fusion model maintains stable and superior performance, with AUCs of 0.82 and 0.84 for the two cohorts respectively. AHC=Academic Health Center, DAIP=domestic abuse intervention and prevention.
We calibrate the predicted probabilities to accurately reflect the likelihood of IPV presence using isotonic regression28 (results in Supplementary Fig. 1). Given the calibrated probabilities, we evaluate the Tabular and Fusion models’ accuracy, sensitivity, and specificity. We compare and select the probability threshold that balances test-set sensitivity and specificity. The comparison and the performance of these thresholds on the internal validation cohort are presented in Supplementary Table 2. Both models can achieve above 73% sensitivity and specificity with the chosen threshold.
Prediction-report lead time in self-report patients
Our models can detect IPV risk years before the patients enroll in the DAIP center. In the AHC1 + DAIP1 2023 cohort, the tabular model can detect 68% of IPV cases ahead of time, while the fusion model can predict 80.6% of cases in advance. We note that the dataset only includes data from 2017 onwards to align with the rollout of a new electronic medical record system at both AHCs. This restricts our ability to identify cases at the earliest stages. We calculate a prediction-report lead time by comparing the patient’s first self-report date with the earliest date the model detected IPV; a positive result indicates early detection. Figure 3 presents the relationship between the largest possible time gap (the difference between the report date and the date with the earliest available data) and the prediction-report time gap. The tabular model achieves a mean lead time of 3.99 years and a median lead time of 5.32 years, whereas the fusion model has an average lead time of 3.68 years and a median lead time of 4.61 years. While the tabular model has higher mean and median prediction lead times, the fusion model can detect more IPV cases in advance.
Fig. 3: Prediction-report lead time in self-report patients.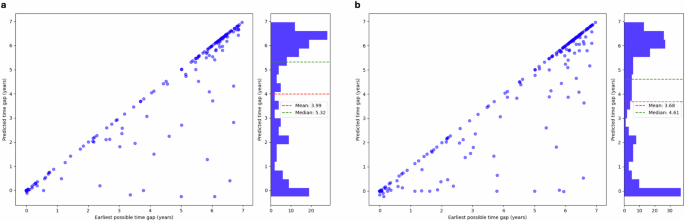
The prediction-report lead time is calculated as the difference between the patient’s first self-report date and the earliest date when the model detected IPV; a positive result indicates early detection. We compare this value to the earliest possible time gap: the difference between the first time the patient encounters the healthcare system and when they report IPV. Both the tabular model (a) and the fusion model (b) can detect IPV risk on average more than three years in advance. While the tabular model has slightly higher mean and median prediction lead times, the fusion model can detect more IPV cases in advance.
Validation results
We further validate the models on two additional validation cohorts: IPV patients enrolled in the domestic abuse intervention and prevention center at AHC2 from the same integrated care system (AHC2 + DAIP2) and AHC1 IPV patients who did not seek support from DAIP (AHC1-DAIP1). The performance of the models on the validation cohorts is shown in Fig. 2b.
For AHC2 patients, the tabular model yields an AUC of 0.81, and the clinical notes model an AUC of 0.78 while the merged model achieves an AUC of 0.82. On the AHC1-DAIP1 cohort, the tabular model yields an AUC of 0.77, and the notes model has an AUC of 0.83. The HAIM fusion model outperforms both models with an AUC of 0.84. The enrollment of IPV victims in domestic abuse intervention and prevention centers can change patterns in healthcare utilization, introducing potential feature variations when compared with the patients who disclosed IPV but did not seek help from DAIP. This could account for the variation in the tabular model’s performance. Overall, the validation results demonstrate the models’ generalizability to external populations and their potential to identify unreported IPV cases.
Predictive features
Since the clinical texts are encoded using a transformer-based language model, it is challenging to determine which risk factors in clinical texts inform the predictions of the notes and the fusion model. Nonetheless, we can approximate the feature importance of the tabular model using the SHapley Additive exPlanations (SHAP)29. Using the SHAP Python library, we identify the most important features in the tabular model and use a SHAP summary plot to visualize the overall impact of these features on model predictions30. The SHAP summary plot is presented in Fig. 4.
Fig. 4: SHAP summary plot for the tabular model.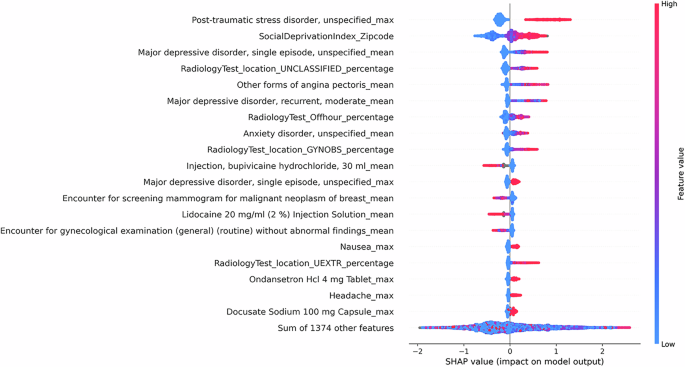
The SHAP summary plots visualize the SHAP values of the 20 most important features in the tabular model. Each dot on the plot represents a prediction instance, with the color indicating the value of the feature. The position on the horizontal axis depicts the direction and magnitude contribution to the individual prediction (right for a higher likelihood of IPV, left for a lower likelihood of IPV). The SHAP summary plot gives a global understanding of feature importance and how individual features impact predictions. Features with high SHAP values for red dots indicate a potential positive correlation between high feature values and increased IPV risk, while high SHAP values for blue dots indicate the opposite.
We observe that specific clinical features, such as mental health disorders, chest pain, and painkiller use are correlated with a greater likelihood of IPV. Additionally, social factors such as high social deprivation are observed with higher levels of IPV risk. Aside from capturing social factors and trauma-related health outcomes, we note that the model captures injury and healthcare utilization patterns related to IPV. Notably, we observe a correlation between the high utilization of radiology tests for the upper extremity and unclassified locations (often seen in ED setting) and a higher probability of IPV presence, consistent with previous research findings15,31. On the contrary, high utilization of mammography and cervical cancer screening could indicate a lower likelihood of IPV presence. This observation may be explained by varied access to healthcare and preventive services across different patient populations. Patients who attend regular screening likely have better access to healthcare and support services. Additionally, their involvement in preventive healthcare services may suggest a lower fear of seeking medical attention, in contrast to the reluctance seen in IPV patients4.
The SHAP summary plots for language-based models (the clinical notes model and the fusion model) are provided in Supplementary Figs. S2 and S3. Since each note is represented using the language model embedding of the note, the SHAP plot shows which embedding features contribute the most to the predictions, rather than words or phrases directly from the notes. However, they provide information on which portions (type of note) contribute most to the predictions of the model, allowing the possibility to trace back to the original note when further explanation is needed.